. 2024 Dec;636(8042):404-411.
doi: 10.1038/s41586-024-08217-y. Epub 2024 Nov 20.

Examining the role of common variants in rare neurodevelopmental conditions

Affiliations

Examining the role of common variants in rare neurodevelopmental conditions

Qin Qin Huang et al. Nature. 2024 Dec.

Abstract

Although rare neurodevelopmental conditions have a large Mendelian component1, common genetic variants also contribute to risk2,3. However, little is known about how this polygenic risk is distributed among patients with these conditions and their parents nor its interplay with rare variants. It is also unclear whether polygenic background affects risk directly through alleles transmitted from parents to children, or whether indirect genetic effects mediated through the family environment4 also play a role. Here we addressed these questions using genetic data from 11,573 patients with rare neurodevelopmental conditions, 9,128 of their parents and 26,869 controls. Common variants explained around 10% of variance in risk. Patients with a monogenic diagnosis had significantly less polygenic risk than those without, supporting a liability threshold model5. A polygenic score for neurodevelopmental conditions showed only a direct genetic effect. By contrast, polygenic scores for educational attainment and cognitive performance showed no direct genetic effect, but the non-transmitted alleles in the parents were correlated with the child's risk, potentially due to indirect genetic effects and/or parental assortment for these traits4. Indeed, as expected under parental assortment, we show that common variant predisposition for neurodevelopmental conditions is correlated with the rare variant component of risk. These findings indicate that future studies should investigate the possible role and nature of indirect genetic effects on rare neurodevelopmental conditions, and consider the contribution of common and rare variants simultaneously when studying cognition-related phenotypes.


Conflict of interest statement

Competing interests: M.E.H. is a cofounder of, consultant to and holds shares in Congenica, a genetics diagnostic company and is also a consultant to AstraZeneca Centre for Genomics Research.

Figures
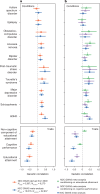
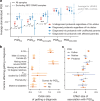
Fig. 1
Fig. 1. Genetic correlations between neurodevelopmental conditions and other brain-related traits and conditions.
a, Points show the estimates from linkage disequilibrium score regression for the DDD GWAS (orange) and the meta-analysis of neurodevelopmental conditions (NDCs) between DDD and GEL (blue). b, Points show the estimates for the meta-analysis after conditioning on the GWAS summary statistics for educational attainment (green) or cognitive performance (purple) using GenomicSEM. Error bars show 95% confidence intervals. One asterisk indicates nominally significant results (*P < 0.05) and a double asterisk indicates significant results that passed the Bonferroni correction for 13 traits and conditions (**P < 0.0038). Exact estimates and two-sided P values are reported in Supplementary Table 4.
Fig. 2
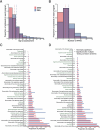
Fig. 2. Disentangling polygenic score associations with diagnostic status.
a, Average polygenic scores (PGSs) in probands with (‘diagnosed’; N = 3,821; dark blue) versus without (‘undiagnosed’; N = 6,345; red) a monogenic diagnosis, from DDD and GEL combined. Diagnosed probands from trios split by parental affectedness are in light blue. The scores have been standardized such that the controls have mean 0 and variance 1. Subgroups that have significantly different average polygenic score from controls (dashed line) are indicated by an asterisk (*P < 0.05) or double asterisk (**P < 0.01 after Bonferroni correction for five polygenic scores). Significant differences between diagnosed (dark blue) and undiagnosed (red) patients are annotated with P values. See Supplementary Table 5 for results of two-sided t-tests comparing the various groups. UKHLS, UK Household Longitudinal Study. b, Associations between various factors and diagnostic status within the full DDD cohort, with or without correcting for the proband’s PGSEA (N = 7,549), calculated within probands of GBR ancestry (individuals with genetic similarity to British individuals from the 1,000 Genomes Project) using logistic regression. An odds ratio (shown in points) greater than one indicates that that factor is associated with a higher chance of receiving a monogenic diagnosis. FROH, the fraction of the genome in runs of homozygosity; ID/DD, intellectual disability or developmental delay. c, Associations between these factors and DDD probands’ (N = 7,549), mothers’ or fathers’ PGSEA (N = 2,497). Points show effect sizes assessed by linear regression. A double asterisk indicates that the association passed Bonferroni correction for seven factors (see Supplementary Table 8 for exact P values). The expected value of FROH is 0.0625 for individuals whose parents are first cousins. P values in all panels are two-sided. Error bars show 95% confidence intervals.
Fig. 3
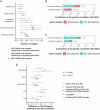
Fig. 3. Polygenic background in parents of patients with neurodevelopmental conditions.
a, pTDT in undiagnosed probands with unaffected parents. Plotted is the mean pTDT deviation (difference between the child’s polygenic score and the mean parental score, in units of the s.d. of the latter) in trios from GEL and DDD (N = 2,866, or N = 1,567 for testing PGSNDC,DDD). We tested whether this is significantly different from 0 using two-sided one-sample t-tests. b, Mean polygenic scores for undiagnosed probands or their unaffected parents in the trios used in the pTDT analysis, standardized using the weighted MCS controls whose mean is indicated by the dotted line. See Supplementary Tables 9 and 7 for results of pTDT and two-sided t-tests, respectively. Subgroups that have a significantly different average polygenic score from controls are indicated by an asterisk (*P < 0.05) or double asterisk (**P < 0.01 after Bonferroni correction for five polygenic scores). Error bars in both plots show 95% confidence intervals.
Fig. 4
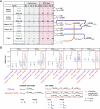
Fig. 4. Assessing direct genetic effects and associations with non-transmitted parental alleles.
The plot shows effect sizes of polygenic scores on case status, testing either the child’s polygenic score alone (proband-only model) among trio probands or while also controlling for the parents’ scores (trio model). Logistic regression models (annotated in the figure) were fitted to compare undiagnosed probands with neurodevelopmental conditions from 2,866 trios from DDD + GEL (or 1,567 trios for testing PGSNDC,DDD) in which parents are unaffected with 4,804 control trios. 1NDC status is an indicator for whether the proband has a neurodevelopmental condition (1) or is a control (0). In the trio model, the coefficients on the parental polygenic scores are referred to as the non-transmitted coefficients (θ^m,NT and θ^f,NT), whereas the coefficient on the child’s score is called the direct effect (δˆ). Error bars indicate 95% confidence intervals. One asterisk indicates nominally significant results (*P < 0.05) and double asterisk (**P < 0.01) indicates significant results that passed the Bonferroni correction for five polygenic scores. See Supplementary Table 10 for two-sided P values.
Fig. 5
Fig. 5. Correlation between rare variant burden scores and polygenic scores.
Points represent Pearson correlation coefficients between the number of inherited rare damaging coding (left) or synonymous variants (right, negative control) in constrained genes and polygenic scores within or between different sets of individuals. In blue are the correlations within probands with neurodevelopmental conditions whose parents are unaffected (the child’s rare variant burden score (RVBS) correlated with their own polygenic score), and in purple are the correlations within their parents. In orange is the cross-parental correlation (one parent’s rare variant burden score correlated with the other parent’s polygenic score). We calculated the correlations in trios with neurodevelopmental conditions from DDD and GEL (N = 3,999 or 2,553 for PGSNDC,DDD excluding samples from the original GWAS). Note that both the rare variant burden scores and polygenic scores have been corrected for 20 genetic principal components. Error bars represent 95% confidence intervals. One asterisk indicates nominally significant correlations (*P < 0.05) and the double asterisk indicates significant correlations that passed the Bonferroni correction for ten tests (five polygenic scores and two variant types) (**P < 0.005). See Supplementary Table 12 for exact estimates and two-sided P values.
Extended Data Fig. 1
Extended Data Fig. 1. Outline of main questions and analyses in this paper, and the key findings from these.
We conducted a GWAS of neurodevelopmental conditions in GEL, and meta-analysed the results with the DDD-derived GWAS. We calculated genetic correlations between neurodevelopmental conditions and various brain-related conditions and traits using published GWAS summary statistics (Fig. 1), then estimated the fraction of each genetic correlation that was explained by genetic effects shared with educational attainment (Supplementary Fig. 1). Next we constructed polygenic scores for neurodevelopmental conditions and relevant traits using the DDD-derived GWAS and external GWASs. We tested for differences in average polygenic scores between patients with versus without a monogenic diagnosis (Fig. 2). Given that clinically unaffected parents and probands showed similar polygenic background (Fig. 3), we tested whether non-transmitted common alleles in the parents were correlated with their child’s risk of neurodevelopmental conditions (Fig. 4), and explored two potential explanations. In the figure in the bottom right, T and NT indicate transmitted and non-transmitted alleles in the parents, respectively. We indicate two possible reasons (left and right) that parental non-transmitted alleles may associate with the child’s phenotype, both of which can pertain to either maternal and/or paternal non-transmitted alleles. The first is that prenatal risk factors, specifically prematurity, might mediate the correlation between parental non-transmitted alleles and child’s risk (Extended Data Fig. 9) (a type of indirect genetic effect, which has a causal interpretation, hence the arrow); we did not find significant evidence for this (Supplementary Fig. 5). A second possible explanation we explored (blue box) is that the non-transmitted common alleles may simply tag rare variant effects due to parental assortment (hence, the association may simply reflect correlation with the causal factor, as indicated by the dotted line). We show a correlation between common and rare variant components of risk for neurodevelopmental conditions in Fig. 5.
Extended Data Fig. 2
Extended Data Fig. 2. Schematic illustrating key concepts in the paper.
(A) Illustration of the liability threshold model for rare neurodevelopmental conditions. The figure shows why one might expect patients with a monogenic diagnosis to have less polygenic (common variant) risk than those without a monogenic diagnosis. The normal distribution represents the underlying distribution of liability in the population, which is assumed to be Gaussian. Both genetic and environmental factors of different effects contribute to this total liability. Each panel represents a hypothetical example of one individual, either unaffected, affected and diagnosed with a monogenic cause, or affected and without a monogenic diagnosis. The red line indicates a threshold for being diagnosed with neurodevelopmental conditions. Circles represent different genetic factors, and diamonds represent environmental factors. The size of circles and diamonds represents their impact on disease risk. The second patient, who has a monogenic diagnosis, has fewer green circles (fewer NDC risk-increasing common variants) than the undiagnosed patient on the right, since the orange circle (diagnostic large-effect variant) is sufficient on its own to push the diagnosed patient over the diagnostic threshold. (B) Illustration of how parental assortment leads to correlation between the common and rare variant components of risk for neurodevelopmental conditions. The figure shows three hypothetical families in which the mother in each pair has a similar level of cognitive ability/educational attainment to the father (a phenomenon called parental assortment). Mother and father from the same family also have similar genetic predispositions towards these traits and hence also towards risk of NDCs. Numbers on the bottom of each jar represents the simulated count of risk alleles from NDC-associated common variants represented by green circles (PGS) and that from NDC-associated rare variants represented by blue circles (RVBS). In the lefthand two families, both parents have a low risk for NDCs, as shown by the total height of the blue and green circles being well below the liability threshold indicated by the red line. Children in these two families have inherited about the expected number of parental common and rare variant risk alleles (the average of their parents) and also have low risk for developing NDCs. In the third family, both parents are not clinically affected by NDCs but both have subclinical phenotypes (for example, mild learning difficulties) due to having more risk alleles at rare (lefthand parent) or common (righthand parent) variants which contribute to reduced cognitive performance. Their child’s risk is above the diagnostic threshold indicated by the red line. In the parents’ generation, when parental assortment starts, there is no significant correlation between PGS and RVBS (two-sided P = 0.87, Pearson correlation r = 0.08 using the simulated counts). In their children, those who have more polygenic risk also tend to have more rare variant risk (correlation between PGS and RVBS is significant with P = 0.023, r = 0.999). Note that the values for PGS and RVBS have been chosen deliberately to emphasize the point for illustrative purposes, but the correlation in the child is much weaker than this in reality (Fig. 5). Also note that when analysing the real data, we regressed out principal components from PGS and RVBS before calculating the correlations.
Extended Data Fig. 3
Extended Data Fig. 3. Phenotypic comparisons between DDD and GEL.
Distribution of age at assessment (A) and number of HPO terms (B) in both DDD and GEL probands with neurodevelopmental conditions who have GBR ancestry. The vertical lines indicate the means. A small number of probands in each program were aged over 50 and had more than 30 HPOs, and these have been omitted from the plot due to data sharing restrictions. (C) Proportion of probands from each cohort with at least one HPO term within the indicated chapter (black text) or specific phenotype (green text), ordered by the prevalence in DDD. The asterisks indicate results from a logistic regression testing whether there was a significant difference in phenotype prevalence between cohorts after controlling for sex and age (** indicates two-sided P < 0.05/43; * indicates two-sided P < 0.05; exact P values are annotated beside the asterisks). (D) Proportion of probands recruited to both DDD and GEL (N = 789) with at least one HPO term within the indicated chapter (black) or specific phenotype (green text) from the phenotype information from each program, ordered by the prevalence in DDD. The same logistic regression was used as in (C).
Extended Data Fig. 4
Extended Data Fig. 4. GWAS meta-analysis of neurodevelopmental conditions.
We meta-analyzed the GWASs derived from DDD-UKHLS (6,397 cases with neurodevelopmental conditions and 9,270 controls from UKHLS) and GEL (3,618 cases and 13,667 controls). We used overlapping SNPs with MAF > 1% in both cohorts. (A) Manhattan plot. The red line indicates the genome-wide significance threshold (5×10⁻⁸). (B) Quantile-quantile plot. GWAS summary statistics including exact P values are available in Supplementary Data 3.
Extended Data Fig. 5
Extended Data Fig. 5. Average polygenic scores in undiagnosed (red) and diagnosed (blue) probands with neurodevelopmental conditions from DDD and GEL combined.
PGSs were standardized so that, after reweighing to adjust for sampling and non-response bias, MCS children had mean of 0 and s.d. of 1 (see Methods and Supplementary Note 4). Subsets of probands with neurodevelopmental conditions and their parents from trios are shown in light red (undiagnosed subsets) and light blue (diagnosed subsets). PGSNDC,DDD was tested in a held-out set of patients in DDD that were not included in the original GWAS as well as in GEL. Error bars show 95% confidence intervals. Asterisks in blue or red indicate subgroups that showed significantly different PGS compared to weighted MCS control children indicated by the horizontal line. Black asterisks indicate significant differences in average PGS between two subgroups highlighted by brackets which are specifically mentioned in the main text. One asterisk indicates nominally significant differences (P < 0.05) and a double asterisk indicates significant differences that passed Bonferroni correction for five PGSs (P < 0.01). See also Supplementary Table 7 for results of two-sided t-tests comparing groups.
Extended Data Fig. 6
Extended Data Fig. 6. Average polygenic scores in various subgroups.
A) Average polygenic score for educational attainment (PGSEA) in different control cohorts and subsets thereof, subsets of probands with neurodevelopmental conditions, and their unaffected parents. B) Comparing average PGSEA in trio probands and probands who did not have genetic data on both parents in ALSPAC, MCS, and affected patients from DDD and GEL. Note that in the case of DDD, “in trios” refers to those who had exome sequence data on both parents (only a subset of which also had genotype array data, since we prioritized genotyping full trios for which the child was undiagnosed), whereas in the rest of the manuscript (except for Fig. 2b which uses the same definition as here), “trio proband” refers to those who had genotype data on both parents. C) Average polygenic scores for all five traits in MCS before and after reweighting to adjust for sampling bias and attrition. Note that the PGS are corrected for 20 PCs and then normalized so that a combined set of unrelated controls from UKHLS and GEL have mean of 0 and s.d. of 1. Error bars show 95% confidence intervals. See Supplementary Table 6 for results of two-sided t-tests comparing the various groups.
Extended Data Fig. 7
Extended Data Fig. 7. Factors associated with having a monogenic diagnosis in DDD.
(A) Association between different configurations of affected relatives and the child’s PGSEA (left) or the odds of getting a monogenic diagnosis (right). Left: Average proband PGSEA in subgroups with different configurations of affected relatives based on the number of affected parents, siblings, and more distant relatives. Right: Odds ratio for having a monogenic diagnosis, compared to probands with no affected relatives, estimated from logistic regression. See Supplementary Methods for a description of how this was calculated. (B) Association between proband’s PGSEA and diagnostic status, with or without correcting for technical, clinical and prenatal factors that are associated with receiving a monogenic diagnosis in DDD, assessed via logistic regression. We corrected for each factor individually (light purple), and also corrected both trio status and prematurity in a joint model (dark purple). In the joint model, we did not include factors that were not associated with PGSEA (sex and maternal diabetes) or diagnostic status (FROH) (Fig. 2), nor factors that are likely the consequence of having or not having a monogenic diagnosis, rather than a cause of getting a diagnosis (severity of ID/DD or having any affected family members). One asterisk indicates nominally significant results (P < 0.05) and double asterisk indicates significant results that passed Bonferroni correction for seven factors. See Supplementary Table 8 for exact estimates and two-sided P values. Error bars show 95% confidence intervals in both panels.
Extended Data Fig. 8
Extended Data Fig. 8. Exploring sex differences in polygenic risk.
A) Comparison of polygenic scores between undiagnosed male and female probands in DDD and GEL combined. We used all undiagnosed probands with neurodevelopmental conditions regardless of trio status in this analysis (N = 1,426 females and N = 2,427 males in DDD; N = 112 females and N = 146 males in DDD excluding GWAS samples; N = 918 females and N = 1,574 males in GEL). Square points show the differences in average polygenic scores between female and male probands. A positive difference indicates that female probands have higher PGS than male probands. B) Comparison of polygenic scores between unaffected mothers and fathers of undiagnosed probands from a combined sample of 1,523 trios and 1,343 trios from DDD and GEL, respectively. Triangles show the differences in average polygenic scores between mothers and fathers. A positive difference indicates that mothers have higher PGS than fathers. Two-sided t-tests were used to compare average PGSs in A) and B). C) pTDT results in undiagnosed female and male probands with unaffected parents (N = 586 females and N = 937 males in DDD; N = 99 females and N = 125 males in DDD excluding GWAS samples; N = 490 females and N = 853 males in GEL). We tested if probands’ polygenic scores deviated from the mean parental polygenic scores using two-sided one-sample t-tests. Points show the mean pTDT deviation (difference between the child’s polygenic score and the mean parental polygenic score, in units of the s.d. of the latter). Error bars show 95% confidence intervals. The significant result that passes Bonferroni correction of five tests is highlighted by a double asterisk. See Supplementary Table 9 for results of pTDT.
Extended Data Fig. 9
Extended Data Fig. 9. Exploring prenatal factors that may influence risk of neurodevelopmental conditions.
(A) Points show genetic correlations between neurodevelopmental conditions and prenatal risk factors, before and after conditioning on educational attainment or cognitive performance. Genetic correlations with our GWAS meta-analysis for neurodevelopmental conditions were estimated using Linkage Disequilibrium Score Regression. Those conditioned on the GWAS summary statistics for educational attainment or cognitive performance were estimated using GenomicSEM. See Supplementary Table 11 for exact estimates of genetic correlations and two-sided P values. (B) Percentage of the genetic correlation between neurodevelopmental conditions and prenatal risk factors that is explained by the latent educational attainment (EA) variable estimated using GenomicSEM (red bars and percentage written in text). Green bars indicate the contribution from the non-EA latent variable. The estimates are standardized so that the total height represents the genetic correlation between neurodevelopmental conditions and prenatal risk factors. (C) Percentage of the genetic correlation between neurodevelopmental conditions and prenatal risk factors that is explained by the latent cognitive (Cog) variable (red bars and percentage written in text). Green bars indicate the contribution from the non-cognitive (Non-Cog) variable. In (B) and (C), we focused on prenatal factors that showed significant genetic correlations with neurodevelopmental conditions. (D) Association between PGSs and prematurity, a risk factor for neurodevelopmental conditions. Points show the differences in PGSs between premature and term probands, estimated in DDD using linear regression models. See Supplementary Table 8 for exact two-sided P values and sample sizes. Note that for PGSNDC,DDD, probands who were included in the GWAS were not tested, which left 703 probands, of which 83 were born prematurely. A negative estimate indicates that probands who were born prematurely had a lower polygenic score than term probands, or their parents had a lower polygenic score than the parents of term probands. Associations that pass Bonferroni correction for five traits in (A) or five polygenic scores in (B) are indicated by a double asterisk and nominally significant (P < 0.05) results by one asterisk. Error bars show 95% confidence intervals.
Extended Data Fig. 10
Extended Data Fig. 10. Exploring how the correlation between rare and common variant components of risk for NDCs affects estimates from the trio model.
(A) Illustration of how assortment-induced correlation between common and rare components of risk for neurodevelopmental conditions affects the non-transmitted coefficients but not the estimate of the direct genetic effect in the trio model. We simulated three NDC trios and three control trios. Each individual has a polygenic score (PGS) and a rare variant burden score (RVBS), representing the measured common and rare variant risk for NDCs, respectively. The child in each trio family has inherited about the expected number of risk alleles (the average of their parents) - the transmitted alleles (T). In these simulated hypothetical families, the child does not show significant deviation from parental average, which is what we observe for PGSEA (Fig. 3). We also show the PGS and RVBS derived from the parental non-transmitted risk alleles (NT). An individual’s PGS is correlated with their RVBS (black double arrows) due to parental assortment which started in previous generations (Extended Data Fig. 2b). However, in these hypothetical families, the child’s PGS deviation from their parental average is not significantly correlated with their RVBS deviation (grey double arrows). In the ‘proband-only model’, θT captures both the association between child’s PGS and NDC risk and the association between child’s RVBS and NDC risk (blue solid arrow) due to the correlation between child’s PGS and RVBS. In the ‘trio model’, the parental non-transmitted coefficients (θm,NT, θf,NT) capture the effects of both the parental PGS and RVBS (purple solid arrows) for the same reason. However, the coefficient on the child’s PGS (the estimate of the direct genetic effect, δ) captures the association of the deviation from parental average PGS due to Mendelian segregation (orange solid arrow), which is uncorrelated with the rare variant effects. Note that the values for PGS and RVBS have been chosen deliberately to emphasize the point for illustrative purposes, but real correlations between the measured scores are much weaker (Fig. 5). We used simulated counts to calculate Pearson correlation coefficients and reported two-sided P values. (B) Effect sizes of PGS and RVBS on case/control status within GEL estimated from the ‘proband-only’ and ‘trio’ models. Two-sided P values and effect sizes (reported in Supplementary Table 10) were estimated from logistic regression models fitted to 1,343 trios in which the proband with a neurodevelopmental condition is undiagnosed and parents are unaffected, and 872 trios without neurodevelopmental conditions. Case/control status was regressed on either the child’s PGS (proband-only model), the child’s PGS and child’s RVBS (proband-only model + RVBS), all three trio members’ PGSs (trio model), or all three trio members’ PGSs and RVBSs (trio model+RVBS). We have indicated results from the latter with a red box, since they are the main focus of this figure. One asterisk indicates nominally significant results (P < 0.05) and a double asterisk indicates significant results that passed Bonferroni correction for five PGSs. Note that the ‘proband-only’ model and ‘trio’ model were also shown in Fig. 4 using additional cases and controls, rather than just GEL. The RVBS was defined as the number of rare damaging PTVs and missense variants in constrained genes (excluding de novo mutations in the child), corrected for 20 genetic principal components.

Similar articles

Cited by

References

    1. Wright, C. F. et al. Genomic diagnosis of rare pediatric disease in the United Kingdom and Ireland. N. Engl. J. Med.388, 1559–1571 (2023). - PMC - PubMed
    1. Niemi, M. E. K. et al. Common genetic variants contribute to risk of rare severe neurodevelopmental disorders. Nature562, 268–271 (2018). - PMC - PubMed
    1. Kurki, M. I. et al. Contribution of rare and common variants to intellectual disability in a sub-isolate of Northern Finland. Nat. Commun.10, 410 (2019). - PMC - PubMed
    1. Kong, A. et al. The nature of nurture: effects of parental genotypes. Science359, 424–428 (2018). - PubMed
    1. Falconer, D. S. The inheritance of liability to certain diseases, estimated from the incidence among relatives. Ann. Hum. Genet.29, 51–76 (1965).

LinkOut - more resources