. 2024 Dec;30(12):3765-3777.
doi: 10.1038/s41591-024-03354-3. Epub 2024 Nov 20.

Spatially resolved single-cell atlas unveils a distinct cellular signature of fatal lung COVID-19 in a Malawian population

Affiliations

Spatially resolved single-cell atlas unveils a distinct cellular signature of fatal lung COVID-19 in a Malawian population

James Nyirenda et al. Nat Med. 2024 Dec.

Abstract

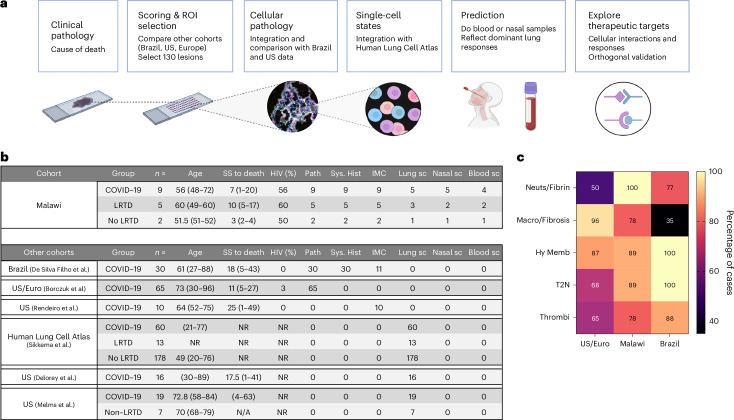
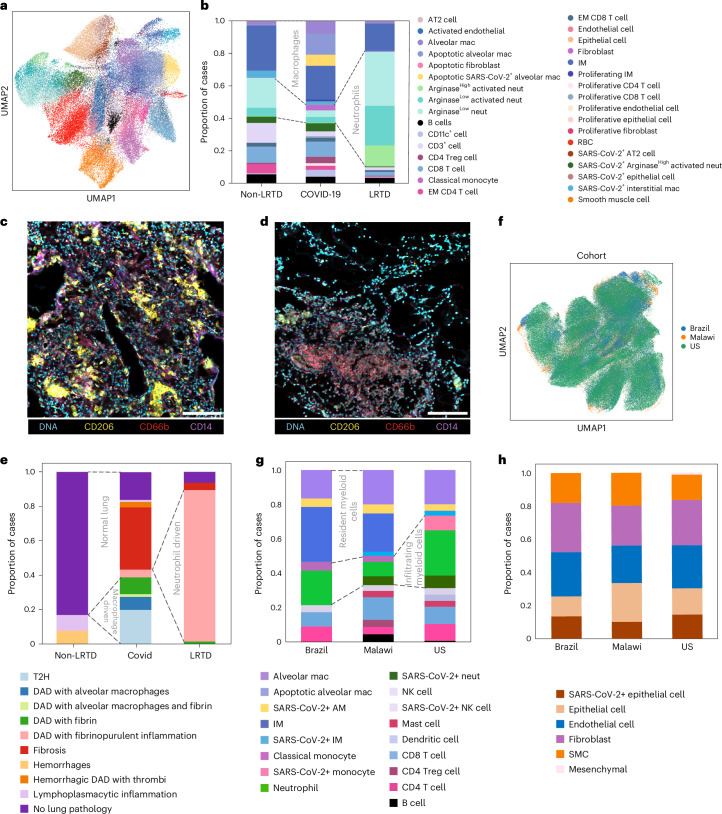
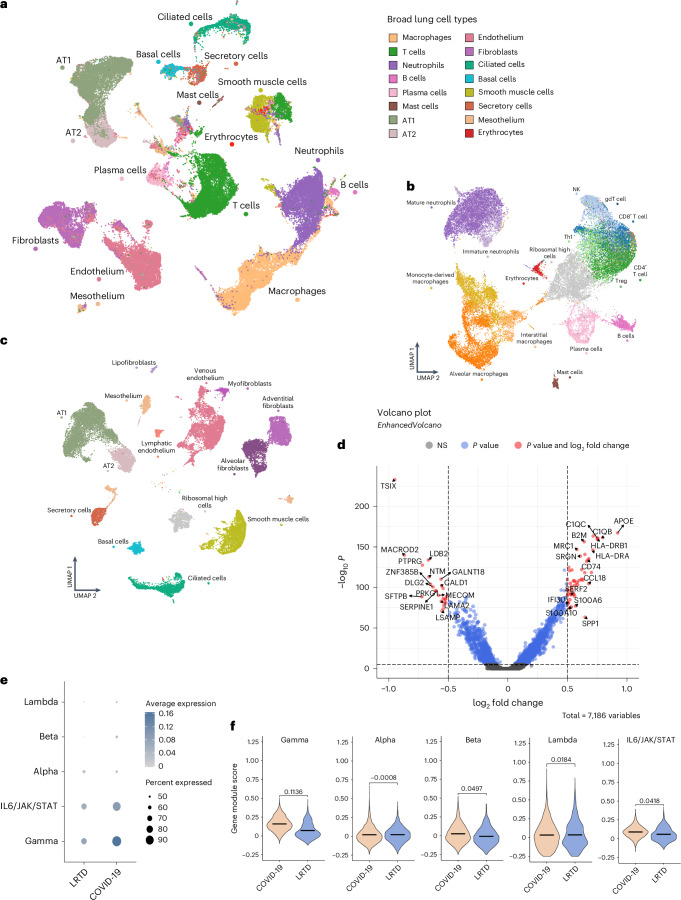
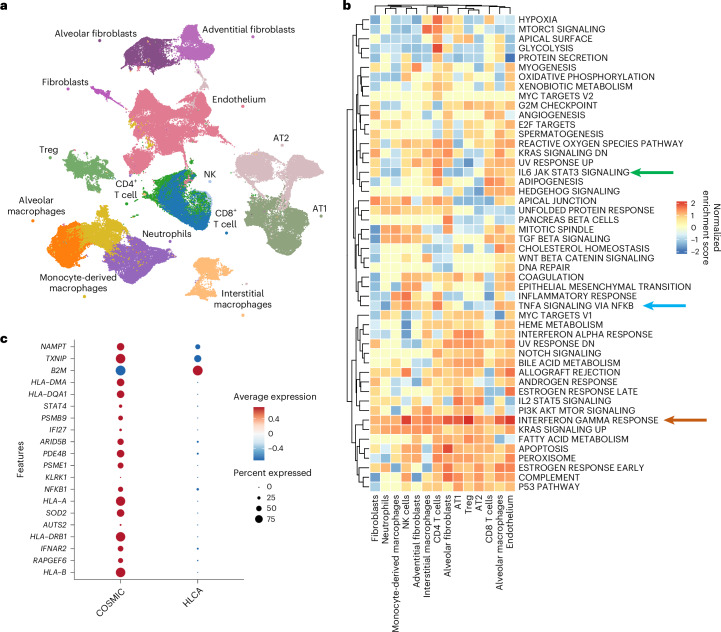
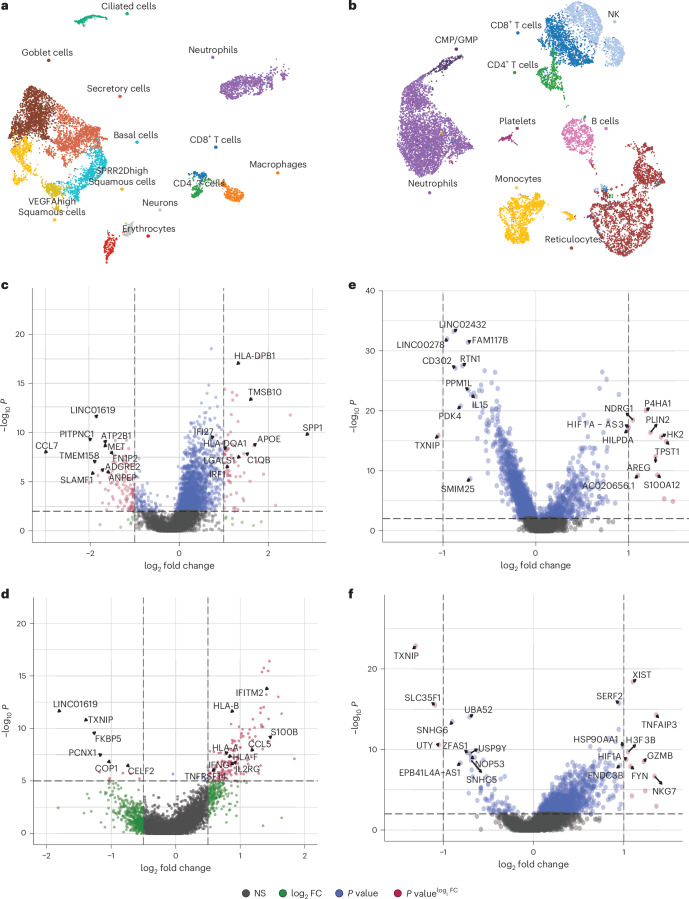
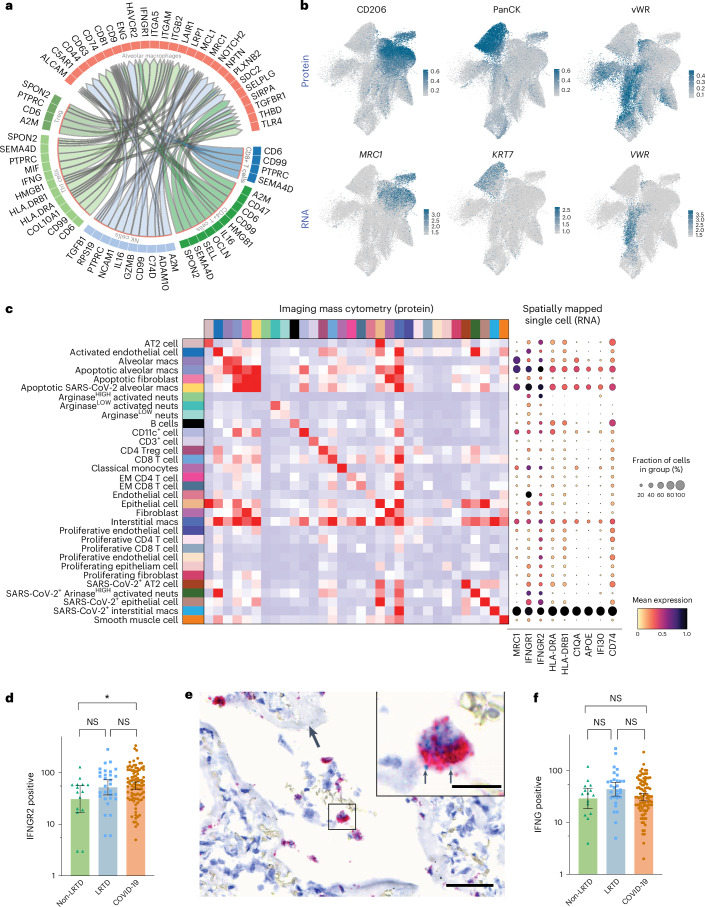
Postmortem single-cell studies have transformed understanding of lower respiratory tract diseases (LRTDs), including coronavirus disease 2019 (COVID-19), but there are minimal data from African settings where HIV, malaria and other environmental exposures may affect disease pathobiology and treatment targets. In this study, we used histology and high-dimensional imaging to characterize fatal lung disease in Malawian adults with (n = 9) and without (n = 7) COVID-19, and we generated single-cell transcriptomics data from lung, blood and nasal cells. Data integration with other cohorts showed a conserved COVID-19 histopathological signature, driven by contrasting immune and inflammatory mechanisms: in US, European and Asian cohorts, by type I/III interferon (IFN) responses, particularly in blood-derived monocytes, and in the Malawian cohort, by response to IFN-γ in lung-resident macrophages. HIV status had minimal impact on histology or immunopathology. Our study provides a data resource and highlights the importance of studying the cellular mechanisms of disease in underrepresented populations, indicating shared and distinct targets for treatment.


Conflict of interest statement

Competing interests: The authors declare no competing interests.

Figures

Fig. 1
Fig. 1. Study overview, overview of our cohort and comparator cohorts and histological lesion comparison with other cohorts.
a, Overview of study approach, created with BioRender.com. b, Summary of the characteristics of our Malawian cohort versus published cohorts that we have used for different comparisons. c, Heatmap shows the proportion of patients in the three cohorts (US/European, Malawian and Brazilian) who have each given lesion type. SS to death, symptom start to death in days; Path, pathology, denotes the number of patients included in each cohort in which postmortem pathological features are described; Sys. Hist., systematic histopathology, denotes the number of patients included in each cohort with scoring of the frequency and severity of different lesions scored based on pre-defined criteria; IMC, imaging mass cytometry, denotes the number of patients with data for this; Lung sc, lung cell single-cell RNA-seq, denotes the number of patients with scRNA-seq data from lung tissue; Nasal sc, nasal cell single-cell RNA-seq, denotes the number of patients with scRNA-seq data from nasal tissue; Blood sc, blood cell single-cell RNA-seq, denotes the number of patients with these data. Hy Memb, hyline membranes; Macro, macrophages; N/A, not applicable; NR, not recorded; Neuts, neutrophilis; T2N, type II pneumocyte hyperplasia.
Fig. 2
Fig. 2. IMC reveals an immunopathological landscape of COVID-19 in Malawian patients driven by alveolar macrophages.
a, UMAP embedding of the cell types identified in the lung samples by IMC, after supervised assignment to major cell types. Each major cell type was clustered, and resulting clusters were annotated and merged to extract the final set of cell types. Color key for cell types is on the right-hand side of b. Frequency of the immune cell types was identified in the postmortem lung samples by IMC according to clinical groups. The stacked bar plot shows the averaged frequency of the cell types by grouping the values from ROIs according to the clinical groups. Dashed lines highlight principal differences in major cell populations between COVID-19 and other respiratory disease groups. c, Representative denoised IMC images from one of 84 ROIs for patients with COVID-19 show abundant CD206high macrophages (yellow) and few neutrophils (CD66b, red) and monocytes (CD14, purple). Scale bar, 140 μm. d, Representative denoised IMC images from one of 19 ROIs for a non-COVID-19 LRTD case show abundant neutrophils (CD66b, red) and few CD206+ macrophages (yellow). Scale bar, 140 μm. e, Frequency of histopathological lesions based on matched H&E and IMC analysis of postmortem lung samples from the different clinical groups. The cellular composition and frequency of different cell types are indicated in Extended Data Fig. 3f. Dotted lines highlight the differences in proportions of broad response categories. f, UMAP embedding shows good integration (using the scvi-tools package) of IMC lung datasets from the Brazilian, US and Malawian COVID-19 cohorts based on 17 common antibody markers. g, Comparison of immune cell frequencies in IMC data from Brazilian, Malawian and US cohorts after integration shown in f; some major cell group differences are highlighted by dotted lines. Dashed box highlights apoptotic alveolar macrophages that are present only in the Malawian cohort. h, Comparison of stromal cell frequencies in IMC data from Brazilian, Malawian and US cohorts after integration shown in f. AM, alveolar macrophage; DAD, diffuse alveolar macrophage; EM, effector memory; IM, interstitial macrophage, mac, macrophage; neut, neutrophil; NK, natural killer; Treg, regulatory T; T2N, type II pneumocyte hyperplasia.
Fig. 3
Fig. 3. Lung single-cell atlas highlights IFN-γ response in alveolar macrophages.
a, UMAP visualization of 66,882 lung cells across our cohort, colored by broad cell types cluster. b, UMAP visualization of 29,217 lung immune cells reclustered at a higher resolution to characterize the immune landscape, colored by cell type. c, UMAP visualization of 37,090 stromal lung cells reclustered at a higher resolution to characterize the stromal landscape, colored by cell type. d, Volcano plot showing top DE genes in alveolar macrophages in COVID-19 compared to LRTD with a significant adjusted P value (<0.05) and a log fold change of more than 0.5 using MAST followed by Bonferroni multiple test correction. e, Dotplot showing the average gene module score of IFN response pathways across alveolar macrophages in COVID-19 and LRTD. f, Violin plots showing the gene module score across alveolar macrophages in gene sets associated with the gamma, alpha, beta, lambda and IL6 response in COVID-19 compared to LRTD. Black lines indicate the mean value across all cells, with the log fold change between means across conditions annotated above the plots. gdT cell, gamma-delta T cell; NK, natural killer; NS, not significant; Treg, regulatory T.
Fig. 4
Fig. 4. Integration with HLCA COVID-19 cohorts highlights dominant T cell macrophage IFN-γ axis in Malawian patients with COVID-19.
a, UMAP visualization of 147,935 lung cells deriving from integrating cells from patients with COVID-19, patients with LRTD and non-LRTD patients from our cohort with cells from the HLCA from COVID-19, patients with LRTD and non-LRTD patients. Clusters are colored by cell type. b, Heatmap showing pathway analysis for DE genes in our COVID-19 cohort compared to the HLCA COVID-19 cohort. Shown are the 50 canonical hallmark gene sets (for list, see Supplementary Information) colored by the normalized enrichment score for each cell type. Gene Ontology pathways of interest are indicated by arrows (IL6 JAK STAT3 SIGNALING, green; TNFA SIGNALING VIA NFKB, blue; INTERFERON GAMMA RESPONSE, orange). c, Dotplot showing the average expression of top DE genes in the lung alveolar macrophages that contribute the highest in the hallmark gene set ‘INTERFERON GAMMA RESPONSE’ pathway in our COVID-19 cohort compared to the HLCA COVID-19 cohort. NK, natural killer; Treg, regulatory T.
Fig. 5
Fig. 5. scRNA-seq of nasal and blood cells: nasal but not blood cells parallel lung IFN-γ response.
a, UMAP visualization of 8,098 nasal cells across our cohort, colored by broad cell types. b, UMAP visualization of 13,350 peripheral blood cells across our cohort, colored by broad cell types. c,d, Volcano plots showing top DE genes in nasal macrophages (c) and T cells (d) in COVID-19 compared to LRTD with a significant adjusted P value (<0.05) and a log fold change of more than 0.5. e,f, Volcano plots showing top DE genes in peripheral blood monocytes (e) and CD4+ T cells (f) in COVID-19 compared to LRTD with a significant adjusted P value (<0.05) and a log fold change of more than 0.5. FC, fold change; NK, natural killer.
Fig. 6
Fig. 6. Spatially resolved cell interaction analysis predicts molecular mechanisms of alveolar and endothelial pathology.
a, Circos plot showing the top cell–cell interactions from immune cells to alveolar macrophages in Malawian patients with COVID-19 versus Malawian patients with LRTD. Segments are colored by cell type with ligands and receptors labeled on the outside. Direction of the arrows shows the senders of communications that are expressing a given ligand to the receiver cell type expressing its cognate receptor. Inner tracks on sender segments are colored by the receiving cell type for ease of interpretation. b, UMAP plots to show expression levels of different hallmark proteins in different clusters by IMC and then below RNA levels from scRNA-seq data imputed by MaxFuse. c, Heatmaps showing co-localized cell types from IMC data, providing insight into potentially interacting cell types in the lung in patients with COVID-19; comparator LRTD and non-LRTD are in Extended Data Fig. 9. df, Quantification of mRNA in situ staining for IFNGR2 and IFNG in tissue. In total, 138 ROIs were taken based on multiple sampled areas from the left and right lung in nine patients with COVID-19, in three patients with LRTD and in two non-LRTD patients. Separate TMA sections were dual stained for either IFNGR2 and MRC1 (CD206) or IFNG and CD3E mRNA by in situ hybridization, and then the number of cells positive for each stain within respective cells of interest IFNGR2 in CD206+ cells and IFNG in CD3E+ cells was analyzed by automatic quantification. Each dot represents the quantities of positive cells in an independent tissue core that were used as replicates for analysis in d and f. These data were log transformed and analyzed using one-way ANOVA and Tukey’s multiple comparison test to adjust for multiple comparisons and a pre-defined alpha level of 0.05. Colored bars show the geometric mean, and error bars show the 95% confidence interval. d, Compared to non-LRTD patients, there were significantly higher numbers of IFNGR2+ cells in patients with COVID-19 but not in patients with LRTD (*P = 0.0441). e, Co-staining of IFNγR2 (red) and CD206 gene (green) using mRNA probes in lungs of patients infected with SARS-CoV-2. Lung of patients with COVID-19 shows, in the periphery of the damaged alveolar space fibrin (empty arrows) and in the lumen of the alveoli, cells with macrophage morphology expressing IFNGR2 (red signal, rectangle). The insert shows a higher magnification of the rectangle with a macrophage expressing CD206 in green (black arrows) and abundant IFNGR2 in red. Scale bars, 60 µm and 15 µm, respectively. Hematoxylin counterstaining. f, No significant difference was observed in quantities of IFNG+ cells among the different groups (NS, not significant; P = 0.111). EM, effector memory; macs, macrophages; neuts, neutrophils; Treg, regulatory T.
Extended Data Fig. 1
Extended Data Fig. 1. The histopathology of fatal Covid19 versus fatal non-Covid19 LRTD and non-LRTD in Malawian cases.
Histopathology in the left and right lungs of the 16 cases was scored systematically using pre-defined criteria by two pathologists who were blinded to clinical information. We used identical scoring to a Brazil cohort that we have published on separately. A – C are violin plots of the distribution of scores to highlight comparisons between different group, central thick bars highlight the median and outer bars the interquartile range. In all three graphs a two-sided unpaired t-test was used to compare lesion frequencies with no correction for multiple comparisons * denotes p < 0.05 with specific p values given below. (a) Comparison of histological features between COVID-19 (n = 9) and non-COVID-19 fatal lower respiratory tract disease (LRTD) cases (n = 5). p values for significant individual comparisons: syncytia p = 0.008; type II hyperplasia p = 0.016; vascular congestion p = 0.031; lymphocytes p = 0.0032; granulation p = 0.034. (b) Comparison of histological features between HIV + COVID-19 cases (n = 5) and HIV- COVID-19 cases (n = 4). No comparisons had a p < 0.05 (c) Comparison of COVID-19 cases from Malawi cohort (n = 9) with cases from Brazil cohort (n = 20). p values for significant individual comparisons; vascular congestion, alveolar oedema DAD p = <0.00001; Alveolar thickening p = 0.0004; haemorrhage p = 0.0008; type II hyperplasia p = 0.0013; alveolar emphysema p = 0.0015; syncytia p = 0.0039. (d) PCA of cases split by groups. (e) UMAP of same data, including HIV status.
Extended Data Fig. 2
Extended Data Fig. 2. Cell atlas and phenotype of cell types identified in the post-mortem lung tissue determined by Imaging Mass Cytometry (IMC).
a) Phenotype representation of each cell type identified in the lung samples. The heatmap shows the mean expression of each protein marker in the IMC panel in each cell type identified in the post-mortem lung tissue. (b) Frequency of the immune cell types identified in the post-mortem lung samples by IMC according to clinical groups and according to HIV status within the COVID-19 group. (c) Frequency of the stromal cell types identified in the post-mortem lung samples by IMC according to clinical groups and according to HIV status within the COVID-19 group. (d) Frequency and absolute numbers of SARS-CoV-2 Ag+ cells in the myeloid and epithelial compartments, determined by IMC, in the post-mortem lung samples according to HIV status within the COVID-19 group. (e) Cell type enrichment analysis of the cell populations identified in Malawi lung IMC data. The comparison shown is between COVID-19 versus LRTD cases. To correct for multiple testing, the spatial false discovery rate (FDR) was calculated and only dots with spatial FDR < 0.05 are shown. (f) Cellular landscape of histopathological lesions based on matched H&E and IMC analysis of post-mortem lung samples from the different clinical groups. The lesions were pooled, and the graph shows the average proportion of each cell type in each lesion type.
Extended Data Fig. 3
Extended Data Fig. 3. Effect of disease stage and viral variant on lung immune composition.
(a,b) Immune cell proportions from lung imaging mass cytometry data in: (a) the Malawi cohort versus Brazil and USA early death (ED; that is cases who died within two weeks of illness onset) and late death (LD; that is cases who died after 2 weeks of illness). When compared with Malawi cases, USA early death (ED) have an even higher proportion of neutrophils and a lower proportion of macrophages than late death (LD). (b) Lung proportions in Brazil and USA cohorts who had the ancestral variant compared with Malawi cases with Beta and Malawi cases with Delta variant. The low proportion of neutrophils and high proportion of CD206high macrophages in the Malawi cases are present regardless of variant. (c, d) Principal component analysis of of IMC lung immune cell composition data where cases are coloured by geographical location of the cohort (Malawi, Brazil, USA) and either: (c) disease stage (early versus late death) or (d) viral variant. Each dot is a separate lung sample from a different lung region from tissue microarrays (Malawi and USA) or lung blocks (Brazil). Coloured oval areas indicate where the majority of samples from each group cluster drawn by visual estimation using the same colours as those for the dots as indicated in the legend. For both graphs samples cluster principally by geographical location of the cohort and not by disease stage or viral variant.
Extended Data Fig. 4
Extended Data Fig. 4. Lung cell proportions and gene module scores.
(a-b) Cell type proportion bar plots of lung cell types in (a) Immune cells and (b) Stromal cells corresponding with Fig. 3b and c, grouped by disease group. (c) Violin plot to show a comparison between COVID-19 and LRTD cases of expression of IFNG (the IFN-γ gene) in a pseudo bulk analysis of lung scRNA-seq including all T-cells. (d) Plot shows expression levels of different IFNG module genes in lung alveolar macrophages between COVID-19 and LRTD cases. Line is at 1:1 ratio, hence dots to the left of the line indicate genes with higher expression in COVID-19 cases and to the right of the line indicates genes with higher expression in LRTD. Dots for genes for the IFN-γ receptors IFNGR1 and IFNGR2 and for IFNG (the IFN-γ gene) are indicated. (e) Heatmap showing the mean gene module score across cells in gene sets associated with the alpha, beta, gamma, lambda and TNF response. Cell types have been grouped by COVID-19 and LRTD to show the difference in response and module score values have been scaled between −1 and 1.
Extended Data Fig. 5
Extended Data Fig. 5. Heatmap of interferon response genes in lung.
(a) Heatmaps showing the log fold change of up/down-regulated interferon response genes taken from immunologic gene sets involved in the immune response. Comparisons include the change in interferon response in cells from the HLCA COVID-19 cohort compared to HLCA control cases (left), the Malawi COVID-19 cohort compared to control cases from the HLCA (middle) and interferon responses from our COVID-19 cohort compared to the HLCA COVID-19 cohort (right). (b) Violin plots of IFN and IL6 response modules in lung tissue macrophages in USA cases (from Delorey et al) comparing early death cases that died within 2 weeks of illness onset (early) and late death cases that died after two weeks of illness (late). All p-values were calculated using a two-sample Wilcoxon test with Bonferroni multiple test correction (Alpha p < 2.2e-16 ****, Beta p < 2.2e-16 ****, Gamma p = 0.7141 ns, Lambda p = 0.09 **, IL6 p = 0.8939 ns).
Extended Data Fig. 6
Extended Data Fig. 6. Predicted cell-cell interactions in the IMC datasets.
Heatmaps for the non-LRTD group (a) and LRTD (b) showing co-localised cell types as shown by the IMC providing insight into potentially interacting cell types in the lung, shown for comparison with the same data from COVID-19 cases Fig. 6b (main figures).
Extended Data Fig. 7
Extended Data Fig. 7. Visualisation of cell-cell interactions in the IMC datasets.
Cellular maps showing the spatial location of specific immune cells – highlighting spatially enriched macrophage and neutrophil interactions identified in Fig. 6b (main figures). (a) shows interactions between alveolar macrophages (purple), apoptotic alveolar macrophages (blue) and apoptotic alveolar macrophages (yellow). (b) shows interactions between apoptotic alveolar macrophages (yellow) fibroblast (lilach) and SARSCoV2+ Epithelial cells (purple) (c) shows interactions between activated endothelial cells (blude) and SARSCoV2+ Neutrophils (green).
Extended Data Fig. 8
Extended Data Fig. 8. Dual in situ staining for CD206 and IFNGR2 (inducible IFN-γ receptor) and CD3 and IFNG (IFN-γ gene) for validation of IFN-γ response.
138 regions of interest were taken based on multiple sampled areas from the left and right lung in: 9 COVID-19 cases in 3 LRTD cases and 2 non-LRTD cases a) Shows adjacent sections of cores from a COVID-19 (Cos009) case to demonstrate concordance of CD206 RNA and protein staining. The left has had in situ staining (MRC1/CD206 in red and IFNGR2 in green) and the right image shows immunohistochemistry using an anti-CD206 antibody (staining in brown), bar 300μm. b) In situ staining for CD206 and IFNGR2 in LRTD case (Cos004); few cells are present with co-staining of IFNGR2 (green, arrow) and CD206 (red, empty arrow), bar 30μm. c) In situ staining for CD206 and IFNGR2 for non-LRTD case (Cos 016) only single positive cells are detected in general expressing IFNGR2 (green, arrow) as well as CD206, bar 30μm. d) In situ staining for IFNG and CD3 in a LRTD case (Cos003), CD3 red signal arrows, no green signal for IFNG has been detected, bar 60μm. e) LRTD case (Cos011), CD3, red signal, single positive cells, no co-staining with IFNG, arrows, bar 30μm. f) Non-LRTD cases (Cos016), CD3 in red, black pigment is interpreted as anthracosis, bar 30μm.
Extended Data Fig. 9
Extended Data Fig. 9. Predicted receptor ligand interactions in single cell data.
a) Heatmap showing up/down-regulated interactions in COVID-19 compared to LRTD driven by AT2 pneumonocytes to alveolar macrophages. Coloured boxes indicate cell type with the ligand-expressing cell type followed by the receptor-expressing cell type. b) Heatmap showing up/down-regulated interactions in COVID-19 compared to LRTD driven by lung alveolar macrophages to lung epithelial cells and interstitial macrophages. Coloured boxes indicate cell type with the ligand-expressing cell type followed by the receptor-expressing cell type. c) Heatmap showing up/down-regulated interactions in COVID-19 compared to LRTD driven by lung endothelium to neutrophils. Coloured boxes indicate cell type with the ligand-expressing cell type followed by the receptor-expressing cell type. d) Heatmap showing up/down-regulated interactions in COVID-19 compared to LRTD driven by neutrophils to lung endothelium. Coloured boxes indicate cell type with the ligand-expressing cell type followed by the receptor-expressing cell type.

References

    1. Regev, A. et al. The Human Cell Atlas. eLife6, e27041 (2017). - PMC - PubMed
    1. Lindeboom, R. G. H., Regev, A. & Teichmann, S. A. Towards a Human Cell Atlas: taking notes from the past. Trends Genet.37, 625–630 (2021). - PubMed
    1. Rood, J. E., Maartens, A., Hupalowska, A., Teichmann, S. A. & Regev, A. Impact of the Human Cell Atlas on medicine. Nat. Med.28, 2486–2496 (2022). - PubMed
    1. Majumder, P. P., Mhlanga, M. M. & Shalek, A. K. The Human Cell Atlas and equity: lessons learned. Nat. Med.26, 1509–1511 (2020). - PubMed
    1. Divangahi, M. et al. Trained immunity, tolerance, priming and differentiation: distinct immunological processes. Nat. Immunol.22, 2–6 (2021). - PMC - PubMed

Substances

LinkOut - more resources