. 2025 Apr;32(4):587-597.
doi: 10.1038/s41418-024-01415-1. Epub 2024 Nov 20.

Polyol pathway-generated fructose is indispensable for growth and survival of non-small cell lung cancer

Affiliations

Polyol pathway-generated fructose is indispensable for growth and survival of non-small cell lung cancer

Annemarie Schwab et al. Cell Death Differ. 2025 Apr.

Abstract

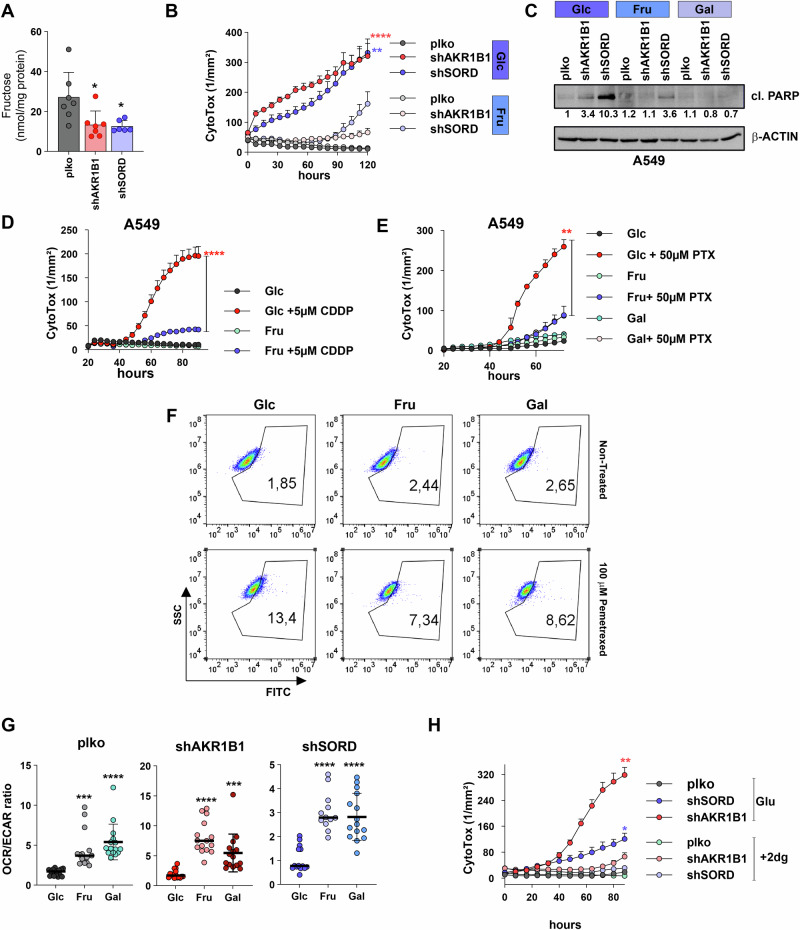
Despite recent treatment advances, non-small cell lung cancer (NSCLC) remains one of the leading causes of cancer-related deaths worldwide, and therefore it necessitates the exploration of new therapy options. One commonly shared feature of malignant cells is their ability to hijack metabolic pathways to confer survival or proliferation. In this study, we highlight the importance of the polyol pathway (PP) in NSCLC metabolism. This pathway is solely responsible for metabolizing glucose to fructose based on the enzymatic activity of aldose reductase (AKR1B1) and sorbitol dehydrogenase (SORD). Via genetic and pharmacological manipulations, we reveal that PP activity is indispensable for NSCLC growth and survival in vitro and in murine xenograft models. Mechanistically, PP deficiency provokes multifactorial deficits, ranging from energetic breakdown and DNA damage, that ultimately trigger the induction of apoptosis. At the molecular level, this process is driven by pro-apoptotic JNK signaling and concomitant upregulation of the transcription factors c-Jun and ATF3. Moreover, we show that fructose, the PP end-product, as well as other non-glycolytic hexoses confer survival to cancer cells and resistance against chemotherapy via sustained NF-κB activity as well as an oxidative switch in metabolism. Given the detrimental consequence of PP gene targeting on growth and survival, we propose PP pathway interference as a viable therapeutic approach against NSCLC.


Conflict of interest statement

Competing interests: OS is the co-founder and manager of OncoCube Therapeutics LLC, founder, and president of LoxiGen, and the member of scientific advisory board of A2A Pharmaceuticals Inc. The other authors declare no conflict of interests.

Figures

Fig. 1
Fig. 1. Knockdown of AKR1B1 results in growth arrest in vitro.
A Representative images of AKR1B1 and SORD immunohistochemistry staining of NSCLC patient tissue samples (n = 89). The scale bar represents 100 µm. B Proportion of AKR1B1-, SORD- single or double positive in human NSCLC specimens. C Western blot of AKR1B1 and SORD in a panel of established NSCLC cell lines. D Western blot of AKR1B1 in A549, H1299 and Calu-1 scrambled plko (control) cells and AKR1B1 knockdown cells transduced with three independent shRNA sequences. E Fractional enrichment of fructose in A549 plko cells, H1299 plko and shAKR1B1 cells upon [U-13C6]-Glucose tracing. P-values indicate significant differences among M + 6 isotopologues. F Real-time proliferation of plko control and three different shAKR1B1 knockdown in A549 (ADC), H1299 (LCC) and Calu-1 (SCC) cells. Proliferation of H2B-RFP positive cells was determined via quantification of fluorescent nuclei counts over time by the real-time imaging system Incucyte. G Cytotoxic effect of shAKR1B1 in A549 cells compared to plko control cells as quantified by the fluorescence of a green CytoTox dye in dead cells. Representative images with green-fluorescent signals depict the occurrence of cell death upon AKR1B1 knockdown. Scale bar is 150 µm. H Western blot of γH2AX in plko and three shAKR1B1 A549 cells. I Caspase 3/7-dependent apoptosis assay measuring activated caspase 3/7 in plko control and shAKR1B1 A549 cells measured by real-time imaging. Statistical tests are two-way ANOVA, Dunnett’s method except for (E) where it is T-test.
Fig. 2
Fig. 2. Genetic ablation of AKR1B1 attenuates the in vivo growth of NSCLC tumors.
A Tumor growth curve showing tumor volume from NSG mice subcutaneously injected with either A549 plko control or shAKR1B1 cells as determined by caliper measurement, (B) weight of the excised A549 tumors and (C) representative image of tumors. D Tumor growth curve showing tumor volume from NSG mice subcutaneously injected with either H1299 plko control or shAKR1B1 cell as determined by caliper measurement, (E) weight of excited H1299 tumors and (F) representative images of tumors. GI Tumor growth curve showing tumor volume of A549 subcutaneous xenografts treated with either epalrestat (EPR) or drug vehicle, along with the weights of the tumors and representative images. Tumor growth was analyzed using multiple t-tests (Holm–Sidak method) and comparison of tumor weights at endpoint was done using unpaired Student t-test.
Fig. 3
Fig. 3. Knockdown of SORD phenocopies the growth inhibitory effect of AKR1B1 knockdown.
A Real-time proliferation of plko and shSORD A549 cells, along with a Western blot of SORD and the DNA damage marker γH2AX, and measurement of caspase 3/7-mediated apoptosis and shSORD-induced cytotoxicity by real-time imaging. shSORD cells were generated using three independent shRNA sequences. B Percentage of ROS-positive A549 plko, shAKR1B1 and shSORD cells using CM-H2DCFDA as a general oxidative stress indicator. C Cytotoxicity assay in A549 plko control, AKR1B1 and SORD knockdown cells either in the absence or presence of 5 mM NAC. D Basal glycolytic activity of A549 plko, shAKR1B1 and shSORD cells as measured by the extracellular acidification rate (ECAR) upon glucose infusion during a glycolytic stress test (GST). E ATP-linked respiratory capacities of A549 plko, shAKR1B1 and shSORD cells as measured by the oxygen consumption rates (OCR) during a mitochondrial stress test. Statistical test in (A) and (C) is two-way ANOVA, Dunnett’s method and in (B, D, E) is one-way ANOVA, Dunnett’s method.
Fig. 4
Fig. 4. Fructose rescues cell death in polyol pathway-deficient NSCLC cells in the absence or presence of chemotherapy.
A Mass spectrometric quantification of intracellular levels of fructose in plko and shPP A549 cells. Supplementary Fig. 3A shows glucose and fructose peak chromatographic resolution. B Cytotoxicity assay upon PP knockdown in A549 cells grown in glucose-free DMEM supplemented with either 5 mM glucose or fructose. C Western blot of cleaved PARP (cl.PARP) in plko control or PP knockdown A549 cells grown in 5 mM glucose, fructose or galactose. D Cytotoxicity assay upon treatment with 5 µM Cisplatin (CDDP) in A549 cells grown in glucose or fructose. E Cytotoxicity assay upon treatment with 50 µM Pemetrexed (PTX) in A549 cells grown in glucose, fructose or galactose (5 mM each). F ROS levels, indicated as the percentage of ROS+ population in A549 cells treated with PTX in combination with glucose, fructose or galactose supplementation as measured by flow cytometry. G OCR/ECAR ratio of A549 plko control and shPP cells grown in glucose, fructose or galactose as quantified by Seahorse Assay. The individual OCR and ECAR plots are shown in Supplementary Fig. 3G. H Cytotoxicity assay upon either treatment with sublethal doses of 2-DG (200 µM) or supplementation with glucose in A549 plko control and shPP cells. Statistical test in (A, G) is unpaired T-test and in (B, D, E, H) is two-way ANOVA and Tukey’s post-test for multiple comparisons.
Fig. 5
Fig. 5. Anti-apoptotic properties are associated with fructose metabolism in NSCLC cells.
A Gene Set Enrichment Analysis showing upregulated pathways in AKR1B1 knockdown cells as compared to plko control cells under glucose supplementation. B Western blot of ATF3 in A549 plko control and shAKR1B1 cells grown in glucose, fructose or galactose (5 mM each). C Western blot of ATF3, c-JUN, p53 and phospho-JNK in A549 plko control and shPP cells grown in glucose, fructose or galactose. D Western blot of total and activated phosphorylated p65 (p-p65) in A549 plko control and shPP cells. E NF-κB activity luciferase reporter assay in A549 plko control and shAKR1B1 cells grown in glucose, fructose or galactose. F NF-κB activity luciferase reporter assay in A549 plko control and shSORD cells grown in glucose, fructose or galactose. G Cell viability assay in A549 cells grown in glucose, fructose or galactose upon treatment with increasing concentrations of NF-κB inhibitors R7050 (top) or SM7368 (bottom). Inhibition response curves were plotted by determining the confluency of control and treated group after 40 h of treatment, normalized to controls, set at 1, and subsequent log transformation of drug concentrations. H A schematic representation of the potential role of the polyol pathway in cancer cell survival. The model suggests that deficit of fructose due to disruption of the polyol pathway (PP) triggers a metabolic stress that leads to activation of the JNK/c-Jun pathway and ATF3 resulting in activation of the pro-apoptotic AP-1 complex in parallel with a potential activation of p53. Statistical test in (F) is unpaired t-test and Dunnett’s method for multiple comparisons.

References

    1. Hanahan D. Hallmarks of cancer: new dimensions. Cancer Discov. 2022;12:31–46. - PubMed
    1. Ramesh V, Brabletz T, Ceppi P. Targeting EMT in cancer with repurposed metabolic inhibitors. Trends Cancer. 2020;6:942–50. - PubMed
    1. Thiery JP, Acloque H, Huang RYJ, Nieto MA. Epithelial-mesenchymal transitions in development and disease. Cell. 2009;139:871–90. - PubMed
    1. Schwab A, Siddiqui A, Vazakidou ME, Napoli F, Böttcher M, Menchicchi B, et al. Polyol pathway links glucose metabolism to the aggressiveness of cancer cells. Cancer Res. 2018;78:1604–18. - PubMed
    1. Hers HG. The mechanism of the transformation of glucose in fructose in the seminal vesicles. Biochim Biophys Acta. 1956;22:202–3. - PubMed