. 2024 Dec;56(12):2731-2738.
doi: 10.1038/s41588-024-01993-3. Epub 2024 Nov 20.

Consensus prediction of cell type labels in single-cell data with popV

Affiliations

Consensus prediction of cell type labels in single-cell data with popV

Can Ergen et al. Nat Genet. 2024 Dec.

Abstract

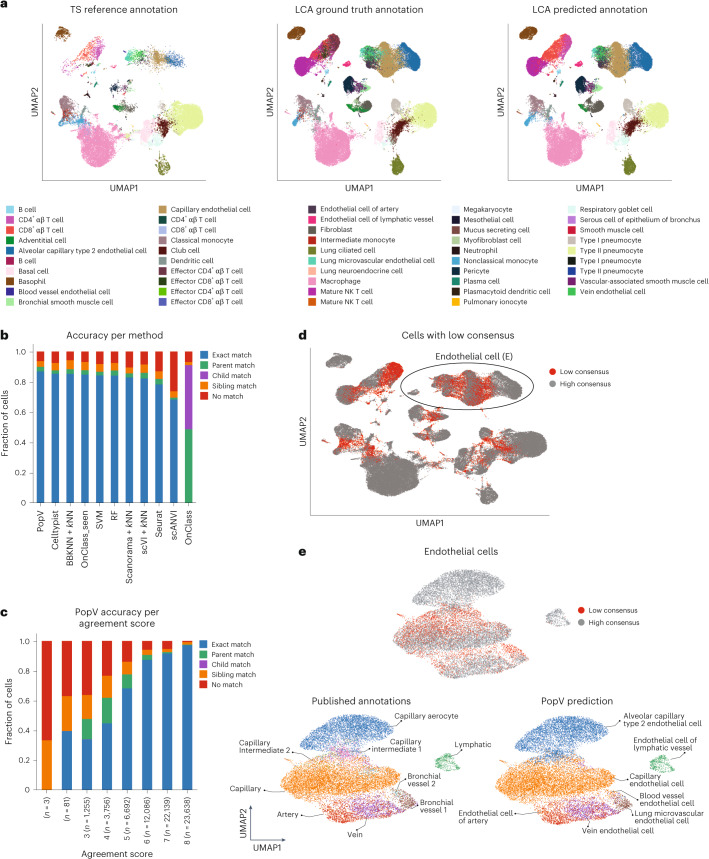
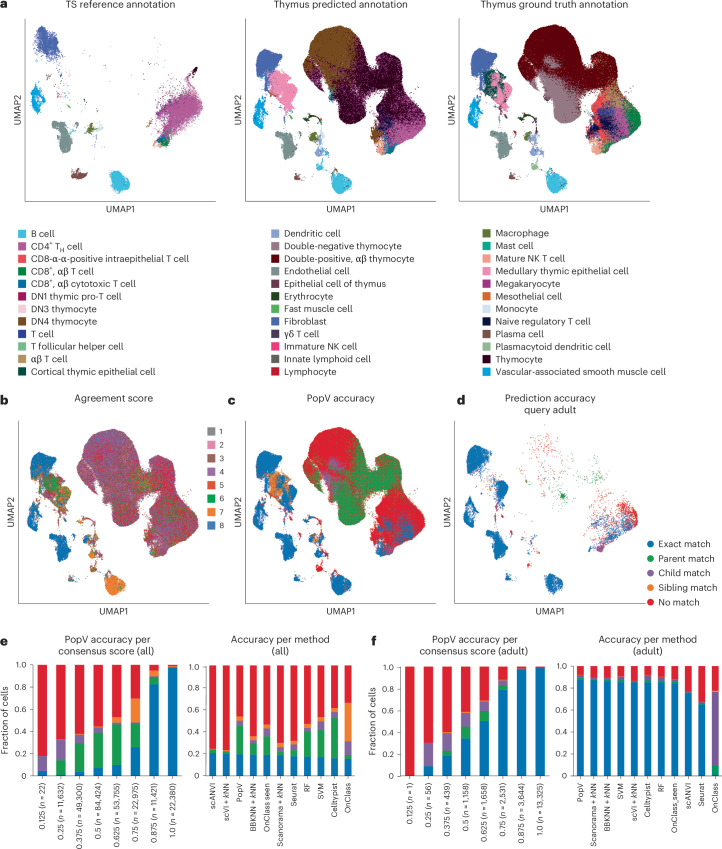
Cell-type classification is a crucial step in single-cell sequencing analysis. Various methods have been proposed for transferring a cell-type label from an annotated reference atlas to unannotated query datasets. Existing methods for transferring cell-type labels lack proper uncertainty estimation for the resulting annotations, limiting interpretability and usefulness. To address this, we propose popular Vote (popV), an ensemble of prediction models with an ontology-based voting scheme. PopV achieves accurate cell-type labeling and provides uncertainty scores. In multiple case studies, popV confidently annotates the majority of cells while highlighting cell populations that are challenging to annotate by label transfer. This additional step helps to reduce the load of manual inspection, which is often a necessary component of the annotation process, and enables one to focus on the most problematic parts of the annotation, streamlining the overall annotation process.


Conflict of interest statement

Competing interests: The authors declare no competing interests.

Figures

Fig. 1
Fig. 1. Framework of popV for automatic cell type annotation.
PopV takes an unannotated query dataset and an annotated reference dataset as input. Each expert algorithm predicts the label on the query dataset to yield a cell-type annotation. The certainty of the respective label transfer can be quantified by scoring the agreement of those methods. The workflow yields a sample report to provide the user with insights into the annotated labels.
Fig. 2
Fig. 2. PopV prediction on LCA and TS lung as reference is accurate and interpretable.
a, UMAP embedding after scANVI integration of TS reference cells, LCA query cells labeled with the ground-truth label and LCA query cells labeled with predicted label. b, Ontology accuracy (Methods) for the various methods computed on the query cells. c, Ontology accuracy for the prediction scores in popV. d, Highlighted cells with a consensus score of 4 or less (low consensus). e, Zoomed-in view of endothelial cells in the LCA with popV-predicted labels and ground-truth labels displayed. The zoomed-in picture is rotated by 90° to allow readability of all labels. Alveolar capillary type 2 endothelial cell is the Cell Ontology term for capillary aerocytes. The LCA annotated additional cell types between capillary aerocytes and capillary endothelial cells. TS, Tabula Sapiens; LCA, Lung Cell Atlas.
Fig. 3
Fig. 3. PopV identifies thymocytes as query-specific cell types and yields highly interpretable consensus scores.
a, UMAP embedding after scANVI integration of reference cells (TS) and query cells (thymus cells across different age groups) labeled by popV prediction and original annotation. b, PopV prediction score overlaid on the UMAP plot. The prediction score is low for thymocytes and higher for most other cell types. c, The prediction accuracy of the popV prediction highlights the low accuracy in developing thymocytes. d, The prediction accuracy of the popV prediction in adult thymus cells in the query shows high accuracy except for CD8 T cells. e, Left, PopV accuracy and consensus score are well correlated in all thymus cells with high accuracy for predictions with a consensus score of 7 and 8. Right, All methods show a low accuracy on fetal cells. f, Left, PopV accuracy and consensus score are also well correlated when subsetting to cells from adult donors. Right, PopV shows the highest accuracy when subsetting to adult cells; most methods show similarly high accuracy.
Extended Data Fig. 1
Extended Data Fig. 1. Comparison of majority voting and popV prediction score.
A single cell is annotated by eight different algorithms. OnClass uses a two-step annotation procedure, in which the second can predict cell types that are not part of the reference dataset (here CD4+ CD25+ Treg cell). For simple majority voting, we use the prediction of OnClass at step 1, where it is bound to the cell types observed in the reference dataset (OnClass_seen) and count the predictions of each algorithm. For popV scoring, we propagate the prediction of OnClass along the Cell Ontology graph (shortest path to the root node). Every cell along the path from the root term to the predicted term receives a score of 1, and majority voting is performed for these propagated votes. In the case here, using majority voting, we would classify the cell as a CD8+ T cell with a score of 4, while using the popV consensus score, we would classify the cell as a CD4+ T cell with a score of 4.
Extended Data Fig. 2
Extended Data Fig. 2. scANVI shows the highest integration of query cells, and popV shows low confidence for lowly abundant cell types.
a, ScIB metrics comparing integration scores after integrating query and reference dataset showed the best integration using scANVI and improvement over uncorrected data. Labels from the original Lung Cell Atlas paper were used to compute cell type-dependent scores, and scores were computed only on query cells. b, Displayed is the number of each predicted cell type in query cells and the accuracy for each annotated cell type. c, Absolute accuracy corresponds to exact match, while neighbor-only accuracy corresponds to all adjacent cell types (all accuracy terms except no match). Cells that were rarely predicted (smooth muscle cells and blood vessel endothelial cells showed the lowest accuracy). Most cell types have an accuracy greater than 0.9.
Extended Data Fig. 3
Extended Data Fig. 3. Analysis of T cell sub-clustering in Lung Cell Atlas and Tabula Sapiens.
a, UMAP of cells from the reference dataset labeled with Tabula Sapiens cell type labels highlights the overlap of these labels in integrated space without a clear distinction between CD4 and CD8 T cells. Differential expression analysis identifies surfactant protein genes as markers for annotated effector T cells, which is likely due to ambient counts and no strong marker gene expression in CD4 T cells. b, UMAP of cells from the query dataset labeled with cell type labels from the Lung Cell Atlas shows a clear distinction between different cell types. Differentially expressed genes for those cell types align well with the respective literature. c, Canonical marker genes for various subtypes show a clear split between T cells and NK cells, as well as CD8 and CD4 T cells. GZMA but not GZMB is also expressed in CD4 T cells.
Extended Data Fig. 4
Extended Data Fig. 4. Comparison of popV against majority voting of multiple SVM classifiers.
All plots are displayed for query cells of the lung cell query dataset. We compare popV against majority voting after SVM, for which different kernels (radial basis function, polynomial, linear and sigmoid) and the cost were varied (0.1 and 1.0). a, UMAP-highlighting cells with a consensus score of 4 or less (low consensus). We compare popV here with the majority vote of eight distinct SVM classifiers, which differ in their choice of the kernel and c parameters. b, Accuracy versus consensus score (left) and majority voting score (right) for both consensus algorithms colored by ontology accuracy terms (Methods). c, Hamming distance between the underlying classifiers of popV and SVM majority voting. d, Precision–recall curves for both algorithms. We used all exact match as the label for the metric calculation. In the legend, area under the precision–recall curve is given (AUPRC). In addition, the F1 score at best decision boundary is given, along with the confidence level at the decision boundary as well as the ratio of cells annotated above this threshold. popV shows the higher AUPRC and F1 scores at the decision boundary. e, Focus on T cells and NK cells (circle in a). UMAP of the consensus voting as well as underlying classifiers. Top, PopV classifiers are displayed. The main disagreement is between CD8 and CD4 T cells. Middle, Majority voting after SVM shows disagreement between NK and CD8+ T cells. Bottom right, Original annotation of query cells shows agreement for NK cells and no clear separation between different T cell labels.
Extended Data Fig. 5
Extended Data Fig. 5. Calibration of certainty and accuracy for all methods evaluated on all query cells from the thymus.
Displayed is the accuracy for bins of internal classification certainty. X-axis labels highlight the number of cells in each bin. PopV, OnClass_seen and random forest show the strongest correlation between exact match and certainty. PopV shows the highest number of high-confidence predictions. Several methods show a high number of incorrect results for predictions with confidence above >87.5%. The coloring of the bars is calculated for the prediction of the respective algorithm, standardized to a height of one per confidence level.
Extended Data Fig. 6
Extended Data Fig. 6. Precision–recall curves for all classifiers evaluated on all query cells from the thymus.
Precision–recall curves are evaluated for all query cells. We used all exact match as the label for the metric calculation. In the legend, area under the precision–recall curve is given (AUPRC). F1 score at best decision boundary is given, along with the confidence level at the decision boundary as well as the ratio of cells annotated above this threshold. PopV shows the highest AUPRC and F1 score at the decision boundary. The decision boundary corresponds to a consensus score of 7 and above.
Extended Data Fig. 7
Extended Data Fig. 7. Predictions of cell-type labels across different technologies.
Confusion matrix of cell-type labels for (a) nucleus as well as (b) Drop-seq query cells using cells sequenced with 10× from Fig. 2 as the reference dataset. Matrix is column normalized on the respective y-axis; the predicted label from popV is given, and on the x-axis, the original label is provided. Displayed is the ratio of predicted cell types with popV for each ground truth cell type.
Extended Data Fig. 8
Extended Data Fig. 8. PopV accurately performs labeling of cell types across different brain regions and highlights region-specific neurons.
a, UMAP embedding after scANVI integration of reference nuclei (motor cortex, M1G) and query nuclei (medial temporal gyrus, MTG) labeled with consensus score, brain region (ROI), popV prediction and original annotation (supercluster term). b, Confusion matrix for the cell types predicted by popV and their respective manual annotations highlights the agreement between both annotations. Displayed is the ratio of predicted cell types with popV for each ground truth cell type. c, Mean agreement score per cell type shows that confused cell types also exhibit a lower agreement score and can be detected based on their score. d, Differentially expressed genes for cluster ID for upper-layer intratelencephalic neurons. Highlighted are cluster IDs 135 and 138, which are over-represented in the MTG over the M1G. These clusters show an overexpression of FOXP2 and TSHZ2 and are very similar to each other.
Extended Data Fig. 9
Extended Data Fig. 9. Precision–recall curves for popV prediction when removing classifiers from voting scheme.
We evaluated the performance of popV when disabling a subset of algorithms. We removed OnClass from the algorithms so that majority voting and popV consensus scoring yield the same result. We evaluated the performance of popV using a subset of 5 algorithms each. On the respective y- and x-axes, the two algorithms removed from popV for the respective trial are displayed. The difference between the accuracy or auPRC between the original prediction and the prediction after subsetting the algorithm is displayed. Each metric obtained when using all algorithms in popV is given in the plot title. a and b denote the thymus experiment (Fig. 3) evaluated on all query cells. c and d correspond to the nucleus dataset (Extended Data Fig. 7).

References

    1. Luecken, M. D. & Theis, F. J. Current best practices in single-cell RNA-seq analysis: a tutorial. Mol. Syst. Biol.15, e8746 (2019). - PMC - PubMed
    1. Lähnemann, D. et al. Eleven grand challenges in single-cell data science. Genome Biol.21, 31 (2020). - PMC - PubMed
    1. Wagner, A., Regev, A. & Yosef, N. Revealing the vectors of cellular identity with single-cell genomics. Nat. Biotechnol.34, 1145–1160 (2016). - PMC - PubMed
    1. Pasquini, G., Rojo Arias, J. E., Schäfer, P. & Busskamp, V. Automated methods for cell type annotation on scRNA-seq data. Comput. Struct. Biotechnol. J.19, 961–969 (2021). - PMC - PubMed
    1. Clarke, Z. A. et al. Tutorial: guidelines for annotating single-cell transcriptomic maps using automated and manual methods. Nat. Protoc.16, 2749–2764 (2021). - PubMed