. 2024 Dec;56(12):2753-2762.
doi: 10.1038/s41588-024-01988-0. Epub 2024 Nov 20.

Luminal breast epithelial cells of BRCA1 or BRCA2 mutation carriers and noncarriers harbor common breast cancer copy number alterations

Affiliations

Luminal breast epithelial cells of BRCA1 or BRCA2 mutation carriers and noncarriers harbor common breast cancer copy number alterations

Marc J Williams et al. Nat Genet. 2024 Dec.

Abstract

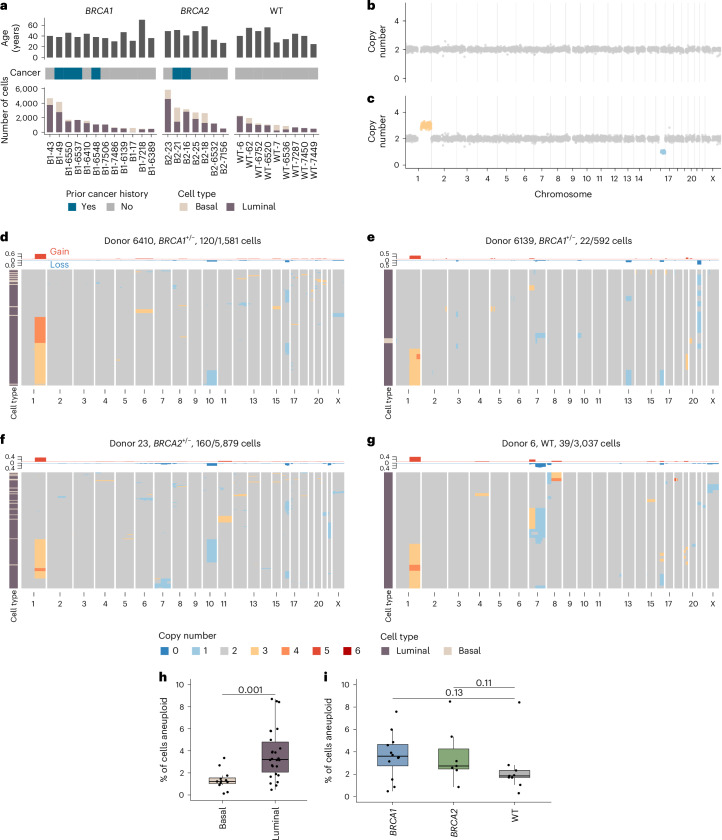
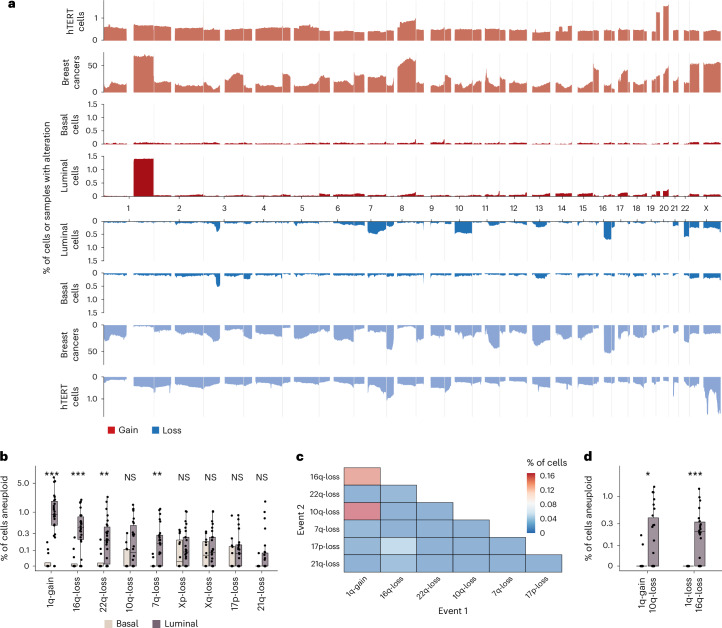
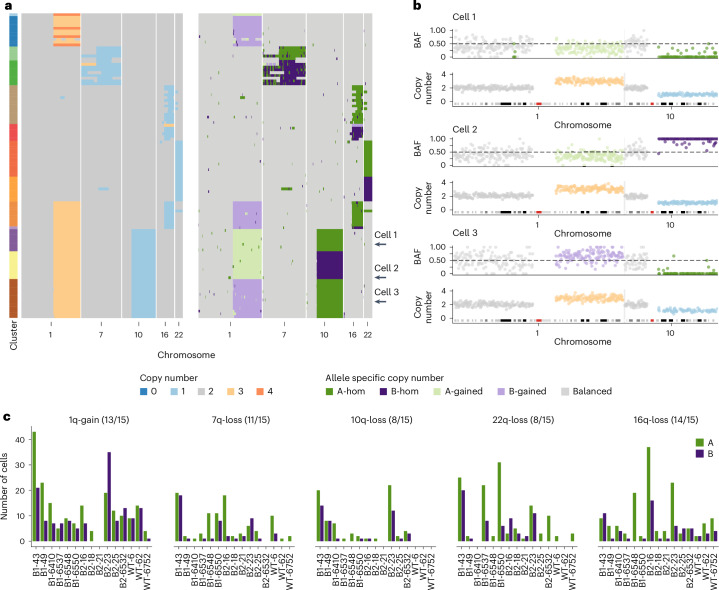
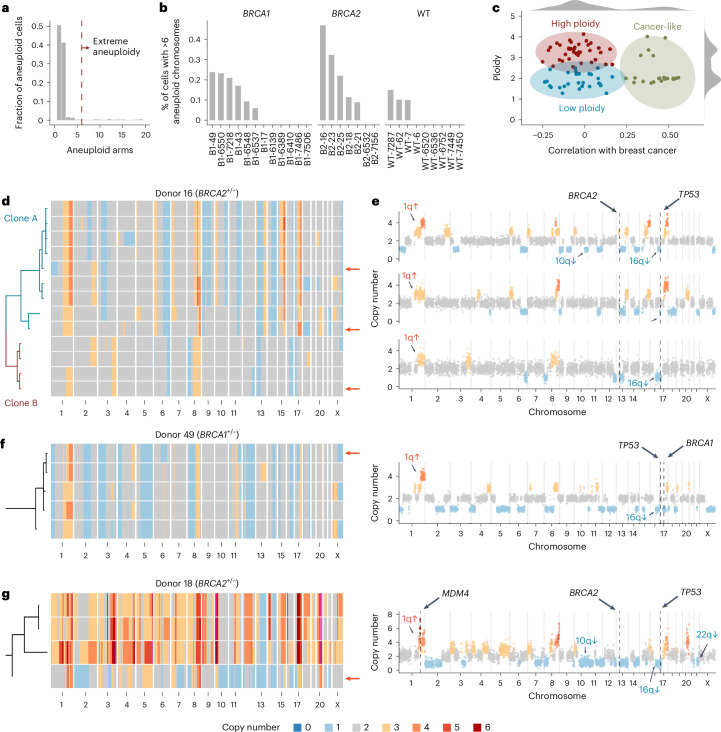
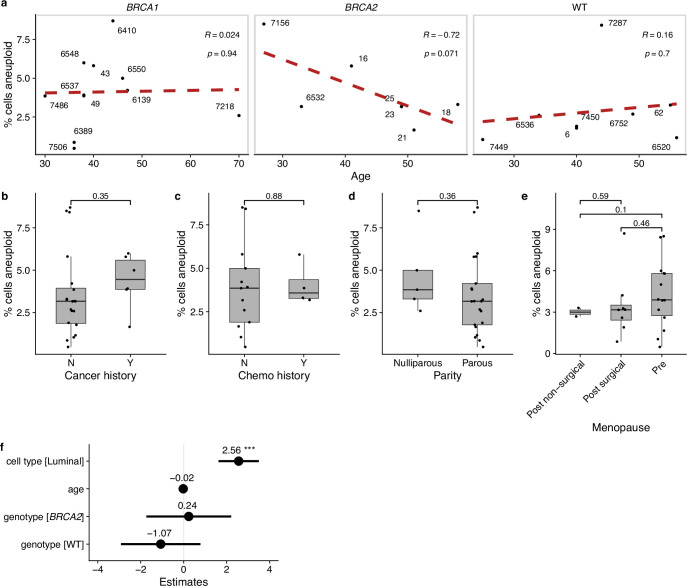
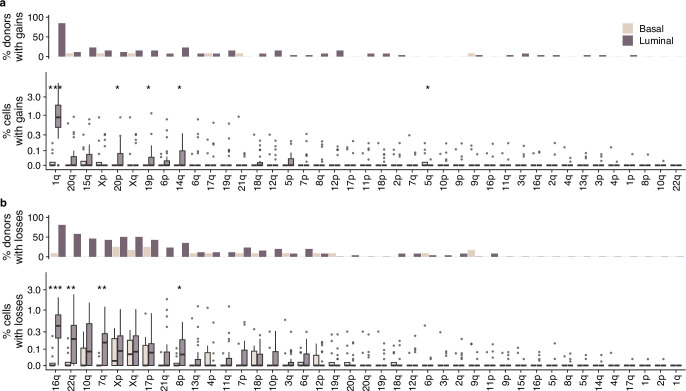
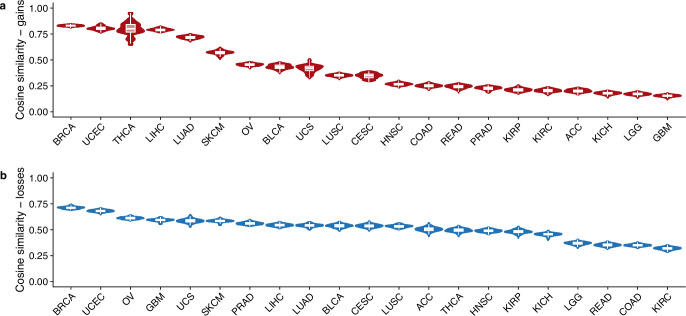
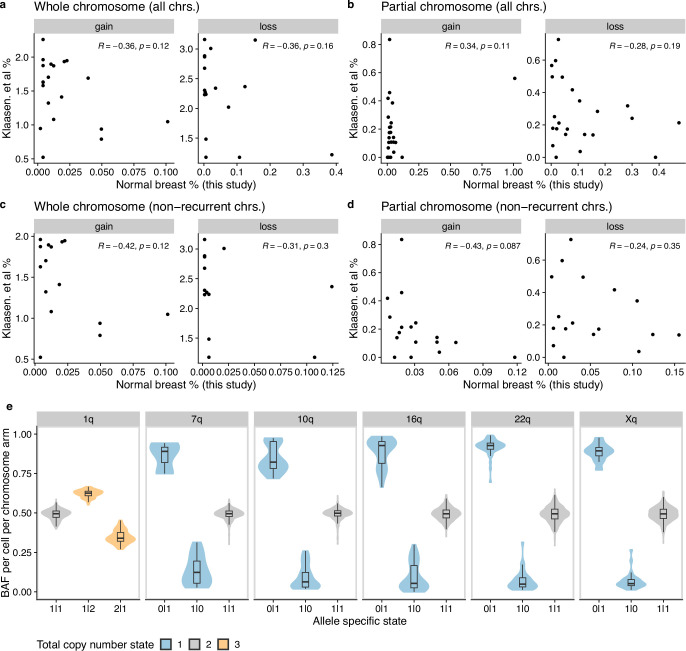
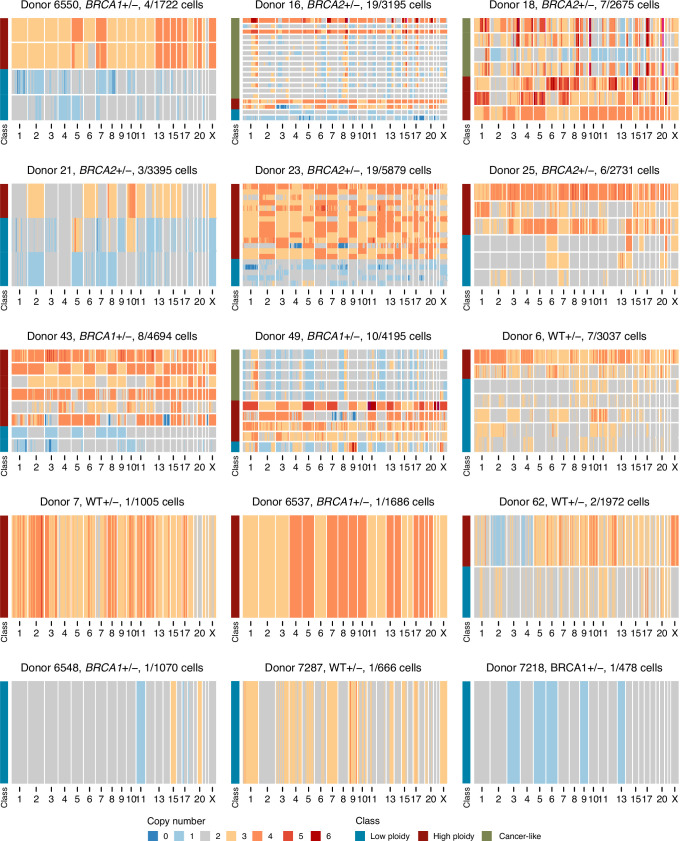
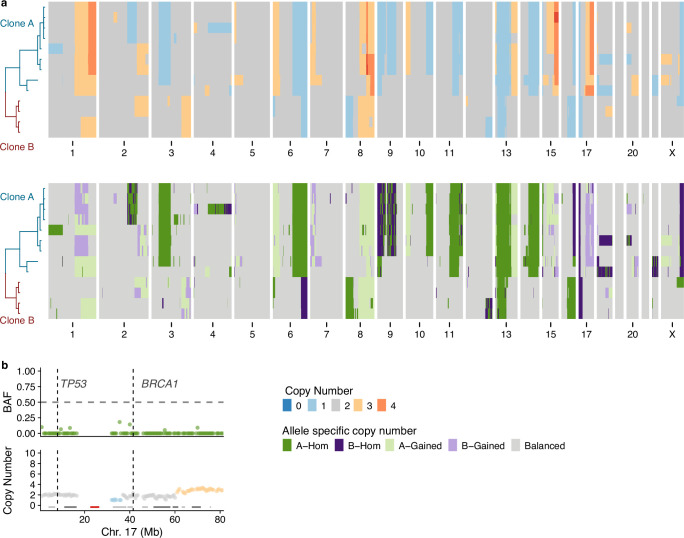
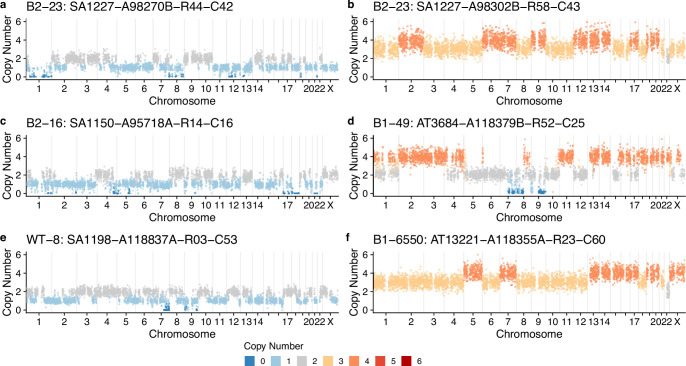
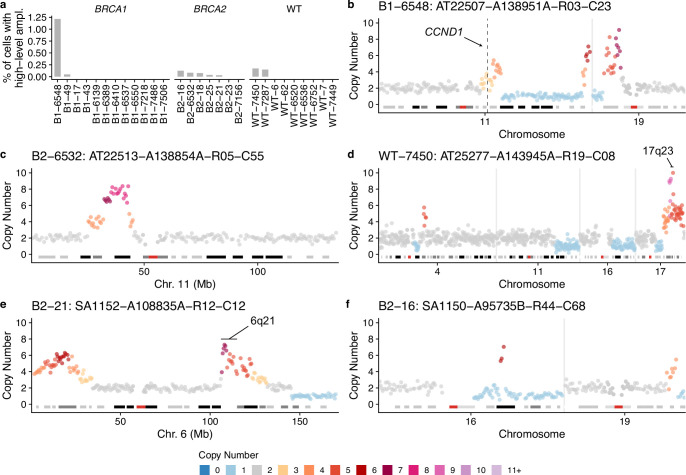
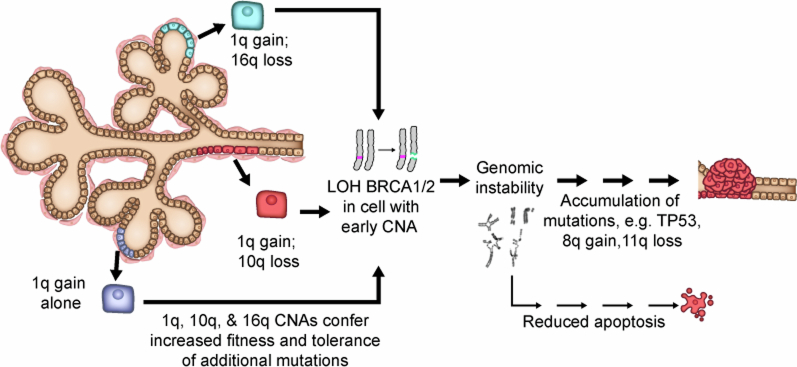
The prevalence and nature of somatic copy number alterations (CNAs) in breast epithelium and their role in tumor initiation and evolution remain poorly understood. Using single-cell DNA sequencing (49,238 cells) of epithelium from BRCA1 and BRCA2 carriers or wild-type individuals, we identified recurrent CNAs (for example, 1q-gain and 7q, 10q, 16q and 22q-loss) that are present in a rare population of cells across almost all samples (n = 28). In BRCA1/BRCA2 carriers, these occur before loss of heterozygosity (LOH) of wild-type alleles. These CNAs, common in malignant tumors, are enriched in luminal cells but absent in basal myoepithelial cells. Allele-specific analysis of prevalent CNAs reveals that they arose by independent mutational events, consistent with convergent evolution. BRCA1/BRCA2 carriers contained a small percentage of cells with extreme aneuploidy, featuring loss of TP53, BRCA1/BRCA2 LOH and multiple breast cancer-associated CNAs. Our findings suggest that CNAs arising in normal luminal breast epithelium are precursors to clonally expanded tumor genomes.


Conflict of interest statement

Competing interests: J.S.B. is a scientific advisory board (SAB) member of Frontier Medicines. D.A.D. is on the SAB for Oncology Analytics, has consulted for Novartis and receives research support from Canon. J.E.G. is a paid consultant for Helix and an uncompensated consultant for Konica Minolta and Earli. S.P.S. has consulted for AstraZeneca and has received funding from Bristol Meyers Squibb. S. Aparicio is cofounder and shareholder of Genome Therapeutics, uncompensated advisor to Chordia Therapeutics and advisor to Sangamo Therapeutics. The other authors declare no competing interests.

Figures

Fig. 1
Fig. 1. Cohort summary and example CNA heatmaps.
a, Number of high-quality cells per sample per cell type along with cancer history and patient ages. b, Example diploid cell. c, Example aneuploid cell with chr1q gain (yellow) and chr16q loss (blue). d, Heatmap of aneuploid cells from donor B1-6410. Title shows the donor name, genotype and number of aneuploid cells out of the total number of cells. Above the heatmap is the frequency of gains and losses across the genome, and the left-hand side track annotates the two cell types (basal and luminal). e, Heatmap of aneuploid cells from donor B1-6550. f, Heatmap of aneuploid cells from donor B2-23. g, Heatmap of aneuploid cells from donor WT-6. h, Percentage of cells aneuploid between luminal (n = 26 samples) and basal (n = 12 samples) cell types. i, Percentage of cells aneuploid between BRCA1 (n = 12), BRCA2 (n = 7) and WT (n = 9) genotypes. In h and j, P values are from the two-sided Wilcoxon rank-sum test between groups. Box plots indicate the median, first and third quartiles (hinges) and the most extreme data points no farther than 1.5× IQR from the hinge (whiskers). IQR, interquartile range.
Fig. 2
Fig. 2. CNA landscape across cell types and in breast cancers.
a, Frequency of gains (red) and losses (blue) across the cohort; y axis is a fraction of cells or samples that have gains/losses. Three cohorts are shown. hTERT cells, 13,569 cells from an immortalized mammary epithelial cell line; breast cancers, 555 whole-genome sequence cancers from ref. ; scWGS of luminal and basal cells from this study. The frequency of gains and losses for the scWGS data generated in this study are shown with a darker shade of red/blue. b, Percentage of cells aneuploid per patient split by luminal (n = 26 samples) and basal (n = 12 samples) cells for the nine most common chromosome alterations (mean percentage > 0.1%). Exact P values are as follows: gain of 1q (P = 0.00002), loss of 16q (P = 0.00011), loss of 22q (P = 0.0021), loss of 7q (P = 0.001), loss of 10q (P = 0.083), loss of Xp (P = 0.37), loss of Xq (P = 0.58), loss of 17p (P = 0.49) and loss of 21q (P = 0.057). c, Co-occurrence heatmap showing the percentage of cells that have two chromosomal aneuploidies concurrently for common alterations. d, Percentage of cells that have gain of 1q/loss of 16q and gain of 1q/loss of 10q per cell type (n = 26 luminal samples and n = 12 basal samples). Exact P values are as follows: gain of 1q/loss of 10q (P = 0.048) and gain of 1q/loss of 16q (P = 0.00026). Box plots indicate the median, first and third quartiles (hinges) and the most extreme data points no farther than 1.5× IQR from the hinge (whiskers). Asterisk indicates P values from the two-sided Wilcoxon rank-sum test: ***P < 0.001, **P < 0.01, *P < 0.05 in b and d. NS, not significant.
Fig. 3
Fig. 3. Allele-specific inference reveals the convergence of CNAs.
a, Total copy number heatmap and allele-specific copy number heatmap for B2-23 for chromosomes 1, 7, 19, 16 and 22. Cells are grouped into unique alterations based on allele-specific copy number. Total number of cells = 111. b, Three cells from the heatmap with chr1q gain and chr10q loss. For each cell, the BAF and copy number are shown for chromosomes 1 and 10. These three cells have distinct combinations of chr1-gain and 10 loss. Dashed line in BAF plots shows BAF = 0.5, colors in copy number and BAF plots are shown in the ‘’Copy number’ and ‘Allele specific copy number’ color legends, respectively. c, Number of cells with either allele A or B gained/lost across the six most common alterations in 15 donors. Title above each plot shows the event and the number of samples that have events on both alleles. Colors denote the allele lost or gained (green for A allele and purple for B allele). BAF, B allele frequency.
Fig. 4
Fig. 4. A subset of extreme aneuploid genomes is similar to breast cancer genomes.
a, Fraction of the aneuploid cells that have n aneuploid arms. Dashed red line shows the cutoff (=6) used to classify cells having extreme aneuploidy. b, Percentage of cells in each sample with >6 aneuploid chromosomes. c, Scatter plot of ploidy versus correlation (Pearson) with cancers from ref. highlighting the following three distinct groups: high ploidy, low ploidy and cancer-like. d, Heatmap of extreme aneuploid cancer-like cells in patient B2-16 ordered by a phylogenetic tree. e, Three cells from patient 16 with arrows showing their placement in the heatmap. f, Example cell and heatmap of extreme aneuploid cancer-like cells in patient B1-49. g, Example cell and heatmap of extreme aneuploid cancer-like cells in patient B2-18. For dg, the location within the heatmap of single-cell profiles shown on the right-hand side is shown with red arrows.
Extended Data Fig. 1
Extended Data Fig. 1. Clinical and biological associations with aneuploidy.
a, Scatter plot of percentage of cells aneuploid vs age stratified by genotype. Red dashed lines are the linear regression line. Inset text (here refers to R = 0.024 p = 0.94, etc.) shows correlation coefficient and p-value from Pearson correlation test. Distribution of percentage of cells aneuploid for other clinical covariates: b, cancer history (# per group: Y = 6, N = 22); c, chemotherapy history (# per group: Y = 4, N = 13); d, parity (# per group: parous = 22, nulliparous = 6); e, menopause status (# per group: pre = 15, post surgical = 8, post non-surgical = 2). Plots annotated with p-values from two-sided Wilcoxon rank-sum test. Box plots indicate the median, first and third quartiles (hinges) and the most extreme data points no farther than 1.5× the IQR from the hinge (whiskers). f, Coefficients of linear multivariate mixed-effect model of the percentage of aneuploidy as a function of genotype, cell type and age. Lines show 95% confidence interval, circles show point estimate of the coefficients. ***p < 0.001.
Extended Data Fig. 2
Extended Data Fig. 2. Prevalence of arm alterations per cell type.
a, Top: percentage of donors that have >1 cell with chromosome arm gained per cell type. Bottom: percentage of cells with gains per cell type (n = 12 basal samples, n = 26 luminal samples), each data point is a donor. b, Top: percentage of donors that have >1 cell with chromosome arm lost per cell type. Bottom: percentage of cells with losses per cell type (n = 12 basal samples, n = 26 luminal samples); each data point is a donor. Stars indicate p-values from two-sided Wilcoxon rank-sum test: ***p < 0.001, **p < 0.01, *p < 0.05. When no star is shown above comparisons, differences are not significant (p > 0). Box plots indicate the median, first and third quartiles (hinges) and the most extreme data points no farther than 1.5× the IQR from the hinge (whiskers). No adjustments for multiple comparisons were performed.
Extended Data Fig. 3
Extended Data Fig. 3. Cosine similarity with TCGA cancer subtypes.
Cosine similarity between landscape of CNAs in scWGS of normal breast epithelia and TCGA subtypes for gains (a) and losses (b). Plot shows the distribution over bootstrapped values (n = 25) as described in Methods. Box plots indicate the median, first and third quartiles (hinges) and the most extreme data points no farther than 1.5× the IQR from the hinge (whiskers).
Extended Data Fig. 4
Extended Data Fig. 4. Comparison with ref. and BAF distributions.
Aneuploidy rates per chromosome reported in ref. vs this study. Analysis was performed separately for (a) whole chromosome events across all chromosomes, (b) partial chromosome events across all chromosomes, (c) whole chromosome events across non-recurrent chromosomes and (d) partial chromosome events across all non-recurrent chromosomes. Non-recurrent chromosomes are all chromosomes after removing chromosomes 1,7,10,16,22 and X. Each plot shows the Pearson correlation coefficient and associated p-value. Normal breast percentages are from all cells (luminal and basal cell populations). e, B allele frequency (BAF) distributions in chromosome arms across cells, stratified by allele-specific state. Non-diploid states are strongly skewed toward either 0.0 or 1.0 depending on which allele is gained/lost thus supporting the total copy number calls. Included are all cells in the dataset with these alterations. Box plots indicate the median, first and third quartiles (hinges) and the most extreme data points no farther than 1.5× the IQR from the hinge (whiskers). Number of cells included for each chromosome 1q: 1145, 7q: 1175, 10q: 1233, 16q:1191, 22q:1234, Xq: 1205.
Extended Data Fig. 5
Extended Data Fig. 5. Additional extreme aneuploidy cells heatmaps.
All extreme aneuploid cells per patient. Title shows donor name, genotype and number of extreme aneuploid cells out of total number of cells.
Extended Data Fig. 6
Extended Data Fig. 6. Haplotype-specific analysis of cancer-like cells in B2-16 and B1-49.
a, Total and allele-specific copy number for the cancer-like cells in B2-16. Top, total copy number. Bottom, allele-specific copy number. b, B allele frequency and total copy number of chromosome 17 from donor B1-49. Location of TP53 and BRCA1 are shown with dashed lines. Data are a merged pseudobulk across the five cancer-like cells.
Extended Data Fig. 7
Extended Data Fig. 7. Examples of non-cancer-like extreme aneuploidy cells.
af, Examples of extreme aneuploid genomes that are not similar to breast cancer genomes.
Extended Data Fig. 8
Extended Data Fig. 8. Examples of focal amplifications.
a, Proportion of cells with focal amplifications (>4 copies in a segment >2 Mb but smaller than a chromosome arm) across all samples. Examples of single-cell genome copy number profiles with focal amplifications (bf) showing only chromosomes with amplifications or other CNAs; all other chromosomes are diploid. Copy number profiles are annotated with regions known to be enriched in breast cancers.
Extended Data Fig. 9
Extended Data Fig. 9. Proposed model of breast cancer initiation in BRCA1/2 carriers.
In the proposed model, CNAs that accumulate in normal breast tissues (for example, 1q-gain and 10q or 16q-loss) would enhance the fitness of the luminal epithelial cells. In BRCA1/2 mutation carriers, where inactivation of the wild-type (WT) copy of BRCA1/2 leads to defective DNA repair, genomic instability and apoptosis, luminal cells carrying these CNAs would be more tolerant of these stresses, thus allowing the homologous-recombination defective mutant cells to expand, acquire oncogenic mutations, and ultimately progress to cancer.

Update of

References

    1. Martincorena, I. et al. Tumor evolution. High burden and pervasive positive selection of somatic mutations in normal human skin. Science348, 880–886 (2015). - PMC - PubMed
    1. Rockweiler, N. B. et al. The origins and functional effects of postzygotic mutations throughout the human life span. Science380, eabn7113 (2023). - PMC - PubMed
    1. Martincorena, I. et al. Somatic mutant clones colonize the human esophagus with age. Science362, 911–917 (2018). - PMC - PubMed
    1. Cereser, B. et al. The mutational landscape of the adult healthy parous and nulliparous human breast. Nat. Commun.14, 5136 (2023). - PMC - PubMed
    1. Li, Y. et al. Patterns of somatic structural variation in human cancer genomes. Nature578, 112–121 (2020). - PMC - PubMed