. 2024 Dec;3(12):1503-1515.
doi: 10.1038/s44161-024-00564-3. Epub 2024 Nov 20.

Genetic and phenotypic architecture of human myocardial trabeculation

Affiliations

Genetic and phenotypic architecture of human myocardial trabeculation

Kathryn A McGurk et al. Nat Cardiovasc Res. 2024 Dec.

Abstract

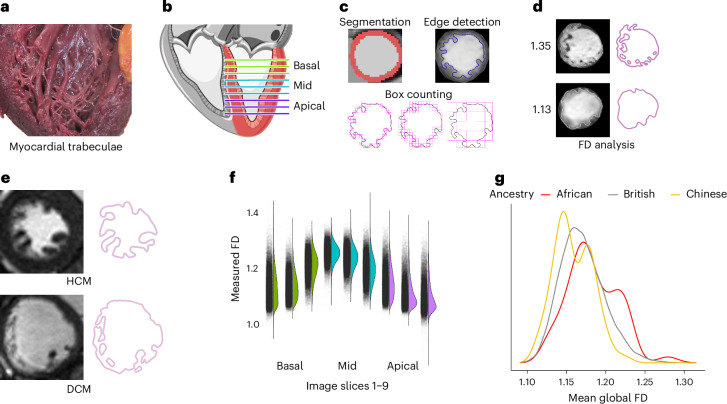
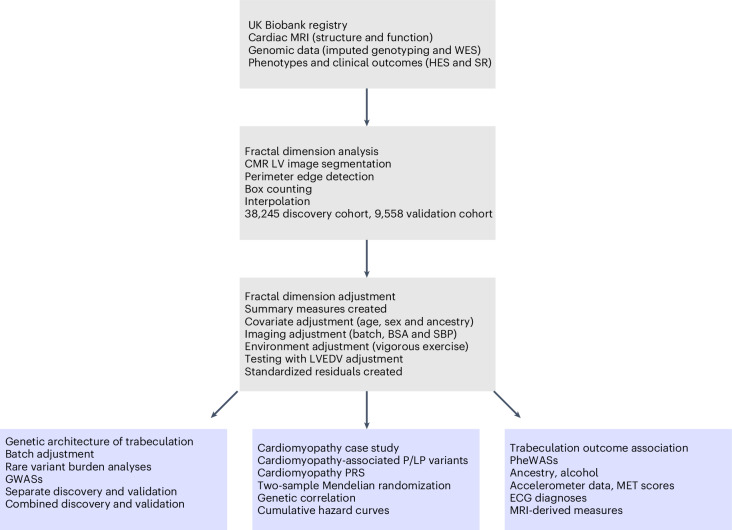
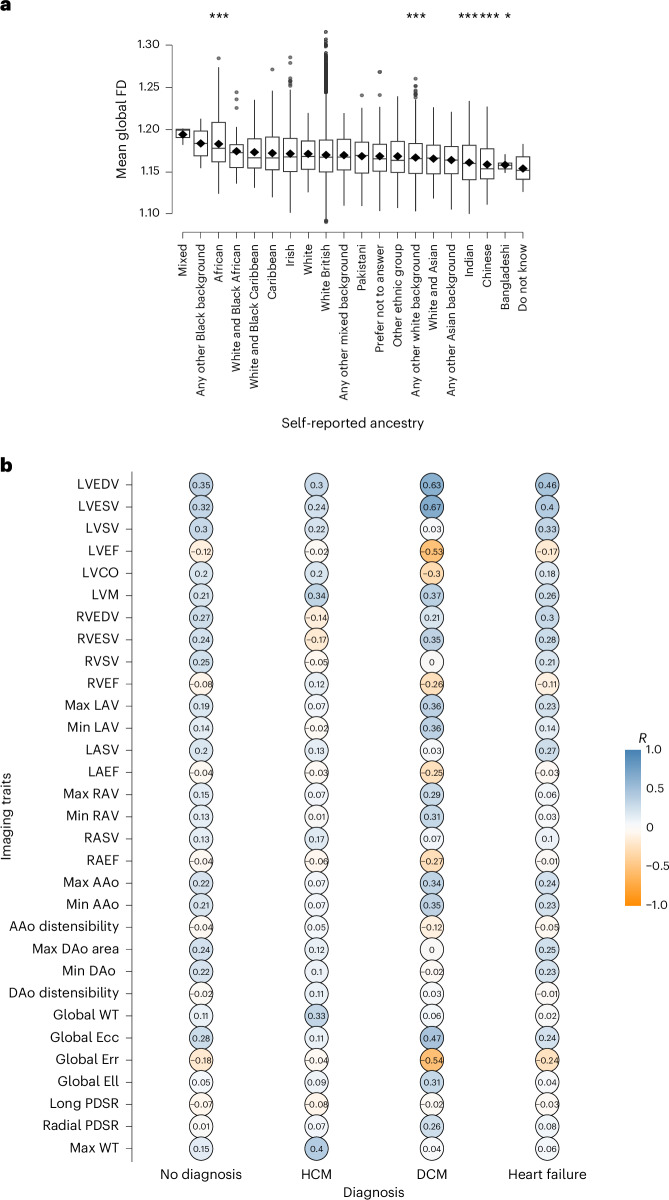
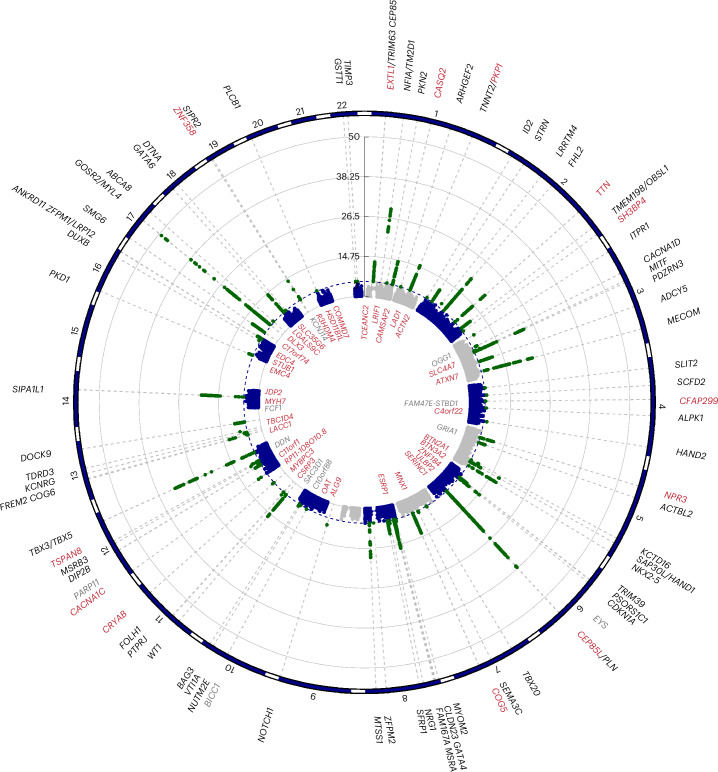
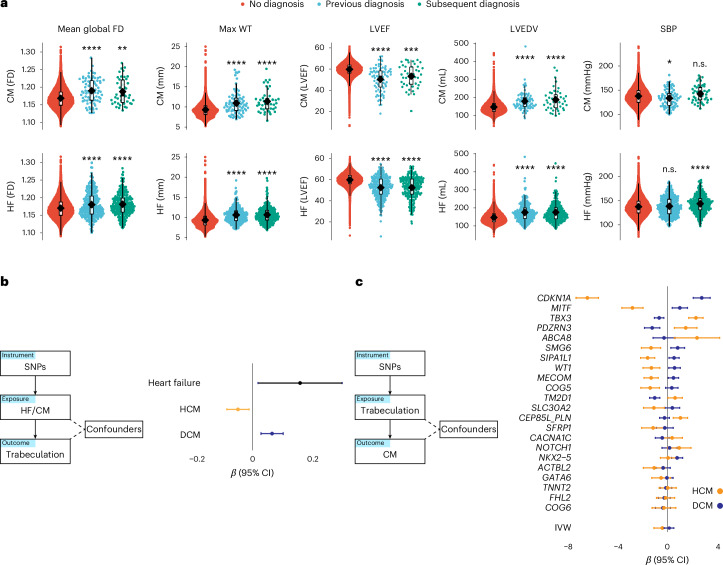
Cardiac trabeculae form a network of muscular strands that line the inner surfaces of the heart. Their development depends on multiscale morphogenetic processes and, while highly conserved across vertebrate evolution, their role in the pathophysiology of the mature heart is not fully understood. Here we report variant associations across the allele frequency spectrum for trabecular morphology in 47,803 participants of the UK Biobank using fractal dimension analysis of cardiac imaging. We identified an association between trabeculation and rare variants in 56 genes that regulate myocardial contractility and ventricular development. Genome-wide association studies identified 68 loci in pathways that regulate sarcomeric function, differentiation of the conduction system and cell fate determination. We found that trabeculation-associated variants were modifiers of cardiomyopathy phenotypes with opposing effects in hypertrophic and dilated cardiomyopathy. Together, these data provide insights into mechanisms that regulate trabecular development and plasticity, and identify a potential role in modifying monogenic disease expression.


Conflict of interest statement

Competing interests: D.P.O. has consulted for Bayer AG and Bristol-Myers Squibb. J.S.W. has consulted for MyoKardia, Inc., Pfizer, Foresite Labs, Health Lumen and Tenaya Therapeutics and has received research support from Bristol-Myers Squibb. R.T.L. has consulted for Health Lumen and FITFILE. None of these activities are directly related to the work presented here. The other authors declare no competing interests.

Figures

Fig. 1
Fig. 1. Summary of the analysis of trabeculation.
a, Myocardial trabeculae on the endocardial surface of the human LV. b, CMR of the LV was acquired in the short-axis plane from base to apex. c, The myocardium was segmented using deep learning algorithms and edge detection used to define the boundary between the trabeculae and the blood pool. Trabecular complexity was defined by measuring the fractal dimension (FD) of this boundary using a box-counting methodology. d, Examples of the resulting FD output. e, Examples of trabecular morphology and edge detection are given for participants with HCM and DCM cardiomyopathies. The images have been reproduced with permission from the UK Biobank. f, The distribution of raw FD values at each level of the LV (bars represent range). g, The distributions of FD by ancestry. African ancestry had increased mean global FD, and Chinese ancestry had decreased mean global FD. All images show an adult human heart. Image credit: a, Arpatsara/Shutterstock.com; b, GraphicsRF/Shutterstock.com.
Fig. 2
Fig. 2. Study flowchart.
A summary of the main steps in our analysis of fractal dimension and the genetic and outcome associations. MRI, magnetic resonance imaging; WES, exome sequencing; SR, self-reported; BSA, body surface area.
Fig. 3
Fig. 3. Association of trabecular morphology with ancestry and CMR-derived summary measures.
The analyses were completed on 38,245 participants of the UK Biobank population. a, Compared with British ancestry, which dominates the UK Biobank, the mean global fractal dimension was increased for participants of African ancestry. Indian, Chinese, Bangladeshi and ‘any other white background’ self-reported ancestry had the lowest statistically significant fractal dimension (FD). Student’s two-sided t-test was used to compare means. The asterisks represent the P value. *P ≤ 0.05, ***P ≤ 0.001. For multiple comparisons, P ≤ 0.001 was deemed statistically significant. The presented box plots visualize the median, first and third quartiles, and the mean is presented as a diamond. b, The table quantifies the relationship (correlation coefficient, R) between mean global fractal dimension and two-dimensional summary imaging cardiac measures separately for participants with no diagnosis (n = 31,067), HCM (n = 31), DCM (n = 29) and heart failure (n = 332). EDV, end-diastolic volume; ESV, end-systolic volume; SV, stroke volume; EF, ejection fraction; CO, cardiac output; RV, right ventricle; LAV, left atrial volume; RAV; right atrial volume; AAo, ascending aortic area; DAo, descending aorta area; Ecc, circumferential strain; Err radial strain; Ell, longitudinal strain; PDSR, peak diastolic strain rate; WT, wall thickness.
Fig. 4
Fig. 4. PheWAS of trabecular complexity and other CMR-derived traits.
Maximum wall thickness (max WT) for HCM, LVEDV for DCM, SBP and LVEF were analyzed to assess pleiotropy between the trabecular complexity (fractal dimension, FD) and remodeling traits altered in cardiomyopathies. FD was measured at different spatial locations in the LV, and the aggregate of all results is shown. Mean global FD was associated only with cardiomyopathies, heart failure, conduction disorders and valve diseases (Extended Data Fig. 3). The analyses were completed on 38,245 participants of the UK Biobank population. Phenotypes as phecodes are described on the y axis, with the phecode category separating the groups, and the imaging traits are on the x axis. Each point denotes a statistically significant PheWAS association through linear regression with a Bonferroni correction for 1,163 analyzed phecodes. The shape and color denote the direction of effect and odds ratio. Categories and phenotypes other than the circulatory system category that did not associate with measures of trabecular morphology but were associated with the imaging measures were removed from the plot for clarity, and the most relevant traits are shown, with redundant traits shown once. NOS, not otherwise specified.
Fig. 5
Fig. 5. Circular Manhattan plot for genetic loci associated with trabeculation.
Common and rare variant genetic analyses for trabecular complexity assessed with fractal dimension analysis. The prioritized gene is noted for the statistically significant loci identified through combined discovery and validation of common variant GWAS on the outside of a meta-Manhattan plot of the minimum P value for each SNP across measures of trabeculation. The RVAS identified genes with a burden of PAVs that are associated with trabecular morphology (depicted inside the circle). Genes in red on the outside circle denote a gene identified through both GWAS and RVAS. Genes in gray were identified only in the discovery analysis and not in the full analysis of combined discovery and validation cohorts. Created using CMplot in R. The GWAS results were statistically significant if P < 5 × 10−8. The RVAS results were statistically significant after adjusting for the number of genes analyzed.
Fig. 6
Fig. 6. Relationship between trabecular complexity and cardiomyopathy.
Increased fractal dimension (FD) may occur early in the natural history of cardiomyopathies (CMs) and heart failure (HF). a, Imaging biomarkers (LVEDV, ejection fraction (LVEF), maximum wall thickness (max WT), SBP and mean global fractal dimension) for three groups of participants depending on CM or HF diagnosis status; as (i) no diagnosis, (ii) diagnosis recorded previous to imaging or (iii) diagnosis recorded after imaging. Analyses were performed on 38,245 participants of the UK Biobank. Student’s two-sided t-test was used to compare the group means to individuals with no diagnosis. The lower and upper hinges in the box plot correspond to the 25th and 75th percentiles (interquartile range, IQR), respectively. The horizontal line in the box plot indicates the median. The lower and upper whiskers extend from the hinge to the smallest and largest values no further than 1.5× the IQR, respectively. Each dot is one individual. The asterisks represent the P value. n.s., not statistically significant, P > 0.05; *P ≤ 0.05, **P ≤ 0.01, ***P ≤ 0.001, ****P ≤ 0.0001. For multiple comparisons, P ≤ 0.001 was deemed statistically significant. b, MR genetic determination model of CM and HF genetic instruments as exposures for trabeculation outcome. Common genetic loci influencing the variability of cardiac function in an additive fashion may be deferentially involved depending on the CM substrate. Common genetic variants associated with DCM increased trabecular complexity and HF risk. Common genetic variants associated with HCM had an inverse relationship with trabeculation. Two-sample MR was undertaken with genetically determined mean global FD (using summary statistics from the GWAS of 38,245 European participants) and genetically determined DCM, HCM and HF (from GWAS summary statistics of published data). Presented are the inverse variance weighted (IVW) estimates. c, MR genetic determination model of trabeculation genetic instruments (from GWAS of 38,245 participants) as exposures for CM outcomes was not statistically significant (IVW). The single SNP funnel plot for trabeculation genetic instruments as exposures for cardiomyopathies shows that trabeculation-associated variants have opposing directions of effect for DCM or HCM. The plot is ordered by the delta of the β values; β and 95% CIs are presented with a vertical line at β = 0. Four variants were removed that were not present in the HCM summary statistics so GWAS β values could not be compared with DCM.
Extended Data Fig. 1
Extended Data Fig. 1. Association of covariates with mean global fractal dimension.
Covariate-adjusted mean global trabeculation measured by fractal dimension analysis was compared to a) age at scan, b) age2, c) systolic blood pressure (SBP), d) body surface area (BSA), e) sex (0 = female, 1 = male), and f) imaging batch (three imaging centres). a)-d) are presented as scatter plots with density contours and lines of the goodness of fit (gam; formula y≈s(x)) are plotted. e)-f) are presented as overlapping density distributions with the standardised mean of 0 plotted as a vertical line for comparison.
Extended Data Fig. 2
Extended Data Fig. 2. The relationship of mean global fractal dimension (FD) adjusted for left ventricular end-diastolic volume (LVEDV) with summary cardiac magnetic resonance (CMR) imaging measures in participants with cardiomyopathy or heart failure.
The table quantifies the relationship (correlation coefficient, R) between mean global fractal dimension and 2D summary imaging cardiac measures separately for participants with no diagnosis (n = 31,067), hypertrophic cardiomyopathy (HCM, n = 31), dilated cardiomyopathy (DCM, n = 29), and heart failure (n = 332). LV, left ventricular; EDV, end diastolic volume; ESV, end systolic volume; SV, stroke volume; EF, ejection fraction; CO, cardiac output; RV, right ventricular; LAV, left atrial volume; RAV; right atrial volume; AAo, ascending aortic area; DAo, descending aorta area; Ecc, circumferential strain; Err radial strain; Ell, longitudinal strain; PDSR, peak diastolic strain rate.
Extended Data Fig. 3
Extended Data Fig. 3. Phenome-wide association study of trabecular complexity and other CMR-derived traits.
Maximum wall thickness (max WT) for hypertrophic cardiomyopathy (HCM), left ventricular end-diastolic volume (LVEDV) for dilated cardiomyopathy (DCM), systolic blood pressure (SBP), and ejection fraction (LVEF), were analyzed to assess pleiotropy between the trabecular complexity measures (FD, fractal dimension) and remodeling traits altered in cardiomyopathies. Fractal dimension was measured at different spatial locations in the left ventricle and all of the results are shown. The analyses were completed on 38,245 participants of the UK Biobank population. Phenotypes as phecodes are described on the y-axis with the phecode category separating the groups and the imaging traits are on the x-axis. Each point denotes a statistically significant PheWAS association with FD with a Bonferroni correction for 1,163 analyzed phecodes. The shape and colour denote the direction of effect (neg, negative; pos, positive) and odds ratio (OR).
Extended Data Fig. 4
Extended Data Fig. 4. PheWAS of summary trabeculation measures when adjusted for left ventricular end diastolic volume (LVEDV).
Fractal dimension was measured at different spatial locations in the left ventricle and the summary of results by region are shown. The analyses were completed on 38,245 participants of the UK Biobank population. Phenotypes as phecodes are described on the y-axis with the phecode category separating the groups and the imaging traits are on the x-axis. Each triangle denotes a statistically significant PheWAS association with a Bonferroni correction for 1,163 analyzed phecodes. The shape denotes the direction of effect and odds ratio.
Extended Data Fig. 5
Extended Data Fig. 5. Trabeculation and variant pathogenicity.
Student’s two-sided t-test was used to compare the group means. The lower and upper hinges in the box plot correspond to the 25th and 75th percentiles (interquartile range (IQR)), respectively. The horizontal line in the box plot indicates the median and the diamond indicates the mean. The lower and upper whiskers extend from the hinge to the smallest and largest values no further than 1.5 × the IQR, respectively. Each dot is one individual. *, P < 0.05; **, P < 0.01; ***, P < 0.001; ****, P < 0.0001, compared to the negative reference group. For multiple comparisons, a P ≤ 0.001 was deemed statistically significant. CM, cardiomyopathy. a) Carriers of cardiomyopathy-associated pathogenic or likely pathogenic variants (G+) with or without a diagnosis of disease (phenotype; P+/-) had increased mean trabeculation compared to genotype negatives. P-G+, phenotype negative, genotype positive; P+G-, phenotype positive, genotype negative; P+G+, phenotype positive, genotype positive; Negative, genotype and phenotype negative. There were 23,936 genotype-negative participants, 222 participants with a P/LP variant without a diagnosis of cardiomyopathy, 63 participants with disease and no variant in definitive-evidence genes, and 12 participants with a variant and diagnosis of disease. These independent groups of individuals for b) HCM and c) DCM, were separated by carrier status. For HCM-associated variants, there were 28,006 genotype-negative participants (Negative), 6,040 participants with variants in syndromic genes (Positive1), 1,330 participants with common variants (AF < 0.01 & > 0.00004) in definitive-evidence genes (Positive2A), 680 participants with rare indeterminant (VUS) variants in definitive-evidence genes (Positive2B - statistically significant), 72 carriers of P/LP variants (Positive3 - statistically significant). For DCM-associated variants, there were 28,109 genotype-negative participants (Negative), 3,379 participants with variants in syndromic genes (Positive1), 2,710 participants with common variants (AF < 0.01& > 0.000084) in definitive-evidence genes (Positive2A), 1,837 participants with rare indeterminant variants in definitive-evidence genes (Positive2B), 162 carriers of P/LP variants (Positive 3 - statistically significant).
Extended Data Fig. 6
Extended Data Fig. 6. Outcome associations.
The analyses were completed on 47,803 participants of the UK Biobank population and assessed from years since imaging for a diagnosis of a cardiac condition or all-cause death, with anyone diagnosed before imaging excluded. Trabeculation was separated into three groups: hyper-, median, and hypotrabeculation where < 1.5 standard deviation (SD) is hypotrabeculation and > 1.5 SD is hypertrabeculation. The dashed verticle line represents the comparative reference group (Midtrabeculation). Hazard ratios and 95% confidence intervals are presented. a, The hazard ratio for heart failure, for mitral valve disorders, and bundle branch block, showed increased risk with hypertrabeculation. b, The hazard ratio with the adjustment for left ventricular end diastolic volume (LVEDV) (and removal of the association of trabeculation with dilated cardiomyopathy (DCM)) showed that hypotrabeculation was associated with the risk of non-DCM heart failure. c, The hazard ratio for assessments with participants diagnosed with heart failure only showed that heart failure risk increased with hypotrabeculation. Of those with heart failure or death, participants with hypotrabeculation were diagnosed or died nearly a year later on average. d, The mean coxfit linear predictors for heart failure were plotted for trabeculation by decile. Confidence intervals and log-rank P values are depicted. CI, concordance index.
Extended Data Fig. 7
Extended Data Fig. 7. Sensitivity analysis of the association of trabeculation outside 1.5 standard deviations (SD) with clinical outcomes.
The plots show the same analysis completed for 1.5 SD before by 1 SD for a, heart failure (hypertrabeculation P = 9.83 x 10⁻⁶), b, mitral valve disease (hypertrabeculation P = 4.96 x 10⁻⁵), and c, bundle branch block (hypertrabeculation P = 0.00027). The mean coxfit linear predictors were plotted for trabeculation by group. Confidence intervals and log-rank P values are depicted.
Extended Data Fig. 8
Extended Data Fig. 8. Association of fractal dimension and heart failure risk in participants with non-dilated non-hypertrophied ventricles.
The analyses were completed on 47,803 participants of the UK Biobank population and assessed from years since imaging for a diagnosis of a cardiac condition or all-cause death, with anyone diagnosed before imaging excluded. Trabeculation was separated into three groups: hyper-, median, and hypotrabeculation where < 1.5 standard deviation (SD) is hypotrabeculation and > 1.5 SD is hypertrabeculation. The dashed vertical line represents the comparative reference group (Midtrabeculation). Hazard ratios and 95% confidence intervals (CIs) are presented.
Extended Data Fig. 9
Extended Data Fig. 9. Relationship between trabecular complexity and cardiomyopathy.
Mendelian randomization genetic determination model of trabeculation genetic instruments adjusted for left ventricular end diastolic volume (LVEDV; from GWAS of 38,245 European participants) as exposures for cardiomyopathy outcomes was not statistically significant (inverse variance weighted; IVW). The single SNP funnel plot for trabeculation genetic instruments as exposures for cardiomyopathies shows that trabeculation-associated variants have opposing directions of effect for dilated cardiomyopathy (DCM) or hypertrophic cardiomyopathy (HCM). The plot is ordered by the delta of the betas.
Extended Data Fig. 10
Extended Data Fig. 10. Mendelian randomization analysis of dilated cardiomyopathy (DCM) and hypertrophic cardiomyopathy (HCM) as exposures on heart failure outcomes.
The plot shows summary information on the analyses, performed as per the TwoSampleMR R package using publicly available GWAS results (see Methods). The vertical line represents β = 0. Betas and 95% confidence intervals (CIs) are presented.

References

    1. Sedmera, D. & McQuinn, T. Embryogenesis of the heart muscle. Heart Fail. Clin.4, 235–245 (2008). - PMC - PubMed
    1. Monte-Nieto, G. et al. Control of cardiac jelly dynamics by NOTCH1 and NRG1 defines the building plan for trabeculation. Nature557, 439–445 (2018). - PubMed
    1. Walsh, R. The trouble with trabeculation: how genetics can help to unravel a complex and controversial phenotype. J. Cardiovasc. Transl. Res.16, 1310–1324 (2023). - PubMed
    1. Grego-Bessa, J. et al. Nrg1 regulates cardiomyocyte migration and cell cycle in ventricular development. Circ. Res.133, 927–943 (2023). - PMC - PubMed
    1. Sacco, F. et al. Left ventricular trabeculations decrease the wall shear stress and increase the intra-ventricular pressure drop in cfd simulations. Front. Physiol.9, 458 (2018). - PMC - PubMed

MeSH terms

LinkOut - more resources