. 2024 Dec;3(12):1468-1481.
doi: 10.1038/s44161-024-00562-5. Epub 2024 Nov 20.

Intrinsic GATA4 expression sensitizes the aortic root to dilation in a Loeys-Dietz syndrome mouse model

Affiliations

Intrinsic GATA4 expression sensitizes the aortic root to dilation in a Loeys-Dietz syndrome mouse model

Emily E Bramel et al. Nat Cardiovasc Res. 2024 Dec.

Abstract

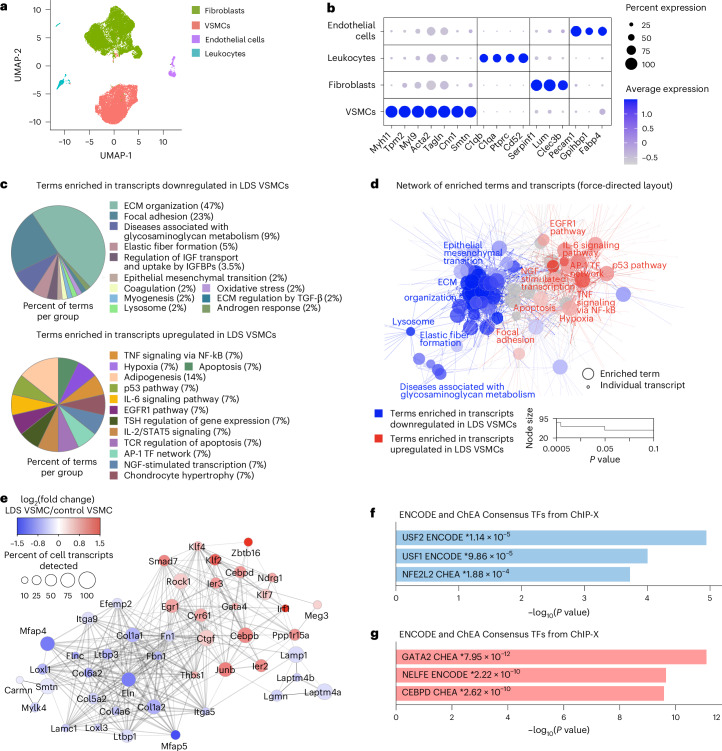
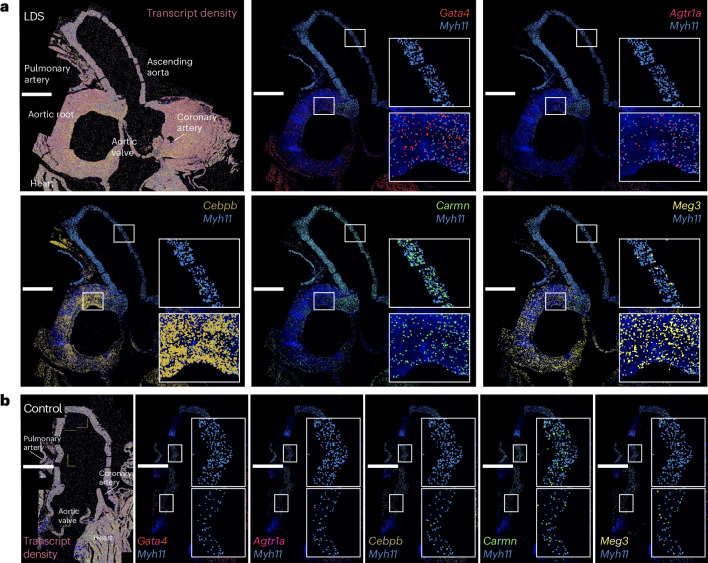
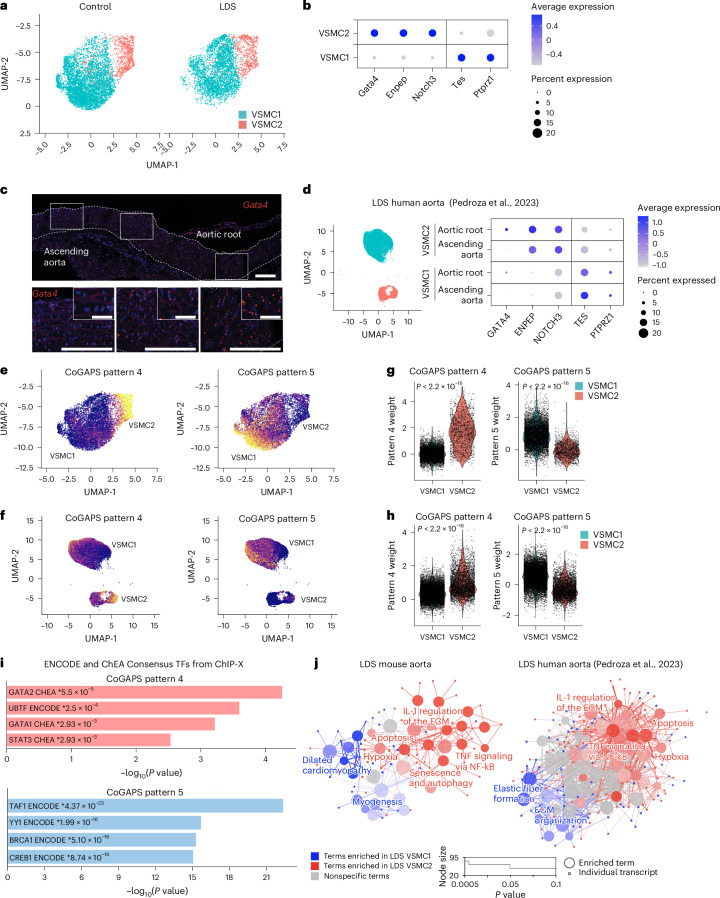
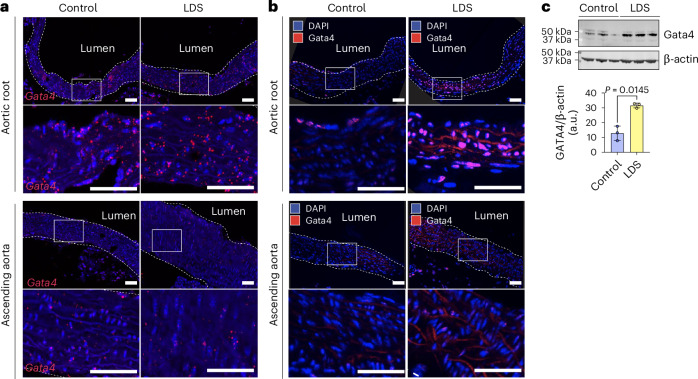
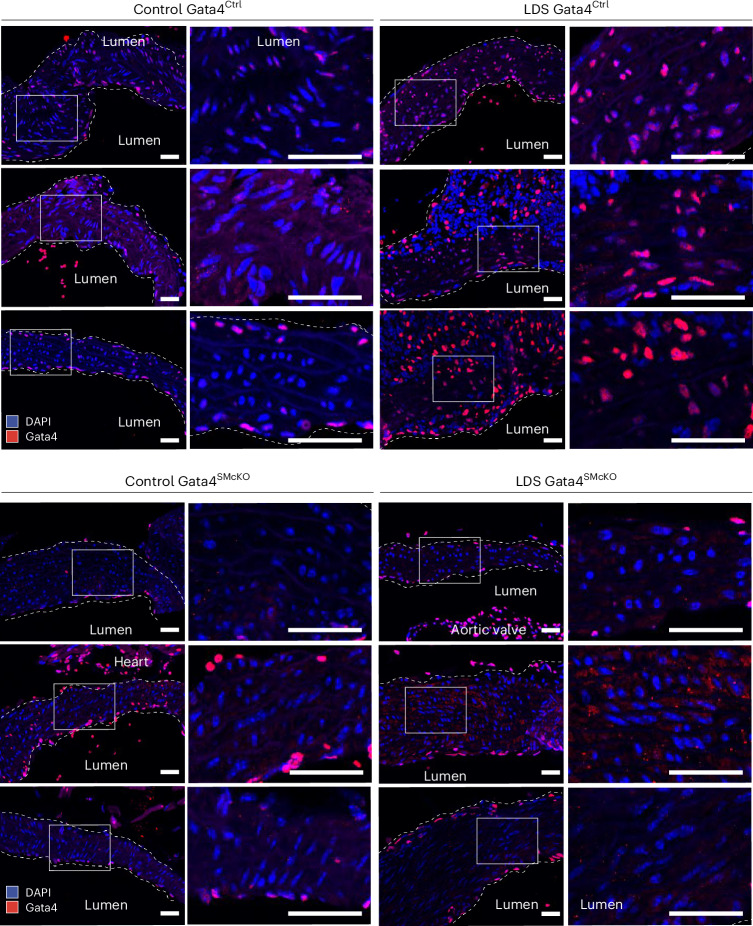
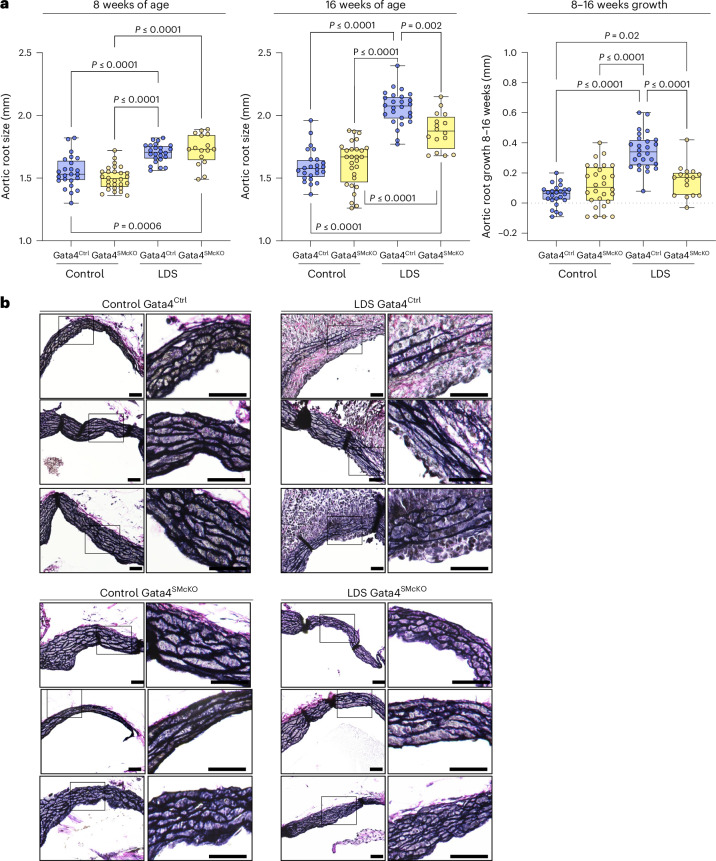
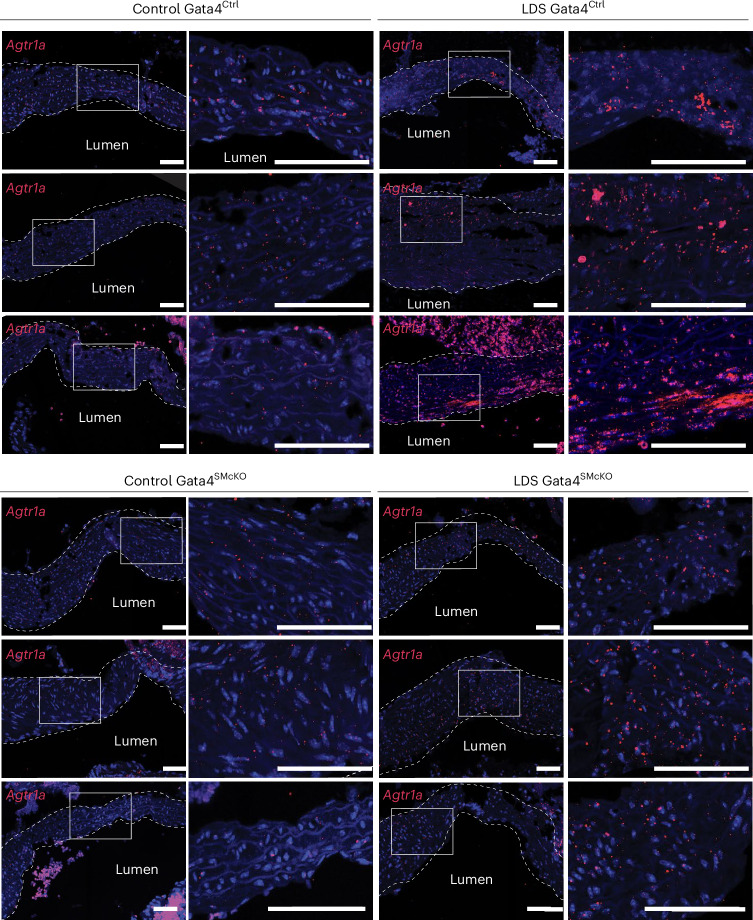
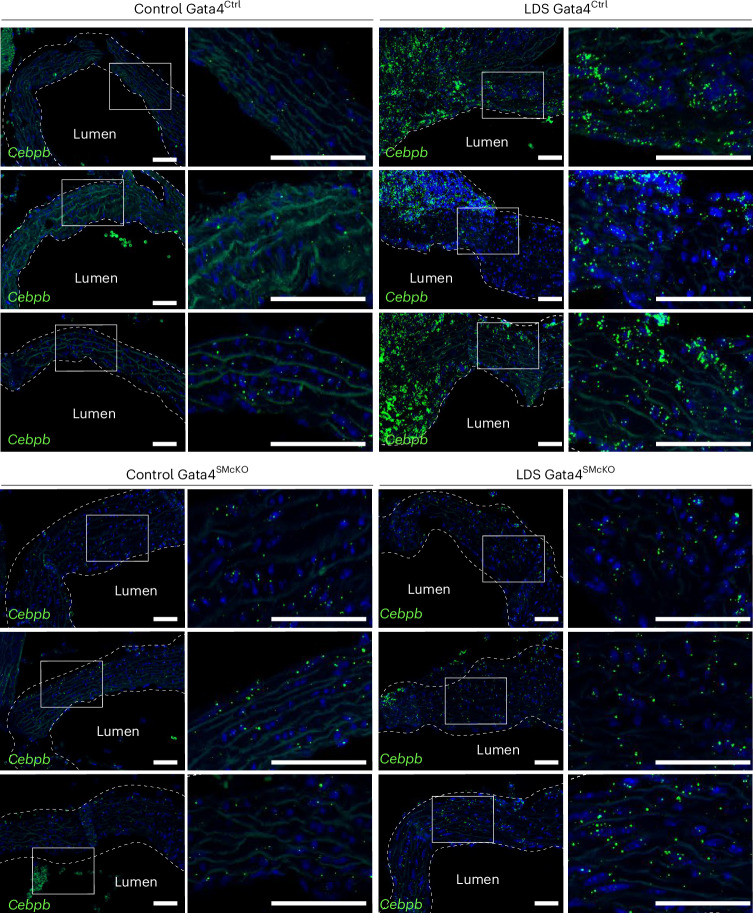
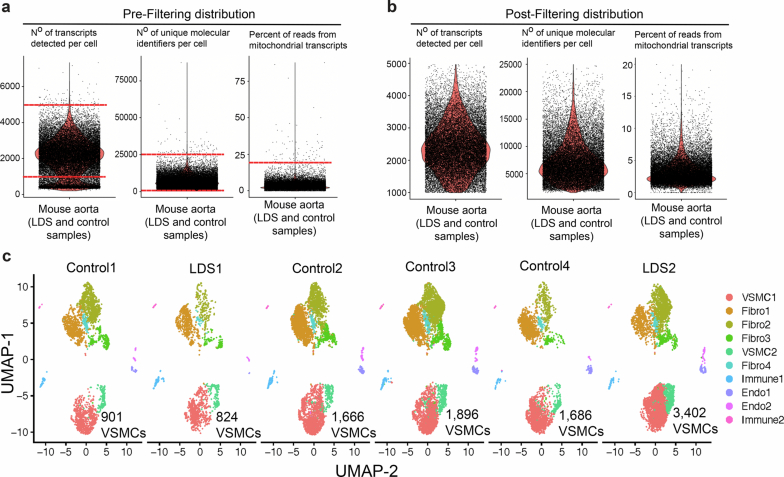
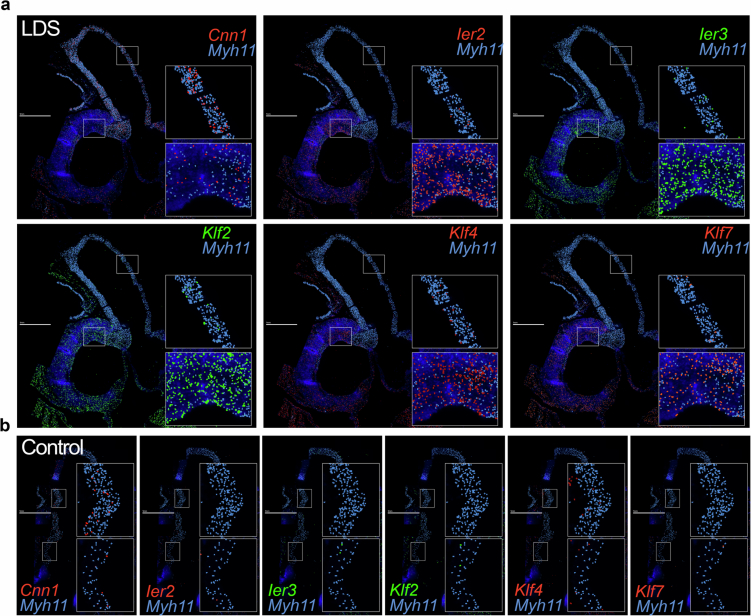
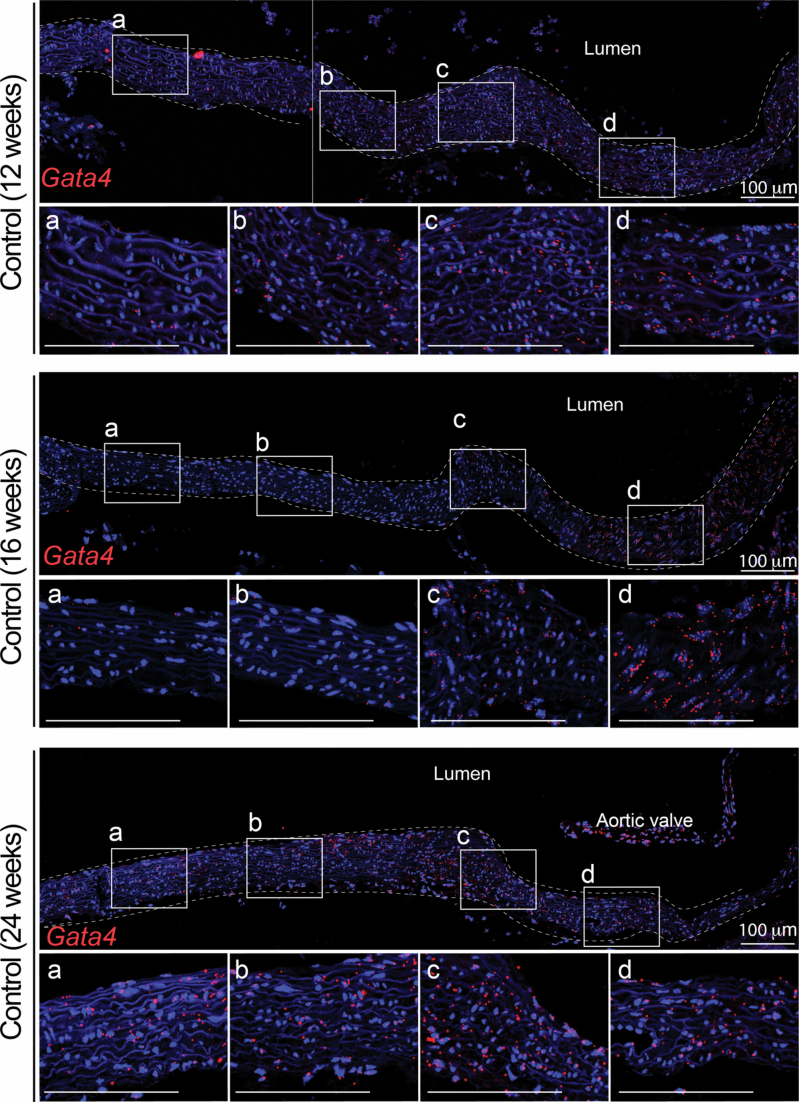
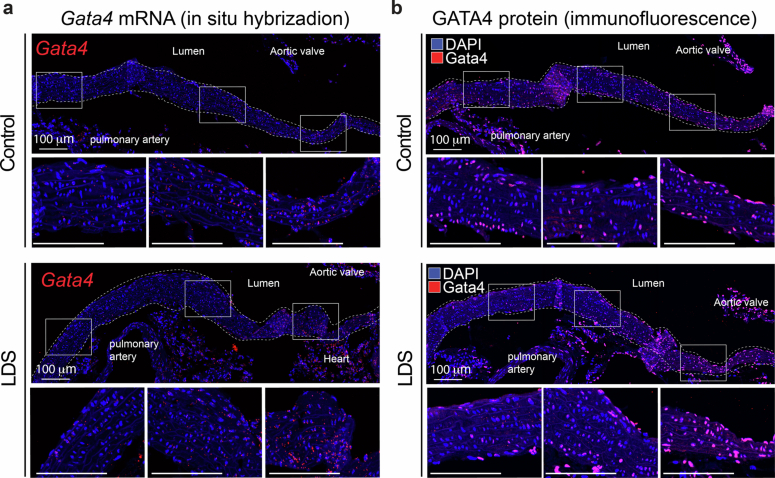
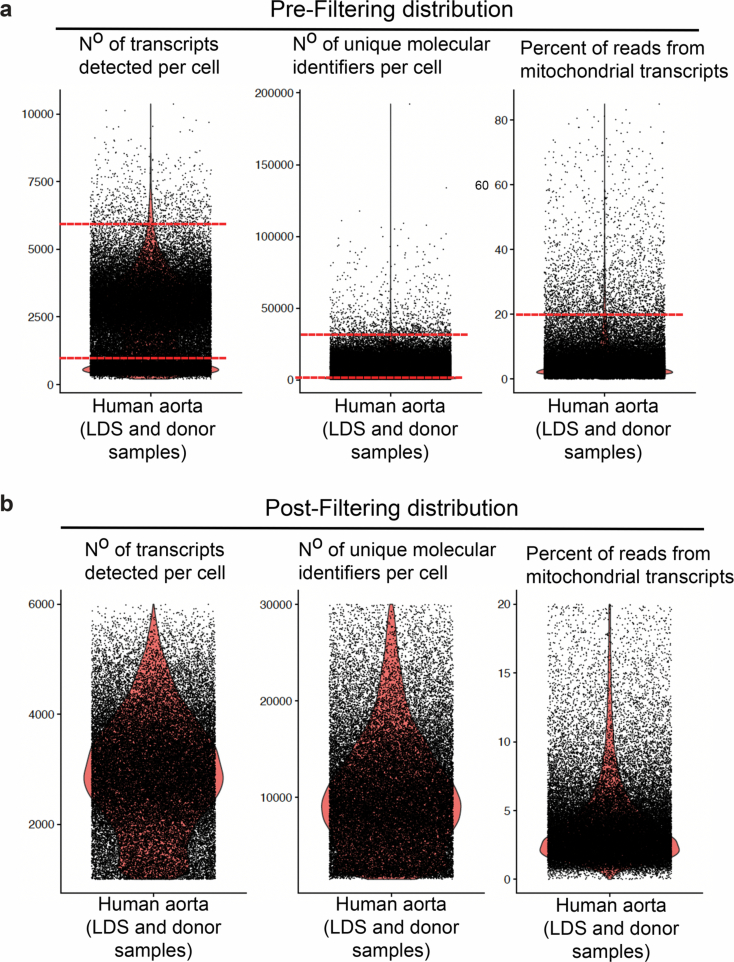
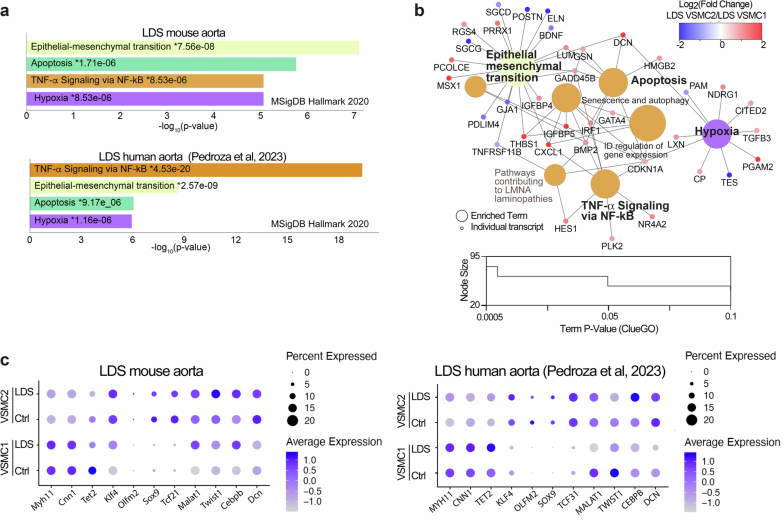
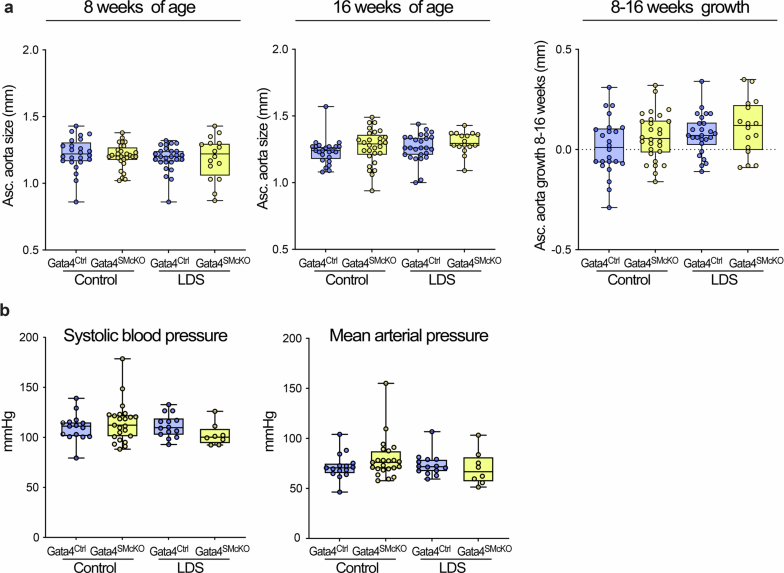
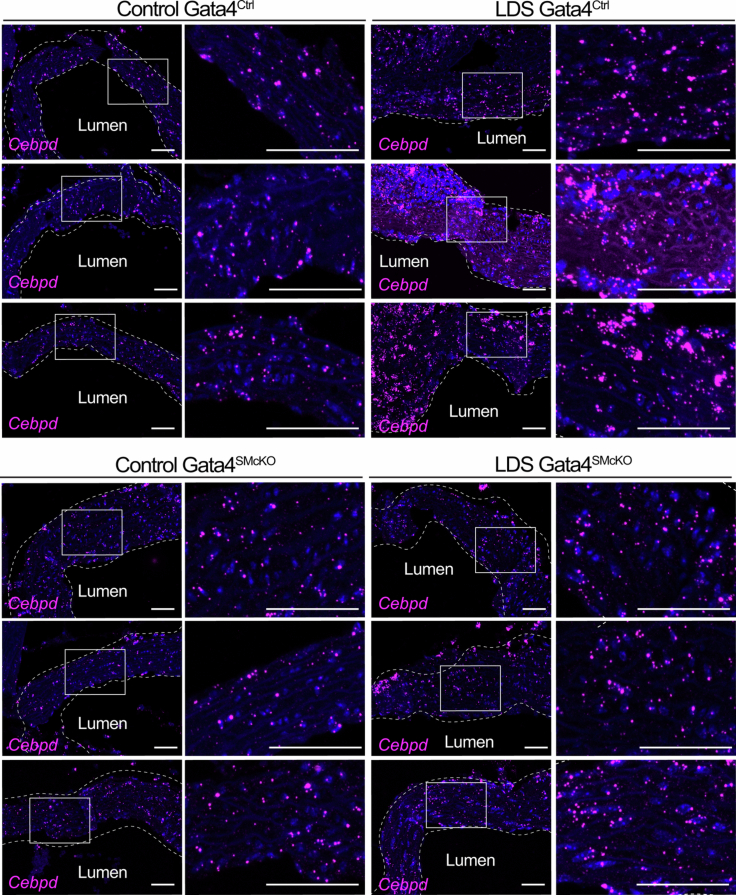
Loeys-Dietz syndrome (LDS) is a connective tissue disorder caused by mutations that decrease transforming growth factor-β signaling. LDS-causing mutations increase the risk of aneurysm throughout the arterial tree, yet the aortic root is a site of heightened susceptibility. Here we investigate the heterogeneity of vascular smooth muscle cells (VSMCs) in the aorta of Tgfbr1M318R/+ LDS mice by single-cell transcriptomics to identify molecular determinants of this vulnerability. Reduced expression of components of the extracellular matrix-receptor apparatus and upregulation of stress and inflammatory pathways were observed in all LDS VSMCs. However, regardless of genotype, a subset of Gata4-expressing VSMCs predominantly located in the aortic root intrinsically displayed a less differentiated, proinflammatory profile. A similar population was also identified among aortic VSMCs in a human single-cell RNA sequencing dataset. Postnatal VSMC-specific Gata4 deletion reduced aortic root dilation in LDS mice, suggesting that this factor sensitizes the aortic root to the effects of impaired transforming growth factor-β signaling.


Conflict of interest statement

Competing interests: The authors declare no competing interests.

Figures

Fig. 1
Fig. 1. Downregulation of transcripts associated with ECM–receptor interactions and upregulation of stress and inflammation pathways in Tgfbr1M318R/+ LDS VSMCs.
a, A UMAP of aortic cells from control (Tgfbr1+/+) and LDS (Tgfbr1M318R/+) mice. b, A dot plot of cluster-defining transcripts used to identify endothelial cells, leukocytes, fibroblasts and VSMCs. The color of the dot represents a scaled average expression, while the size indicates the percentage of cells in which the transcript was detected. c, A ClueGO analysis of terms enriched among transcripts up- and downregulated in LDS VSMCs relative to the controls (IGF, insulin growth factor; IGFBP, IGF binding protein; TCR, T cell receptor; NGF, nerve growth factor; and TSH; thyroid stimulating hormone). d, A ClueGO network, in which each node represents a term/pathway or individual gene associated with that term. The terms enriched among transcripts downregulated in LDS VSMCs are highlighted in blue, while those enriched among transcripts upregulated in LDS VSMCs are highlighted in red. The size of the node indicates significance of the enrichment calculated by the ClueGO algorithm. e, A network of selected transcripts significantly dysregulated in LDS VSMCs. The size of the node is proportional to the percent of LDS cells in which the transcript was detected. The scale indicates the average log2 fold change in expression in LDS VSMCs relative to control VSMCs. The transcripts in blue are decreased in LDS VSMCs, while those in red are increased. f,g, EnrichR gene over-representation analysis for the ENCODE and ChEA Consensus transcription factors (TF) library showing the top three most significant terms associated with transcripts that are downregulated (f) or upregulated (g) in LDS VSMCs. The P values (*) refer to the significance of enrichment.
Fig. 2
Fig. 2. MERFISH reveals spatially heterogeneous transcription profiles in LDS VSMCs.
a,b, MERFISH images of the proximal aorta of male LDS (a) and male control (b) mice at 16 weeks of age. Scale bars, 1 mm. The experiment was conducted once on one pair of age- and sex-matched samples. All the detected transcripts across the aortic tissue, with the key anatomic landmarks indicated, are displayed in a, top left. The depiction of the colocalization of Myh11 and the transcripts of interest are displayed in a, top middle, top right, bottom left, bottom middle and bottom right. The insets denote the regions of the ascending aorta and aortic root that are presented at higher magnification.
Fig. 3
Fig. 3. Transcriptionally and spatially defined VSMC subclusters with distinct responses to LDS-causing mutations can be identified in both murine and human aortas.
a, A UMAP of VSMCs from control (Tgfbr1+/+) and LDS (Tgfbr1M318R/+) mice shown split by genotype. b, A dot plot showing enrichment of cluster-defining transcripts in VSMC1 and VSMC2. For a given transcript, the color of the dot represents a scaled average expression, while the size indicates the percentage of cells in which it was detected. c, RNA in situ hybridization showing the expression of GATA4 along the length of the murine aorta in a 16-week-old control animal, representative of five independent biological replicates. Bottom: the insets identify the location shown at a higher magnification. The dashed line identifies the approximate boundaries of the aortic wall. Scale bars, 100 mm. d, A UMAP of control and LDS VSMCs from human patients and a dot plot of cluster-defining markers in this dataset split by aortic region (Pedroza et al.). e,f, A UMAP overlayed with weights for CoGAPS patterns 4 and 5, in mouse (e) and human (f) scRNA-seq datasets. g,h, Violin plots showing the distribution of pattern 4 and 5 weights in VSMC subclusters from mouse (g) and human (h) scRNA-seq datasets. The P values refer to Wilcoxon test. i, An EnrichR gene over-representation analysis for the ENCODE and ChEA Consensus transcription factor (TF) library showing the top four most significant terms associated with transcripts that define CoGAPS patterns 4 and 5. The P values (*) refer to the significance of enrichment. j, ClueGO network of terms differentially enriched in mouse and human LDS VSMC2 relative to VSMC1. The terms highlighted in blue are enriched in VSMC1, while those highlighted in red are enriched in VSMC2.
Fig. 4
Fig. 4. GATA4 mRNA and protein are upregulated in the aortic root of LDS mice.
a, An RNA in situ hybridization for Gata4 in the aortic root and ascending aorta of control and LDS (Tgfbr1M318R/+) male mice; the images are representative of five independent biological replicates. Bottom: the insets identify the location shown at higher magnification. Scale bars, 50 and 200 µm, respectively. b, Immunofluorescence for GATA4 in the aortic root and ascending aorta of control and LDS mice; the images are representative of five independent biological replicates. Bottom: the insets identify the location shown at higher magnification. Scale bars, 50 and 200 µm, respectively. The dashed line approximates the boundary of the aorta. c, An immunoblot for GATA4 expression relative to β-actin in aortic root lysates of control (n = 3 independent biological replicates), LDS mice (n = 3 independent biological replicates) and the related quantification of the immunoblot. The P value refers to a two-tailed Welch’s t-test (t = 6.32, d.f. = 2.43). Each symbol represents an independent biological replicate, and the bar graph shows the mean ± standard deviation. Source data
Fig. 5
Fig. 5. GATA4 protein is upregulated in LDS aortic root of GATA4Ctrl and effectively ablated in GATA4SMcKO mice.
The immunofluorescence for GATA4 in the aorta of male mice of the indicated genotype at 16 weeks of age is shown. Three independent biological replicates are shown per genotype, abbreviated as follows: control (Tgfbr1+/+) and LDS (Tgfbr1M318R/+) with (GATA4SMcKO) or without (GATA4Ctrl) smooth muscle specific deletion of GATA4. The insets identify the location shown at a higher magnification. The images were acquired at 20× magnification. Scale bars, 50 and 200 µm, respectively. The dashed line approximates the boundary of the aorta.
Fig. 6
Fig. 6. Smooth-muscle-specific deletion of GATA4 (GATA4SMcKO) reduces aortic root size and growth and improves aortic root media architecture in LDS mice.
a, Aortic root diameter of male control (Tgfbr1+/+) and LDS (Tgfbr1M318R/+) with (GATA4SMcKO) or without (GATA4Ctrl) smooth muscle specific deletion of GATA4, as measured by echocardiography at 8 and 16 weeks of age and aortic root growth from 8 to 16 weeks of age. The box plots show the upper quartile, median and lower quartile; each symbol represents an independent biological replicate. The whiskers identify the minimum to maximum range (control GATA4Ctrl n = 24; control GATA4SMcKO n = 28; LDS GATA4Ctrl n = 26; LDS GATA4SMcKO n = 16). The P values refer to Brown–Forsythe ANOVA (8 weeks: F* (F-statistic) = 25.98, DFn (degrees of freedom numerator) of 3, DFd (degrees of freedom denominator) of 66.69; 16 weeks: F* = 55.54, DFn of 3, DFd of 82.30; 8–16 weeks: F* = 33.39, DFn of 3, DFd of 78.63). b, VVG-stained aortic root sections from three independent biological replicates per genotype. The insets identify the area shown at a higher magnification. Scale bars, 50 and 200 µm, respectively.
Fig. 7
Fig. 7. Smooth muscle-specific deletion of GATA4 results in reduced expression of Agtr1a.
RNA in situ hybridization for Agtr1a in the aortic root of mice of the indicated genotype at 16 weeks of age. Three independent biological replicates are shown per genotype, abbreviated as follows: control (Tgfbr1+/+) and LDS (Tgfbr1M318R/+) with (GATA4SMcKO) or without (GATA4Ctrl) smooth-muscle-specific deletion of GATA4. The insets identify the location shown at a higher magnification. The images were acquired at 20× magnification. Scale bars, 50 and 200 µm, respectively. The dashed line approximates the boundary of the aorta.
Fig. 8
Fig. 8. Smooth-muscle-specific deletion of GATA4 results in reduced expression of Cebpb.
RNA in situ hybridization for Cebpb in the aortic root of mice of the indicated genotype at 16 weeks of age. Three independent biological replicates are shown per genotype, abbreviated as follows: control (Tgfbr1+/+) and LDS (Tgfbr1M318R/+) with (GATA4SMcKO) or without (GATA4Ctrl) smooth-muscle-specific deletion of GATA4. The insets identify the location shown at a higher magnification. The images were acquired at 20× magnification. Scale bars, 50 and 200 µm, respectively. The dashed line approximates the boundary of the aorta.
Extended Data Fig. 1
Extended Data Fig. 1. Quality control and filtering of scRNAseq of murine aorta.
ScRNAseq datasets from female control and Tgfbr1M318R/+ LDS mice were filtered by the number of transcripts per cell (nFeature), number of unique molecular identifiers per cell (nCounts), and the percent of reads from mitochondrial transcripts. Density plots showing the distribution of aortic cells from control and Tgfbr1M318R/+ LDS mice pre-filtering (a) and post-filtering (b) based on the following cutoffs which are indicated in the figure by horizontal bars: >1000 nFeature <5000, >1500 nCounts <25000, and <20% mitochondrial transcripts per cell. (c) UMAP of murine scRNAseq data split by mouse ID, showing the distribution of cells from each independent biological replicate (n = 6, 2 LDS and 4 control). Samples are labeled by genotype and the number of VSMCs per sample is indicated. A total of 4,226 LDS VSMCs and 6,149 control VSMCs were included in subsequent analyses.
Extended Data Fig. 2
Extended Data Fig. 2. Defective connections between smooth muscle cells and elastic lamellae in the aorta of LDS mice.
Electron micrographs of longitudinal sections of the aortic root and ascending aorta of control and LDS mice at 6 weeks of age. Elastic fibers are stained dark (E, elastic lamellae; SMC, smooth muscle cell). Arrows indicate examples of dense plaques, which mark connections between elastic lamellae and smooth muscle cells. Image representative of three independent biological replicates. Scale bar is 2 microns.
Extended Data Fig. 3
Extended Data Fig. 3. MERFISH reveals spatially heterogeneous expression of transcripts coding for Calponin-1, Immediate Early Response genes, and Kruppel-like Factor genes in LDS VSMCs.
MERFISH images of the proximal aorta of male LDS (a) and male control (b) mice at 16 weeks of age, scale bar is 1 mm. Experiment was conducted once on one pair of age and sex-matched samples. Scale bar is 1 mm. Panels depict the colocalization of Myh11 and transcripts of interest in the aorta of LDS (a) and control (b) mice. Insets denote regions of the ascending aorta and aortic root that are presented at higher magnification.
Extended Data Fig. 4
Extended Data Fig. 4. Expression of Gata4 transcript correlates with location along the proximal-to-distal axis in the mouse aorta.
RNA in situ hybridization showing the expression of Gata4 along the length of the murine aorta in 12-, 16- and 24-week-old control animals (three independent biological samples are shown; representative of two experiments showing similar results). Insets identify the location shown at higher magnification in the subsequent panel. The dashed line identifies the approximate boundaries of the aortic wall. Scale bar is 100 microns.
Extended Data Fig. 5
Extended Data Fig. 5. Gata4 mRNA and protein are upregulated in the aortic root of LDS mice.
(a) RNA in situ hybridization for Gata4 in the aortic root and ascending aorta of male control and LDS (Tgfbr1M318R/+) mice, representative of 5 independent biological replicates. Insets identify the location shown at higher magnification in the subsequent panel. Scale bar is 100 microns. (b) Immunofluorescence for Gata4 in the aortic root and ascending aorta of male control and LDS mice. Insets identify the location shown at higher magnification in the subsequent panel, representative of 4 independent biological replicates. Scale bar is 100 microns. The dashed line identifies the approximate boundaries of the aortic wall.
Extended Data Fig. 6
Extended Data Fig. 6. VSMC1 and VSMC2 subclusters correlate but do not overlap with lineage-of-origin.
(a) A subset of cells included in the analysis derived from mice carrying the Rosa26-flox-STOP-flox-EGFP-L10a transgene and a Cre recombinase expressed under the control of a CNC-specific Wnt2 promoter (Wnt2-Cre). Dot plot shows detection of the Gfp reporter in VSMC1 and VSMC2. The color of the dot represents a scaled average expression while the size indicates the percentage of cells in which Gfp was detected. (b) UMAP of SHF-traced and non-SHF traced VSMCs and dot plot showing the SHF and non-SHF, and therefore CNC, enriched transcripts from Pedroza et al., 2022 in VSMC1 and VSMC2. (c) Dot plot of VSMC1 and VSMC2 cluster defining transcripts in SHF-traced and non-traced VSMCs from Pedroza et al., 2022.
Extended Data Fig. 7
Extended Data Fig. 7. Quality control and filtering of scRNAseq of human aorta.
Published scRNAseq dataset of donor and LDS patient aortic cells (Pedroza et al., 2023) was re-analyzed and filtered by the number of transcripts per cell (nFeature), number of unique molecular identifiers per cell (nCounts), and the percent of reads from mitochondrial transcripts. Density plots show the distribution of aortic cells from donor and LDS patients from pre-filtering (a) and post-filtering (b) based on the following cutoffs which are indicated in the figure by horizontal bars: >1000 nFeature < 6000, > nCounts < 30000, and < 20% mitochondrial transcripts per cell.
Extended Data Fig. 8
Extended Data Fig. 8. VSMC2-defining transcripts are enriched in modulators of inflammation and cellular stress in both mouse and human aortas.
(a) EnrichR bar plot of the top four significantly enriched pathways in the MSigDB Hallmark 2020 database in LDS VSMC2 relative to LDS VSMC1 in both mouse and human datasets. P-values refer to significance of enrichment. (b) Network visualization of MSigDB VSMC2-enriched pathways and biological terms with shared ClueGO grouping. The color of term nodes identifies ClueGO biological grouping. Individual genes are colored by the Log2 fold change of expression in LDS VSMC2 relative to LDS VSMC1 (blue genes are downregulated while red genes are upregulated in VSMC2 relative to VSMC1) (c) Dot plot of transcripts involved in modulation of VSMC contractile and non-contractile phenotypes in VSMC1 and VSMC2 in the mouse and human scRNAseq datasets. Color of the dot represents a scaled average expression, while the size indicates the percentage of cells in which the transcript was detected.
Extended Data Fig. 9
Extended Data Fig. 9. Gata4 deletion does not affect size or growth of the ascending aorta or blood pressure in LDS mice.
(a) Ascending aortic diameter of male Ctrl (Tgfbr1+/+) and LDS (Tgfbr1M318R/+) mice with (Gata4SMcKO) or without (Gata4Ctrl) smooth muscle specific deletion of Gata4 as measured by echocardiography at 8 and 16 weeks of age, and aortic root growth from 8 to16 weeks of age. The box plots show the upper quartile, median and lower quartile; each symbol represents an independent biological replicate; whiskers identify the minimum to maximum range (Ctrl Gata4Ctrl n = 24; Ctrl Gata4SMcKO n = 28; LDS Gata4Ctrl n = 26; LDS Gata4SMcKO n = 16). No significant differences were detected (Brown-Forsythe ANOVA: 8 weeks F* = 0.31, DFn = 3, DFd = 52.88, P value = 0.8142; 16 weeks F* = 1.39, DFn = 3, DFd = 87.78, P value = 0.2491). (b) Systolic blood pressure and mean arterial pressure for male mice of the indicated genotypes. The box plots show the upper quartile, median and lower quartile; each symbol represents an independent biological replicate; whiskers identify the minimum to maximum range (Ctrl Gata4Ctrl n = 15; Ctrl Gata4SMcKO n = 23; LDS Gata4Ctrl n = 14; LDS Gata4SMcKO n = 8). No significant differences were detected (Brown-Forsythe ANOVA: Systolic pressure F* = 1.465, DFn= 3, DFd= 53.86, P value = 0.24; mean arterial F* = 1.055, DFn= 3, DFd= 38.74, P value = 0.379). Source data
Extended Data Fig. 10
Extended Data Fig. 10. Smooth muscle-specific deletion of Gata4 results in reduced expression of Cebpd.
RNA in situ hybridization for Cebpd in the aortic root of male mice of the indicated genotype at 16 weeks of age. Three independent biological replicates are shown per genotype, abbreviated as follows Control (Tgfbr1+/+) and LDS (Tgfbr1M318R/+) with (Gata4SMcKO) or without (Gata4Ctrl) smooth muscle specific deletion of Gata4. Insets identify location shown at higher magnification in subsequent panels. Images were acquired at 20x magnification. Scale bars are 50 and 200 microns, respectively. The dashed line identifies the approximate boundaries of the aortic wall.

Update of

References

    1. Chou, E., Pirruccello, J. P., Ellinor, P. T. & Lindsay, M. E. Genetics and mechanisms of thoracic aortic disease. Nat. Rev. Cardiol.20, 168–180 (2023). - PubMed
    1. MacCarrick, G. et al. Loeys–Dietz syndrome: a primer for diagnosis and management. Genet. Med.16, 576–587 (2014). - PMC - PubMed
    1. Loeys, B. L. et al. A syndrome of altered cardiovascular, craniofacial, neurocognitive and skeletal development caused by mutations in TGFBR1 or TGFBR2. Nat. Genet.37, 275–281 (2005). - PubMed
    1. van de Laar, I. M. et al. Mutations in SMAD3 cause a syndromic form of aortic aneurysms and dissections with early-onset osteoarthritis. Nat. Genet.43, 121–126 (2011). - PubMed
    1. Lindsay, M. E. et al. Loss-of-function mutations in TGFB2 cause a syndromic presentation of thoracic aortic aneurysm. Nat. Genet.44, 922–927 (2012). - PMC - PubMed

MeSH terms

Substances