. 2024 Nov;635(8039):699-707.
doi: 10.1038/s41586-024-07571-1. Epub 2024 Nov 20.

Single-cell integration reveals metaplasia in inflammatory gut diseases

Affiliations

Single-cell integration reveals metaplasia in inflammatory gut diseases

Amanda J Oliver et al. Nature. 2024 Nov.

Abstract

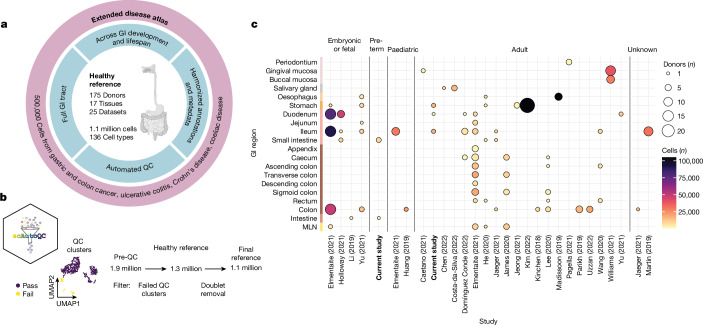
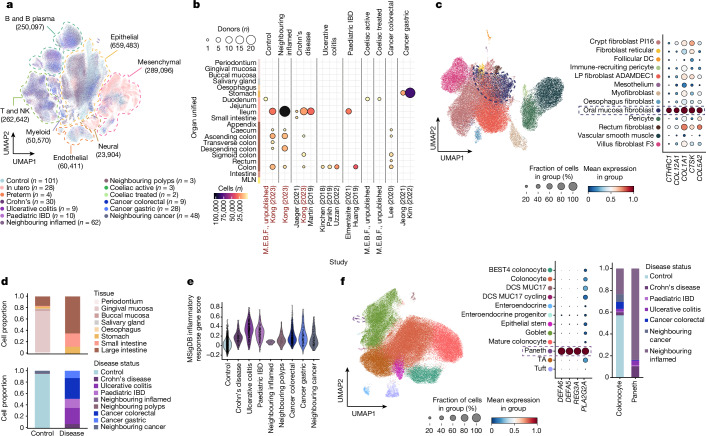
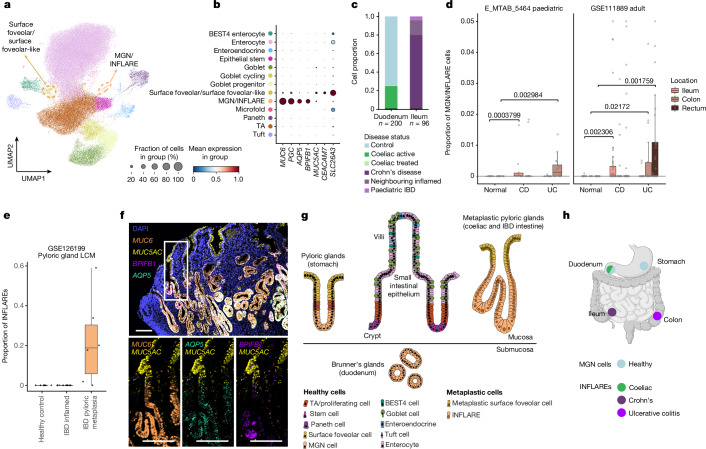
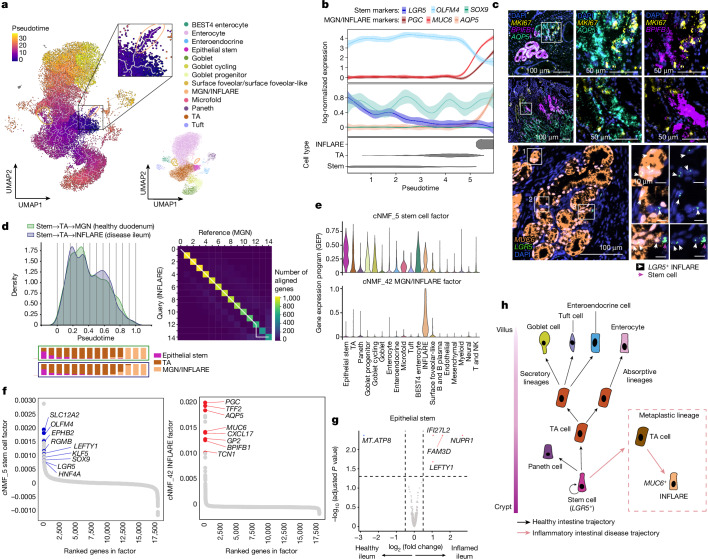
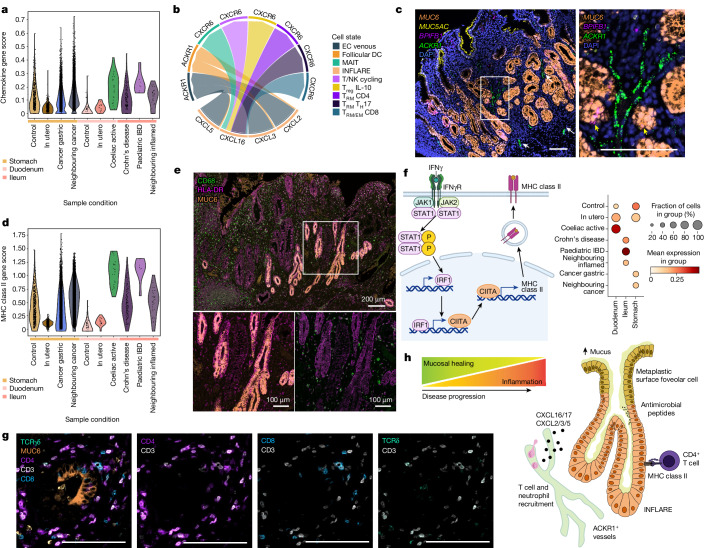
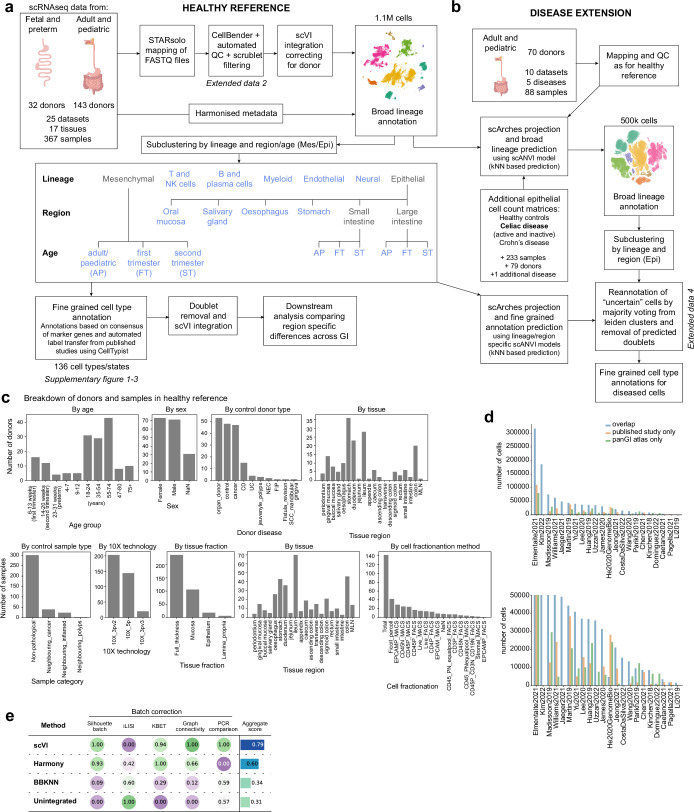
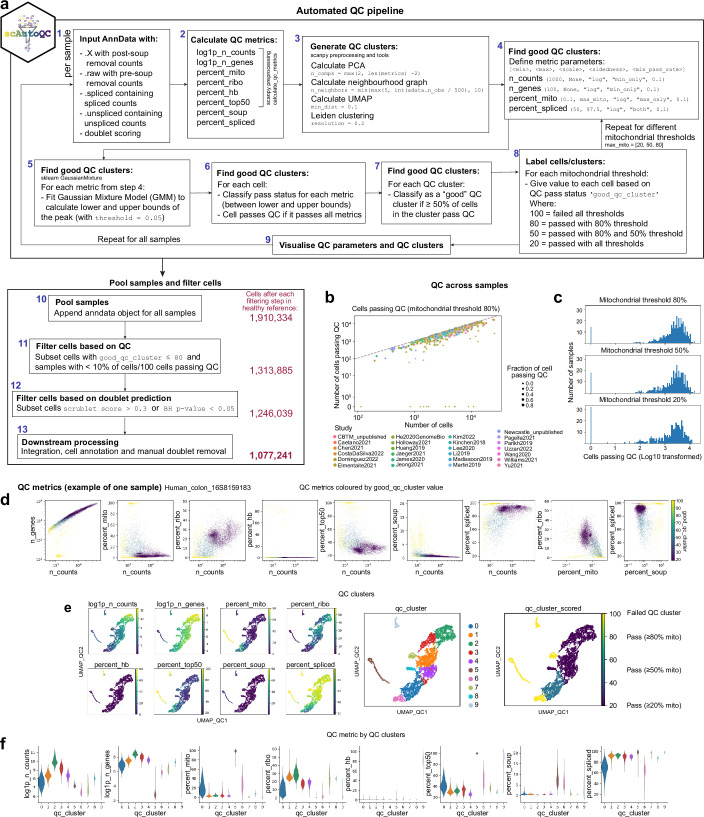
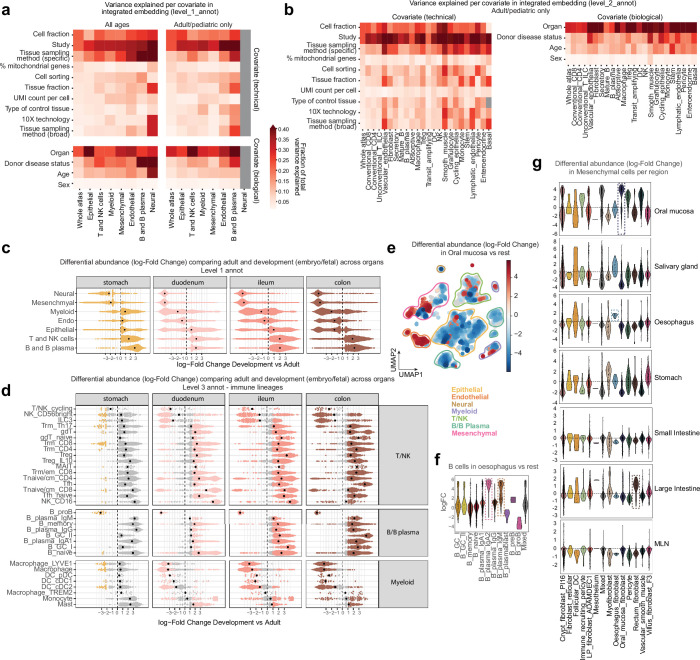
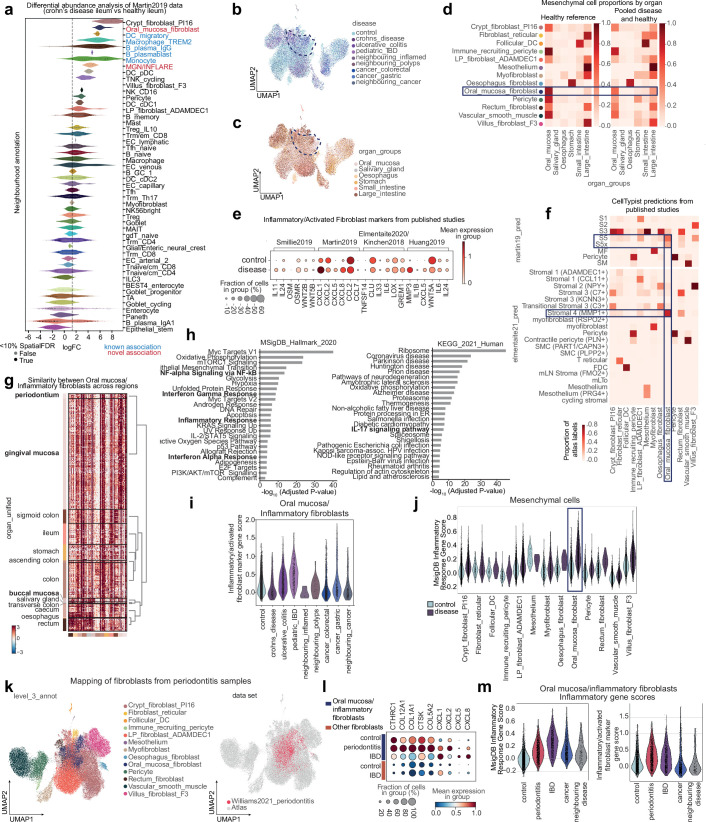
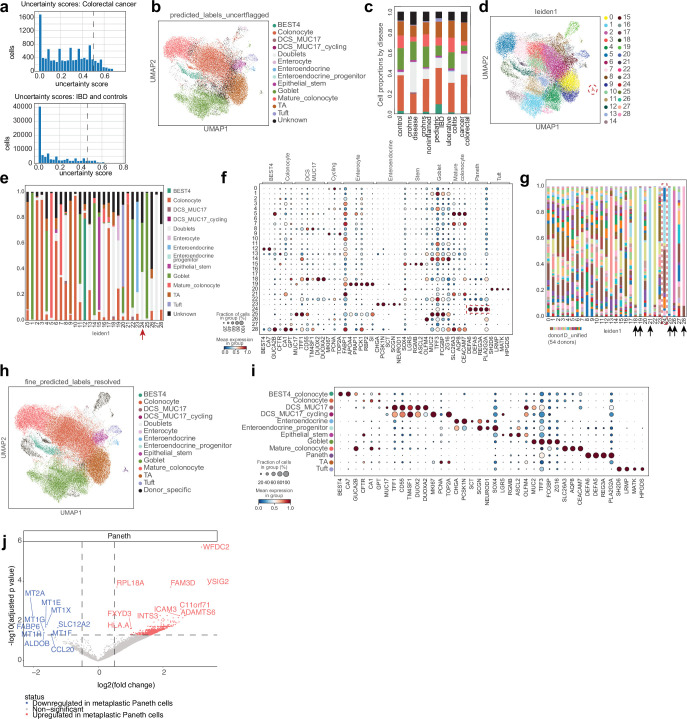
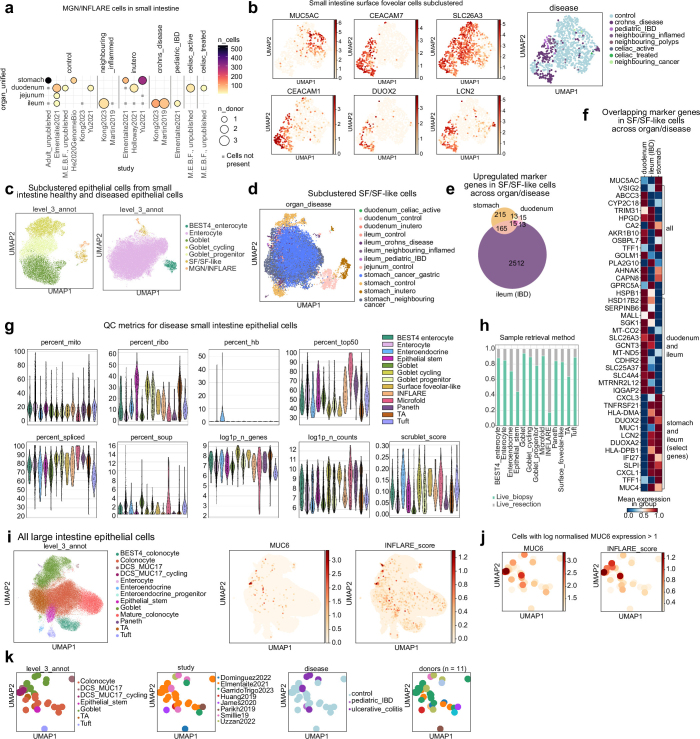
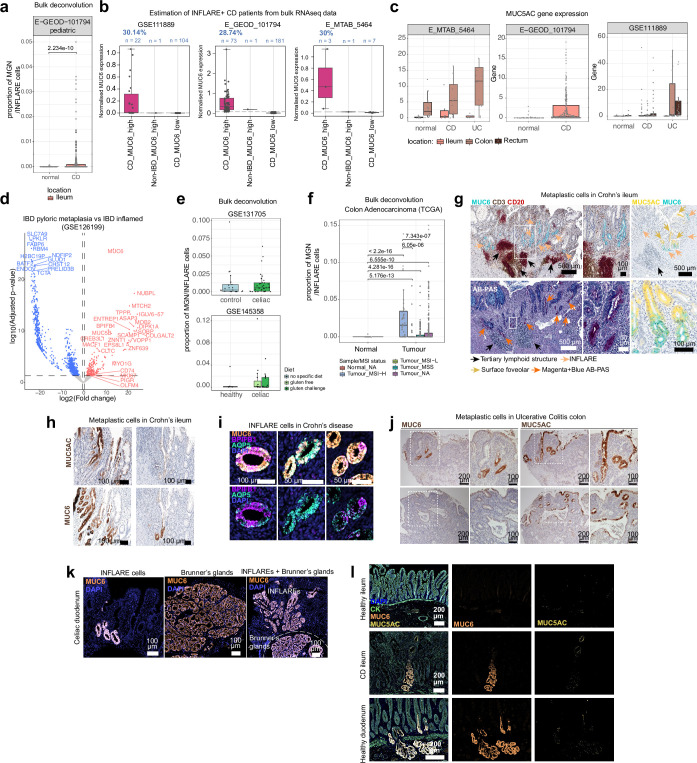
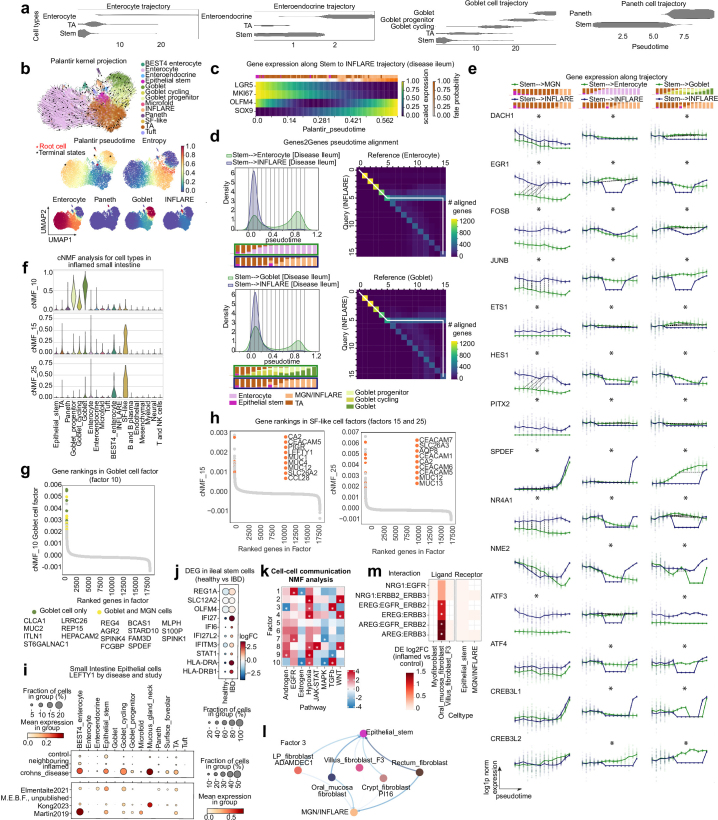
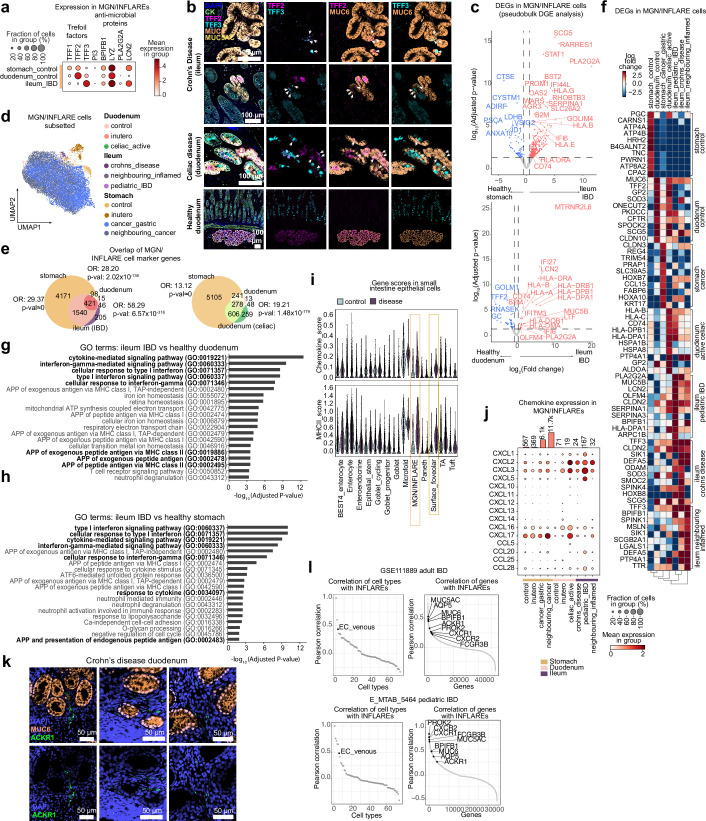
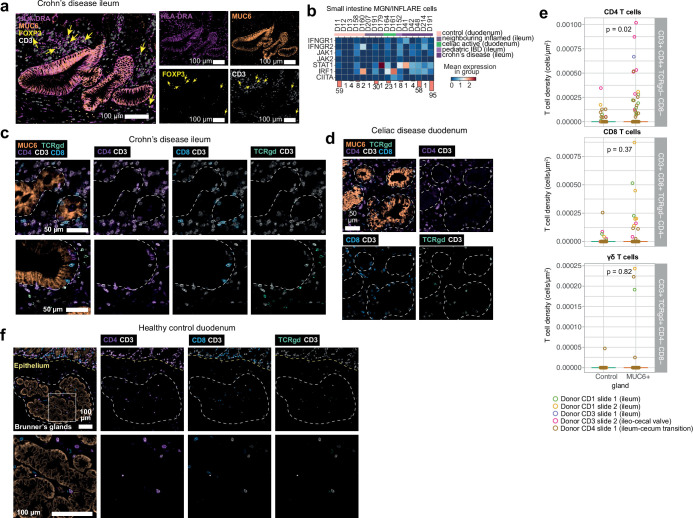
The gastrointestinal tract is a multi-organ system crucial for efficient nutrient uptake and barrier immunity. Advances in genomics and a surge in gastrointestinal diseases1,2 has fuelled efforts to catalogue cells constituting gastrointestinal tissues in health and disease3. Here we present systematic integration of 25 single-cell RNA sequencing datasets spanning the entire healthy gastrointestinal tract in development and in adulthood. We uniformly processed 385 samples from 189 healthy controls using a newly developed automated quality control approach (scAutoQC), leading to a healthy reference atlas with approximately 1.1 million cells and 136 fine-grained cell states. We anchor 12 gastrointestinal disease datasets spanning gastrointestinal cancers, coeliac disease, ulcerative colitis and Crohn's disease to this reference. Utilizing this 1.6 million cell resource (gutcellatlas.org), we discover epithelial cell metaplasia originating from stem cells in intestinal inflammatory diseases with transcriptional similarity to cells found in pyloric and Brunner's glands. Although previously linked to mucosal healing4, we now implicate pyloric gland metaplastic cells in inflammation through recruitment of immune cells including T cells and neutrophils. Overall, we describe inflammation-induced changes in stem cells that alter mucosal tissue architecture and promote further inflammation, a concept applicable to other tissues and diseases.


Conflict of interest statement

Competing interests: S.A.T. is a scientific advisory board member of ForeSite Labs, OMass Therapeutics, a co-founder and equity holder of TransitionBio and EnsoCell Therapeutics, a non-executive director of 10x Genomics and a part-time employee of GlaxoSmithKline. R.E. is an equity holder in EnsoCell. P.K. has consulted for AstraZeneca, UCB, Biomunex and Infinitopes. N.M.P reports consulting fees from Infinitopes. J.S.-R. reports funding from GSK, Pfizer and Sanofi and fees/honoraria from Travere Therapeutics, Stadapharm, Astex, Owkin, Pfizer, Moderna and Grunenthal. A.S. is the recipient of research grants from Roche-Genentech, Abbvie, GSK, Scipher Medicine, Pfizer, Alimentiv, Boehringer Ingelheim and Agomab and has received consulting fees from Genentech, GSK, Pfizer, HotSpot Therapeutics, Alimentiv, Agomab, Goodgut and Orikine. R.E. and S.A.T are inventors on the patent GB2412853.0 filed in the UK, some components of which are related to this work. All other authors declare no competing interests.

Figures

Fig. 1
Fig. 1. Overview of pan-gastrointestinal cell integration.
a, Schematic overview of the atlas denoting the healthy reference as a core, with additional disease datasets mapped by transfer learning. GI, gastrointestinal; QC, quality control. Schematic in panel a was created with BioRender (https://biorender.com). b, Overview of scAutoQC, an automated, unsupervised quality control approach to remove low-quality cells. UMAP, uniform manifold approximation and projection. c, Overview of the number of cells and donors per study, broken down by age and region of the gastrointestinal tract (y axis). The dot size indicates the number of donors, and the colour indicates the number of cells. The colours of the y axis indicate broad-level organs (oral mucosa, salivary gland, oesophagus, stomach, small intestine, large intestine and mesenteric lymph node (MLN)). Caetano (2021), ref. ; Chen (2022); ref. ; Costa-da-Silva (2022), ref. ; Domínguez Conde (2022), ref. ; Elmentaite (2021), ref. ; He (2020), ref. ; Holloway (2021), ref. ; Huang (2019), ref. ; Jaeger (2021), ref. ; James (2020), ref. ; Jeong (2021), ref. ; Kim (2022), ref. ; Kinchen (2018), ref. ; Lee (2020), ref. ; Li (2019), ref. ; Madissoon (2019), ref. ; Martin (2019), ref. ; Pagella (2021), ref. ; Parikh (2019), ref. ; Uzzan (2022), ref. ; Wang (2020), ref. ; Williams (2021), ref. ; Yu (2021), ref. .
Fig. 2
Fig. 2. Metaplastic cell lineages in IBD.
a, UMAP of joint healthy and disease atlas with cells coloured by disease category. n refers to the number of donors. The dashed lines indicate broad cell lineages, with cell numbers indicated in parentheses. b, Dotplot of extended disease data showing the number of cells (colour) and donors (dot size) per study and disease. Studies in red (M.E.B.F., unpublished and Kong (2023) (ref. )) were added to the atlas as count matrices. The colours of the y axis are the same as Fig. 1c. c, UMAP and marker gene dotplot of mesenchymal populations from healthy and diseased adult or paediatric tissue, with ‘oral mucosa fibroblasts’ outlined by dashed lines. DC, dendritic cell; LP, lamina propria. d, Barplots with proportions of oral mucosa fibroblasts or inflammatory fibroblasts in control (total n = 4,378 cells) and disease (total n = 2,403 cells) across gastrointestinal regions. e, Violin plot of the MSigDB inflammatory response gene score in oral mucosa or inflammatory fibroblasts across disease categories. The pathway is significant from gene set enrichment analysis comparing differential gene expressions between oral mucosa fibroblasts in healthy versus diseased samples (Extended Data Fig. 4h). f, UMAP (left) and marker gene dotplot (middle) of large intestinal epithelial cells from adult or paediatric healthy and diseased samples, highlighting metaplastic Paneth cells (dashed outline). A barplot (right) of cell proportions from control and disease of colonocytes versus Paneth cells is also shown. DCS, deep crypt secretory; TA, transit amplifying.
Fig. 3
Fig. 3. Identification of INFLAREs resembling pyloric or Brunner’s gland neck cells in health.
a, UMAP showing cells from the small intestinal epithelium in the full atlas (healthy and diseased). MGN or INFLARE and surface foveolar cells, both involved in pyloric metaplasia, are highlighted with a dashed circle. b, Marker gene dotplot of pyloric gland cell markers (MGN and surface foveolar cells). The cell type legend is shared in a and b. c, Proportion of MGN or INFLAREs by disease category in the duodenum and ileum. d, Bulk deconvolution (BayesPrism) using disease intestinal epithelium as a reference in studies of Crohn’s disease (CD) and ulcerative colitis (UC). For E_MTAB_5464, n = 25 (CD), 27 (UC) and 27 (normal). For GSE111889, n = 122 (CD), 71 (UC) and 50 (normal). Numbers above brackets represent P values calculated by two-sided Wilcoxon rank-sum test. e, Bulk deconvolution as in d from the laser capture microdissection (LCM) epithelium from healthy crypts (n = 7), inflamed crypts from patients with IBD (n = 6) and metaplastic glands from patients with IBD (n = 6). For both d and e, the lower edge, upper edge and centre of the box represent the 25th (Q1) percentile, 75th (Q3) percentile and the median, respectively. The interquartile range (IQR) is Q3 − Q1. Outliers are values beyond the whiskers (upper, Q3 + 1.5 × IQR; lower, Q1 − 1.5 × IQR). f, smFISH staining of MGN and INFLARE cell marker genes (MUC6, AQP5 and BPIFB1) and surface foveolar cell markers (MUC5AC) in a biopsy from the duodenum from a patient with Crohn’s disease and pyloric metaplasia. Representative images from n = 4. Scale bars, 100 µm. g, Organization of cells within the gastric glands in the stomach, small intestinal epithelium, Brunner’s glands and metaplastic pyloric glands. h, Schematic of MGN and INFLARE cell distribution across the stomach and intestines, defining MGN cells in the healthy stomach and duodenum and INFLAREs in the coeliac duodenum, Crohn’s disease ileum and ulcerative colitis colon. The schematic in panel h was created with BioRender (https://biorender.com).
Fig. 4
Fig. 4. INFLAREs originate from stem cells and retain stem-like properties.
a, UMAP of small intestinal epithelial cells coloured by pseudotime trajectory (Monocle3). Cells are from the ileum of inflamed IBD samples from studies,,. INFLAREs are highlighted using the inset, and the UMAP plot on the right indicates cell types. b, Expression of key genes along the stem → TA → INFLARE trajectory. The error bands correspond to the mean ± 95% CI of log-normalized gene expression. c, Proliferation (MKI67) and stemness (LGR5) gene expression by smFISH in INFLAREs (MUC6+) from the Crohn’s disease ileum and duodenum. Representative image from n = 4. d, Alignment of Palantir pseudotime trajectories (Extended Data Fig. 8b) for stem → TA → INFLARE (disease ileum) and stem → TA → MGN (healthy duodenum) using Genes2Genes. The cell density of the aligned trajectories, marked with 14 interpolation time bins, and the corresponding cell-type proportions of those bins as stacked barplots (left). The average alignment path (white line) of 1,171 transcription factors along the trajectories (right) is also shown. Each matrix cell of the heatmap gives the number of transcription factors with matched pseudotime points. e, Violin plots showing the expression of genes in factors from cNMF analysis related to MGN or INFLAREs and stem cells (LGR5+), across all small intestinal cells. f, Rankings of genes in factors 5 (stem cell factor) and 42 (MGN and INFLARE factor). The genes involved in stem cell function (blue) and MGN and INFLARE markers (red) are shown. g, Differential gene expression analysis comparing stem cells from control (n = 8) and IBD (n = 18) ileal pseudobulk samples. The genes with positive log2 fold change are upregulated in IBD compared with healthy samples, based on two-sided Wald test with Benjamini–Hochberg correction. h, Schematic of epithelial cell trajectories along the crypt–villus axis in the healthy small intestine (black arrows) and in inflammatory diseases (red arrows and dashed box), as hypothesized in our study.
Fig. 5
Fig. 5. INFLAREs recruit and interact with immune cells in IBD.
a, Gene score of chemokines across MGN and INFLAREs from the stomach, duodenum and ileum across different conditions. b, Cell–cell interactions mediated by CXCL chemokines expressed by INFLAREs and various immune cells or venous endothelial cells (ECs). MAIT, mucosal-associated invariant T cell; TEM, effector memory T cell; TH17, T helper 17 cell; Treg, regulatory T cell; TRM, tissue resident memory T cell. c, smFISH staining of INFLARE (MUC6 and BPIFB1), surface foveolar (MUC5AC) and activated endothelial (ACKR1) cells showing the proximity of vessels to metaplastic glands in Crohn’s disease duodenum. Representative image from n = 3. Scale bars, 100 µm. White arrows highlight ACKR1+ vessels, yellow arrows indicate BPIFB1+MUC6+ cells. For both images, the scale bar represents 100 μm. d, Gene score of MHC class II genes and peptide processing genes across MGN and INFLAREs from the stomach, duodenum and ileum across different conditions. e, Protein staining of INFLAREs (MUC6), macrophages (CD68) and MHC class II (HLA-DR) in the ileum from a Crohn’s disease resection showing high MHC class II expression in INFLAREs. Representative image from n = 2. f, Schematic of the signalling pathway from IFNγR to MHC class II (left), with a dotplot of gene scores from this pathway in MGN and INFLAREs from the stomach, duodenum and ileum across different conditions (right). Schematics in panel f were created with BioRender (https://biorender.com). g, Protein staining of INFLAREs (MUC6), CD4 T cells (CD3+CD4+), CD8 T cells (CD8+CD3+) and γδ T cells (TCRγδ+CD3+) in Crohn’s disease ileum, showing interaction between CD4 T cells and INFLAREs. Representative image from n = 4. Scale bars, 100 µm. h, Schematic of the potential role of pyloric metaplasia in inflammatory intestinal diseases. INFLAREs arise in response to local inflammation to promote mucosal healing via mucous and antimicrobial peptide secretion. As disease progresses, INFLAREs contribute to ongoing inflammation through association with activated vessels, the recruitment of various immune cells and direct interactions with CD4+ T cells via MHC class II.
Extended Data Fig. 1
Extended Data Fig. 1. Overview of atlas assembly.
a) Detailed flowchart of the methods used to assemble the healthy reference, datasets were remapped and filtered based on scAutoQC automated QC pipeline (Supplementary Fig. 2), integrated with scVI and annotated as broad lineages. Broad lineages were subclustered, and lineages with high level of heterogeneity (Epithelial and Mesenchymal lineages) were further subclustered based on age and/or region to accurately annotate at a fine-grained level. Cells in these subclustered views of the healthy reference were annotated by a semi-automated approach, taking into account the marker genes and CellTypist predictions from published studies. Schematic in panel a was created with BioRender (https://biorender.com). b) The healthy reference was used as an anchor to project disease datasets onto the atlas using scArches, fine-grained annotations were generated in a two-step approach, first with broad lineage prediction using scANVI and subclustering by lineage/region as with the healthy reference to predict the fine-grained annotations. Most disease data was remapped and QC’ed as with the healthy reference, except two additional studies from CD (Kong, 2023) and celiac disease (M.E.B.F., unpublished) which were added to the atlas from the published count matrices. c) Breakdown of the distribution of donors and samples in the healthy reference based on various metadata as specified. d) Overlapping and unique cells in our pan-GI atlas and the published studies (based on available count matrices). e) Benchmarking of batch correction across 3 integration methods for the healthy reference atlas versus the unintegrated atlas.
Extended Data Fig. 2
Extended Data Fig. 2. Overview of scAutoQC method.
a) Summary of the automated QC pipeline. Standard QC metrics are calculated and dimensions of 8 QC metrics (listed in step 2) are reduced, neighbours calculated and UMAP generated. Clusters from this UMAP are classified as “good” if ≥ 50% fall within upper and lower bounds (calculated by Gaussian Mixture Model) of 4 QC metrics (listed in step 4). Step 4–7 was repeated for 3 different mitochondrial thresholds (20%, 50%, 80%) and all steps were repeated for all samples. Finally samples are pooled, and cells within clusters that failed automated QC when mitochondrial threshold is 80%, and predicted as doublets (based on scrublet score calculated on a per sample basis) are removed before downstream processing. b) Plot of cells passing QC vs number of cells per sample across studies. Dotted line represents threshold for 100% of cells/sample passing QC. c) Histogram showing distribution of cells passing QC (log base 10) across the 3 mitochondrial thresholds. d-f) Example QC plots from one sample where d) is showing QC distribution of QC metrics where each data point is a cell, coloured by good_qc_cluster value (see step 8 of panel a). e) shows the QC UMAPs with the 8 QC metrics (listed in step 2 panel a), QC leiden clusters and good_qc_cluster value (see step 8 of panel a). f) violin plot of the 8 QC metrics (listed in step 2 of panel a) for each QC leiden cluster. In this sample for example, cluster 5 has failed QC because cells in this cluster have high % of mitochondrial reads, low genes and high percentage of genes expressed within the top 50 genes.
Extended Data Fig. 3
Extended Data Fig. 3. Analysis of cells within the healthy reference.
a) Analysis of metadata covariate contribution of variance in the integrated healthy reference embedding per cell type at broad level annotations (level_1_annot). b) Analysis of covariate contribution of variance per cell type at mid-level annotations (level_2_annot). c) Differential abundance analysis (Milopy) comparing broad level cell type (level_1_annot) abundance between adult/pediatric samples and developing samples (embryo, fetal and preterm), broken down by GI region with sufficient data for comparison. Each datapoint is a neighbourhood with positive log-fold change values indicating enrichment of lineage in adult/pediatric GI vs developing GI. d) Differential abundance analysis (Milopy) comparing fine-grained cell type/state (level_3_annot) abundance from immune lineages between adult/pediatric samples and developing samples (embryo, fetal and preterm), broken down by GI region. Each datapoint is a neighbourhood with positive log-fold change values indicating enrichment of cell type/state in adult/pediatric GI vs developing GI. Coloured data points are significantly enriched/depleted neighbourhoods. e) UMAP showing differential abundant neighbourhoods in the healthy reference comparing Oral mucosa to other organs throughout the GI tract in adult/pediatric samples. Positive log-fold change indicates enrichment of neighbourhoods in Oral mucosa. Coloured neighbourhoods show significant enrichment/depletion. f) Violin plot of B and B plasma cells showing enrichment of IgA2 and IgM plasma cells in oesophagus compared to other organs in the atlas. g) Differential abundance of Mesenchymal populations in adult/pediatric samples across each GI region compared to all others combined. Three tissue specific fibroblast populations were annotated, oral mucosa, oesophagus and rectum fibroblasts.
Extended Data Fig. 4
Extended Data Fig. 4. Inflammatory fibroblasts in disease share transcriptional similarity to homeostatic fibroblast population in the oral mucosa.
a) Differential abundance analysis of cell neighbourhoods from Martin et al. (2019) dataset based on embedding on the whole atlas. Cell neighbourhoods with positive log fold change are enriched in CD compared to healthy samples. b) UMAP of mesenchymal cells from adult/pediatric samples in health and disease, shown by disease category. Dashed line highlights the oral mucosa fibroblast cluster. c) UMAP of mesenchymal cells from adult/pediatric samples in health and disease, shown by organ. Dashed line highlights the oral mucosa fibroblast cluster. d) Proportion of mesenchymal cell types/states by organ in the healthy reference and combined healthy and disease. Oral mucosa fibroblasts appear in other organs in disease. e) Markers of inflammatory and activated fibroblasts from published studies showing expression in oral mucosa/inflammatory fibroblasts from controls (oral mucosa fibroblasts) and disease (inflammatory fibroblasts) samples. f) CellTypist predictions of cell annotations in mesenchymal populations from published studies, showing oral mucosa fibroblasts predicted to be inflammatory/activated fibroblast populations in both studies. g) Differential gene expression and hierarchical clustering of oral mucosa/Inflammatory fibroblasts from different regions. Oral mucosa fibroblasts from gingival mucosa and periodontium are most distinct from fibroblasts in other organs. h) Gene set enrichment analysis showing pathways (including various inflammatory pathways) enriched in inflammatory fibroblasts (disease) compared to oral mucosa fibroblasts (healthy). The adjusted p-values have been calculated using wilcoxon rank-sum test. i) Gene score for inflammatory/activated fibroblasts markers in (d) expressed in oral mucosa/inflammatory fibroblasts across disease conditions. j) MSigDB inflammatory response gene score (significantly enriched in inflammatory vs oral mucosa fibroblasts), across all mesenchymal cell types/states in control and disease samples. k) UMAP of mesenchymal populations from the atlas with the addition of fibroblasts from periodontitis data mapped onto the atlas using scArches and scANVI, coloured by level 3 annotation and highlighting the added data. LP = lamina propria. l) Dotplot showing expression of oral mucosa marker genes and inflammatory chemokines in oral mucosa/inflammatory fibroblasts in healthy tissue, periodontitis and IBD. Expression in other fibroblasts (combined population including crypt_fibroblast_PI16, LP_fibroblast_ADAMDEC1, oesophagus fibroblast, rectum fibroblast and villus_fibroblast_F3) from control and IBD shown for comparison. m) Inflammatory gene scoring in oral mucosa/inflammatory fibroblasts across disease conditions, as in Fig. 2e and Extended Data Fig. 4i,j.
Extended Data Fig. 5
Extended Data Fig. 5. Identification of metaplastic Paneth cells in diseased large intestine.
a-i) Example workflow to finalise transferred annotations from scANVI/weighted kNN trainer for large intestine epithelial cells in disease. a) Distribution of uncertainty scores in disease data from large intestine epithelial cells from cancer and non-cancer. Dashed line indicates the 90th percentile cut off, where cells with an uncertainty score above this are classified as “unknown”. b) UMAP of large intestine epithelial cells with predicted annotations and unknown cells flagged. DCS = deep crypt secretory cells. c) Proportions of predicted large intestine epithelial cell annotations (colours as in b) including unknown cells by disease. d) UMAP of large intestine epithelial cells with leiden clustering at resolution = 1, used to reclassify unknown cells based on majority voting. e) Proportions of predicted large intestine epithelial cell annotations by leiden cluster. Red arrow points to cluster 24, which was reannotated to Paneth cells but originally annotated as a combination of goblet cells, doublets and unknown cells. f) Marker gene dot plot of large intestine epithelial cells and Paneth cells by leiden cluster. Paneth cell markers are highlighted for cluster 24. g) Proportions of cells in each leiden by donor. Black arrows highlight clusters dominated by cells from only one donor (excluded from the atlas), and red arrow highlights cluster 24 which contains metaplastic Paneth cells. h) UMAP of reannotated large intestine epithelial cells from disease, including metaplastic Paneth cells. i) Marker gene dot plot for reannotated cell types in large intestine epithelial cells from disease. j) Pseudobulk (decoupler) and differential gene expression analysis (DESeq2) comparing Paneth cells from inflamed small intestine (n = 27) and metaplastic Paneth cells from inflamed large intestine (n = 9). Genes with a positive log2FC are upregulated in metaplastic Paneth cells compared to native small intestine Paneth cells, based on two-sided Wald test with Benjamini and Hochberg correction.
Extended Data Fig. 6
Extended Data Fig. 6. Identification of INFLAREs.
a) Overview of the number of MGN (Mucous gland neck)/INFLAREs (Inflammatory Epithelial cells) and donors per study, broken down by age and region of the GI. Dot size indicates the number of donors, colour indicates the number of cells. b) UMAP of subclustered surface foveolar (SF) cells from small intestine, showing heterogeneity of marker genes and additional genes upregulated in disease cells annotated as SF cells (SF-like cells). c) UMAP of subclustered INFLAREs, SF/SF-like cells and either goblet or enterocyte populations, showing distinct separation of populations highlighting transcriptional differences. d) UMAP of subclustered SF and SF-like cells across the atlas, coloured by age, region and disease status. e) Overlap of SF/SF-like marker genes from different regions. Marker genes of SF/SF-like cells were calculated by differential gene expression (wilcoxon rank-sum test) of other stomach and small intestine epithelial cells separately for healthy adult stomach SF cells, healthy adult duodenum SF cells and ileum CD SF-like cells showing overlapping marker genes. f) Heatmap of overlapping marker genes calculated in (e) (with MUC5AC for reference) showing overlapping genes across all comparisons, healthy duodenum and CD ileum, and selected genes of the 165 overlapping in healthy stomach and CD ileum. g) Violin plot for QC metrics across epithelial cell subsets from diseased samples (mito = mitochondria, ribo = ribosomal, hb = haemoglobin). h) Stacked barplot for sample retrieval method for cells in disease small intestinal samples, highlighting that the majority of INFLAREs come from resections rather than biopsies. i) UMAP of epithelial cells from large intestine, with added data from studies, (totalling an additional 209,347 cells from 23 control, 24 CD and 23 UC patients) coloured by cell type, MUC6 gene expression and gene score for INFLARE markers (MUC6, BPIFB1, AQP5, PGC). j) Cells from (i) filtered by log-normalised MUC6 expression greater than 1, coloured by MUC6 gene expression and INFLARE marker score. k) Cells from (j) coloured by cell type, study, disease and donor.
Extended Data Fig. 7
Extended Data Fig. 7. Validation of INFLAREs.
a) Deconvolution (BayesPrism) of bulk RNAseq dataset comparing MGN and INFLAREs in healthy (normal, n = 50) and CD (n = 254). Statistical analysis was performed using two-sided Wilcoxon rank-sum test. b) Estimation of CD patients with INFLAREs based on stratification of high and low MUC6 expressing samples from the bulk datasets indicated, showing ~29% of patients have high MUC6 expression. c) Expression of MUC5AC from bulk datasets indicated comparing expression in controls, CD and UC patients. d) Differential gene expression analysis (DESeq2) from laser capture microdissected epithelium from healthy crypts (n = 7), inflamed crypts from IBD patients (n = 6) and metaplastic glands from IBD patients (n = 6) from published data (GSE126199). Genes with a log2FC greater than 0 are upregulated in metaplastic glands compared to inflamed IBD epithelium, based on two-sided Wald test with Benjamini and Hochberg correction. e) Deconvolution (BayesPrism) of bulk RNAseq from celiac disease comparing MGN and INFLARE proportions in healthy and celiac disease tissue. For GSE131705, n = 21 (healthy) and n = 33 (celiac). For GSE145358, n = 6 (healthy), n = 15 (celiac gluten free) and n = 15 (celiac gluten challenge). f) Deconvolution (BayesPrism) of TCGA bulk RNAseq data of MGN and INFLAREs in healthy tissue (normal, n = 41) and tumour tissue stratified by microinstability status, n = 40 (Tumour_MSI-H), n = 42 (Tumour_MSI-L), n = 126 (Tumour_MSS) and n = 272 (Tumour_NA). MSI-high tumours are predicted to have higher levels of INFLAREs. Statistical analysis was performed using two-sided Wilcoxon rank-sum test. For all box and whisker plots the lower edge, upper edge and centre of the box represent the 25th (Q1) percentile, 75th (Q3) percentile and the median, respectively. The interquartile range (IQR) is Q3 - Q1. Outliers are values beyond the whiskers (upper, Q3 + 1.5 x IQR; lower, Q1 − 1.5 x IQR). g) Protein and ABPAS (Alcian Blue Periodic acid-Schiff) staining of INFLAREs (MUC6, Magenta+Blue+ ABPAS staining) and metaplastic surface foveolar cells (MUC5AC) in CD ileum showing association with tertiary lymphoid structures (dense nuclei and CD3/CD20+ regions). Selected regions adjacent to lymphoid structures from n = 2 (CD3, CD20, MUC6 staining), n = 2 (AB-PAS staining) and n = 2 (MUC5AC, MUC6 staining). h) Protein staining of INFLAREs (MUC6) and metaplastic surface foveolar cells (MUC5AC) from CD ileum tissue from additional donors (n = 3). i) smFISH staining of INFLARE (Inflammatory Epithelial cell) markers (MUC6, AQP5 and BPIFB1) in pyloric metaplasia of CD duodenum showing heterogeneity in AQP5 and BPIFB1 expression (n = 4). j) Protein staining of INFLAREs (MUC6) and metaplastic surface foveolar cells (MUC5AC) in colon resection tissue from UC patients (n = 3). Upper and lower panels are images from two different patients. k) Protein staining of MGN and INFLAREs (MUC6) in celiac disease duodenum showing INFLAREs and healthy MGN cells in Brunner’s gland in the submucosa (n = 2). l) Protein staining of MUC6, MUC5AC and cytokeratin (CK) in healthy ileum (n = 4), CD ileum (n = 4) and healthy duodenum (n = 2). All images show representative staining from the replicates indicated.
Extended Data Fig. 8
Extended Data Fig. 8. Origins and stem-like features of INFLAREs.
a) Relative cell proportions along healthy trajectories as calculated by Monocle3, to give confidence in the reconstruction of known trajectories. b) Palantir trajectory analysis from remapped studies, showing CellRank kernel projection and pseudotime of 4 terminal cell states in inflamed ileum. c) Scaled expression of stem markers as in Fig. 4b in the Palantir pseudotime trajectory for INFLAREs. d) Genes2Genes alignment of Palantir pseudotime trajectories for stem → INFLARE compared with stem → enterocyte and stem → goblet in inflamed ileum. Left: Cell density plots of the aligned trajectories along pseudotime, marked with 15 interpolation time points (bins) used for each alignment, and the corresponding cell-type proportions of those bins as stacked bar plots for each comparison. Right: Overall average alignment paths (highlighted in white) of the 1262 transcription factors between the interpolation pseudotime points along the trajectories for both comparisons. Each matrix cell of the pairwise heatmap gives the number of TFs where the corresponding pseudotime points have been matched. e) Mismatched genes (alignment similarity ≤ 50% and optimal alignment cost ≥ 30 nits) in INFLARE compared to control trajectories as indicated, showing their pseudotime alignments in (d) and Fig. 4d using Genes2Genes. Bold lines represent mean expression trends and faded data points are 50 random samples from the estimated expression distribution at each time point. The black dashed lines visualise matches between time points. Asterix indicates significant mismatch in gene alignment (as outlined above) for the specific gene/trajectory comparison. f) cNMF analysis (Methods) of cell types from IBD small intestine in the atlas. Violin plots showing expression of ranked genes in factors related to SF-like cells and goblet cells. g) Gene rankings of genes in factor 10 (goblet cell factor) with goblet cell specific genes highlighted in green and those also expressed in Mucous gland cells (MGN and INFLARE and SF-like cells) highlighted in yellow. h) Gene rankings of genes in factors 15 and 25 (SF-like cell factors) with select genes highlighted. i) Dotplot of LEFTY1 expression in small intestine epithelial cells across cell types and conditions (upper) and across cell types and study (lower). j) Dot plot of selected differential expressed genes (wilcoxon rank-sum test) in epithelial stem cells (LGR5+) from the ileum of patients with IBD compared with healthy controls. k) NMF factors from cell-cell communication analysis using ligand/receptor mean expression and cell type pairs to determine factors. Heatplot shows the expression of ligand/receptor pairs categorised into pathways for each factor. l) Connectivity of high ranking cell types in factor 3, showing interactions between fibroblasts (sources) and epithelial stem cells or INFLAREs (targets). Line thickness indicates a higher number of ligand/receptor pairs per cell type pairing. m) Expression (log2FC from DESeq2) comparing ligand and receptor expression in healthy controls vs IBD samples in relevant cell types from (l) for ligands and receptors within the NRG1/AREG/EREG pathway. Positive log2FC indicates upregulation of ligand/receptor expression in IBD compared to healthy controls.
Extended Data Fig. 9
Extended Data Fig. 9. Dual role of pyloric metaplasia in mucosal healing and inflammation.
a) Expression of genes related to mucosal barrier function in MGN (Mucous gland neck)/INFLAREs (Inflammatory Epithelial cells) in healthy stomach, healthy duodenum and IBD ileum. b) Protein staining of TFF2, TFF3, MUC6 (MGN and INFLARE), MUC5AC (surface foveolar) and cytokeratin (CK) across from CD ileum (n = 4), celiac duodenum (n = 2) and healthy proximal duodenum (n = 2). White arrows indicate MUC6 + TFF3+ cells. c) Pseudobulk (decoupler) and differential gene expression analysis (DESeq2) comparing INFLAREs from IBD ileum (n = 4 pseudobulk samples) with MGN from healthy stomach (n = 35) or healthy duodenum (n = 5) with INFLAREs from IBD ileum. Genes with positive log2FC are upregulated in INFLAREs compared with healthy cells, based on two-sided Wald test with Benjamini and Hochberg correction. d) Subclustered MGN and INFLAREs from across the atlas (locations, ages and diseases). MGN and INFLAREs from different regions and/or developmental stages (ie. in utero) occupy separate coordinates in the UMAP. e) Overlap of MGN and INFLARE marker genes from different regions. Marker genes of MGN and INFLAREs were calculated by differential gene expression (wilcoxon rank-sum test) of other stomach and small intestine epithelial cells separately for healthy adult stomach MGN, healthy adult duodenum MGN, ileum CD INFLARE and duodenum celiac disease INFLARE. Overlapping marker genes show greater similarity of INFLAREs to healthy adult stomach MGN cells, than to healthy adult duodenum MGN cells. f) Heatmap of differentially expressed genes (wilcoxon rank-sum test) in MGN and INFLAREs across healthy and diseased adult conditions. Stomach control is combined control and neighbouring cancer stomach MGN cells. g) GO terms from upregulated genes (wilcoxon rank-sum test) in IBD INFLAREs (CD and pediatric IBD) compared with healthy control duodenum. Highlighted pathways are inflammatory, MHC-II mediated antigen presentation and exogenous peptide antigen presentation related pathways. h) Analysis as in (g) comparing IBD INFLAREs to healthy control stomach. i) Chemokine and MHC-II gene scores (see Supplementary Table 5 for gene list) comparing small intestine epithelial cells in the atlas in healthy control and disease (IBD and celiac) samples showing specificity of upregulated chemokine and MHC-II related gene expression in particularly in INFLAREs vs MGN cells. j) Expression of chemokines in MGN and INFLAREs, across healthy and diseased tissues. k) Additional smFISH staining (as in Fig. 5c, representative from n = 3) of INFLAREs (MUC6) association with ACKR1+ vessel in CD duodenum. l) Correlation between INFLARE cell proportions and cell types/genes from deconvolution (BayesPrism) of bulk RNAseq adult and pediatric IBD datasets using the atlas as a reference. Analysis indicates consistent correlation of EC_venous cells (ACKR1+ endothelial population) with INFLAREs, and metaplastic surface foveolar and neutrophil marker genes with INFLAREs.
Extended Data Fig. 10
Extended Data Fig. 10. INFLARE:T cell interactions.
a) Protein expression in CD ileum (representative of n = 2) of HLA-DR (MHC-II) in INFLAREs (MUC6) along with localisation of CD3+ T cells and regulatory T cells (FoxP3+CD3+). b) Expression per donor of genes involved in IFNGR to MHC-II signalling pathway in INFLAREs and MGN cells in small intestine, as summarised in Fig. 5f. c) Additional protein staining for INFLAREs (MUC6) in CD disease ileum (as in Fig. 5g, n = 4) with various T cell subsets (CD4+CD3+, CD8+CD3+, TCRγδ+CD3+T cells). d) Protein staining as in (c) in Celiac disease duodenum tissue (n = 2). e) Quantitation of T cell densities for the T cell subsets indicated in MUC6+ glands and adjacent control epithelium across 5 sections from 3 donors as represented in (c). P-values calculated based on ROIs as replicates (n = 126 MUC6+ ROIs and 59 adjacent control ROIs) using negative binomial linear regression, adjusting for log area, two-sided Wald test. f) Protein staining as in (c) and (d) in healthy proximal duodenum (n = 2) showing abundance and localisation of T cell subsets in Brunner’s glands.

References

    1. Morgan, E. et al. Global burden of colorectal cancer in 2020 and 2040: incidence and mortality estimates from GLOBOCAN. Gut72, 338–344 (2023). - PubMed
    1. Jairath, V. & Feagan, B. G. Global burden of inflammatory bowel disease. Lancet Gastroenterol. Hepatol.5, 2–3 (2020). - PubMed
    1. Zilbauer, M. et al. A roadmap for the human gut cell atlas. Nat. Rev. Gastroenterol. Hepatol.10.1038/s41575-023-00784-1 (2023). - PMC - PubMed
    1. Goldenring, J. R. Pyloric metaplasia, pseudopyloric metaplasia, ulcer-associated cell lineage and spasmolytic polypeptide-expressing metaplasia: reparative lineages in the gastrointestinal mucosa. J. Pathol.245, 132–137 (2018). - PMC - PubMed
    1. Elmentaite, R. et al. Cells of the human intestinal tract mapped across space and time. Nature597, 250–255 (2021). - PMC - PubMed

MeSH terms

LinkOut - more resources