. 2024 Nov;635(8039):708-718.
doi: 10.1038/s41586-024-07944-6. Epub 2024 Nov 20.

A spatial human thymus cell atlas mapped to a continuous tissue axis

Affiliations

A spatial human thymus cell atlas mapped to a continuous tissue axis

Nadav Yayon et al. Nature. 2024 Nov.

Abstract

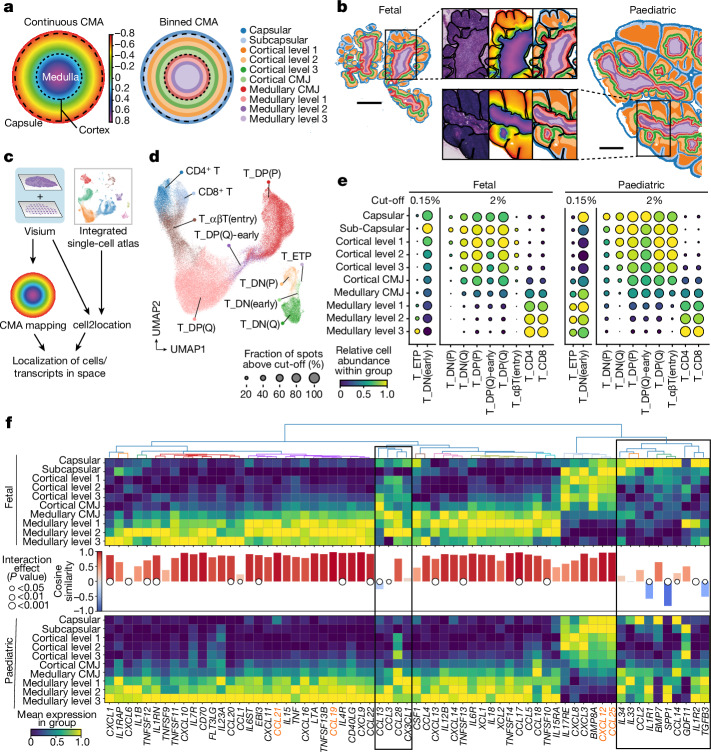
T cells develop from circulating precursor cells, which enter the thymus and migrate through specialized subcompartments that support their maturation and selection1. In humans, this process starts in early fetal development and is highly active until thymic involution in adolescence. To map the microanatomical underpinnings of this process in pre- and early postnatal stages, we established a quantitative morphological framework for the thymus-the Cortico-Medullary Axis-and used it to perform a spatially resolved analysis. Here, by applying this framework to a curated multimodal single-cell atlas, spatial transcriptomics and high-resolution multiplex imaging data, we demonstrate establishment of the lobular cytokine network, canonical thymocyte trajectories and thymic epithelial cell distributions by the beginning of the the second trimester of fetal development. We pinpoint tissue niches of thymic epithelial cell progenitors and distinct subtypes associated with Hassall's corpuscles and identify divergence in the timing of medullary entry between CD4 and CD8 T cell lineages. These findings provide a basis for a detailed understanding of T lymphocyte development and are complemented with a holistic toolkit for cross-platform imaging data analysis, annotation and OrganAxis construction (TissueTag), which can be applied to any tissue.


Conflict of interest statement

Competing interests: J.C.M. has been an employee of Genentech since September 2022. S.A.T. is a scientific advisory board member of ForeSite Labs, OMass Therapeutics, Qiagen, a co-founder and equity holder of TransitionBio and EnsoCell Therapeutics, a non-executive director of 10x Genomics and a part-time employee of GlaxoSmithKline. The other authors declare no competing interests.

Figures

Fig. 1
Fig. 1. Human thymus spatial atlas data composition and methodology.
a, Schematic of the combined use of spatial and dissociated datasets. b, The proportional contributions of different studies to main cell types and age groups, n = 29 donors. HTSA, human thymus spatial atlas. c, The composition of dissociated and spatial datasets containing both newly generated and previously published data spanning fetal and early paediatric human life. Each dot represents a sample and the stacked dots within a technology panel represent samples from the same donor. The dot colour indicates data source. Further information is provided in Supplementary Tables 1 and 2 and Extended Data Fig. 1a. d, Representative H&E image of a paediatric thymus (7 days old) showing the major anatomical compartments. Scale bar, 0.5 mm. e, Overview of the functionalities available in the TissueTag software. Details of histology annotations and derivation of the OrganAxis framework are provided in Supplementary Notes 1 and 2. Source Data
Fig. 2
Fig. 2. Multimodal data integration using tissue landmarks and a continuous CMA CCF.
a, Representative H&E sections (left) of fetal (p.c.w. 15) and paediatric (3 months old) Visium data, and virtual H&E for paediatric IBEX (7 days old). Corresponding discrete annotations (right) curated with TissueTag for cortex, medulla, edge (capsule + septa), tissue artefacts and fetal thymus-associated lymphoid aggregates (TALA). b, Illustration of the CMA derivation. P, spot in space. Details of OrganAxis construction are provided in Supplementary Note 2. c, CMA mapping for sections shown in a and a magnified region with the corresponding (virtual) H&E image. Axis parameters: r = 15 μm, K = 10. d, Batch-corrected UMAP embeddings of all Visium and IBEX samples in the study coloured by tissue annotations presented in a. Each dot corresponds to a Visium spot or IBEX cell. The total numbers of spots or cells, detected genes or markers and samples per dataset are indicated. e, UMAP embedding from d coloured according to CMA values. f, The contributions of CMA, technical factor (number of genes per spot or total signal per cell) and other sources of variability to the cumulative variance explained by first ten PCs in each spatial dataset: fetal Visium (12 samples), paediatric Visium (16 samples) and paediatric IBEX (8 samples). For a and c, scale bars, 1 mm. Source Data
Fig. 3
Fig. 3. CMA mapping of fetal and paediatric thymocytes reveals early establishment of T-lineage trajectories and cytokine landscape.
a, Schematic of the continuous CMA and the binned representation. b, Binned CMA space on fetal (p.c.w. 15) and paediatric (3 months) Visium sections with magnified regions showing H&E, continuous CMA and binned CMA (from left to right). Scale bars, 1 mm. c, Schematic of the analysis workflow: Visium spots are mapped to the CMA and deconvolved using the integrated fetal and paediatric scRNA-seq atlas. d, UMAP embedding of the main stages of developing αβ T lineage cells in fetal and paediatric scRNA-seq. Annotation of all T-lineage cells is provided in Supplementary Note 4. e, Binned CMA mapping of the main αβ T lineage differentiation stages for fetal and paediatric Visium. The cut-off indicates the minimum abundance threshold for inclusion of a Visium spot. The rare ETP and DN(early) stages were plotted with an adjusted cut-off to aid visualization. f, Spatial pattern of chemokine/cytokine transcripts across CMA bins derived from Visium data. Cytokines are clustered according to their spatial pattern in the fetal thymus. The bars indicate the cosine similarity between fetal and paediatric spatial gene expression patterns and the dots show an interaction effect between CMA bin and age-group. P values were calculated using two-way ANOVA with Bonferroni correction. Cytokines/chemokines that are critical for thymocyte migration are highlighted in orange. The boxes indicate clustered genes that diverge between ages. Source Data
Fig. 4
Fig. 4. CMA mapping pinpoints divergence in progenitor TEC localization across development.
a, UMAP embedding of integrated fetal and paediatric scRNA-seq data for TECs coloured by cell type. b, TEC marker gene expression according to scRNA-seq data. The bars indicate the total number of cells per cell type. c, The relative TEC distribution and enrichment in CMA bins based on Visium spot deconvolution. The boxes highlight mcTECs. Proliferating mcTECs were found only in fetal thymus and cTECIII was exclusively detected in paediatric data. The cut-off levels indicate the minimum cell abundance threshold for inclusion of a Visium spot. d, Schematic of the annotation workflow of segmented IBEX nuclei based on matching to the paediatric scRNA-seq reference. e, The spatial distribution patterns of TEC subsets in IBEX data. The dot size represents the relative abundance and the colour depicts the local enrichments in the CMA bin. KNN indicates the cut-off for the percentage of KNNs that correspond to the eventually assigned majority cell type agreement (Methods). f, IBEX images from 7-day-old male thymus (IBEX_02) showing expression of five different keratins. Images are representative of eight donors/samples. Scale bars, 100 μm (top) and 25 μm (middle and bottom). g, The transcript levels of the corresponding keratins in the major paediatric TEC subtypes shown in c. Source Data
Fig. 5
Fig. 5. Specialized mTECs are organized around HCs in the paediatric medulla.
a, Representative paediatric (3 months old) Visium H&E image overlaid with minimal distance to HC (maximum cut-off, 350 μm). Scale bar, 1 mm. b, Illustration of the distance to the HC as opposed to the CMA, which is parallel to medullary depth. c, The distribution of medullary cells around HCs based on deconvolved paediatric Visium data. HC distance was split into 25 μm bins. The bars show the absolute spot numbers. Cells are sorted by the mean distance to, 25 cell types closest to HC are shown. d, The weighted mean position of medullary cells along the two axes based on deconvolved paediatric Visium data. The red line connects major mTEC subtypes. e, The workflow for identifying SGs and their spatial mapping using paediatric Visium data. f, The weighted mean position of all 867 medullary genes along the CMA and HC distance axes. SGs are represented by large dots and coloured according to the cell type in which they are uniquely expressed. g, UMAP embedding for mTECs; the mTECII/mTECIII lineage is highlighted. h, Trajectory analysis of the mTECII/III lineage. Colour indicates pseudotime, the arrows were manually added to illustrate direction. i, Trajectory embeddings showing the expression of canonical mTECII and mTECIII markers, mucosal and skin SGs. Colour scales represent expression levels. j, Annotation of mTECII/III states, highlighting the mTECIII-muc and mTECIII-skin subtypes, guided by mucosal and skin SGs. Bmem, memory B cells; medFB, medullary fibroblasts; NK, natural killer cells; EC-Art-ELN, elastin-expressing arterial endothelial cells. Source Data
Fig. 6
Fig. 6. High-resolution annotation and CMA mapping of single-positive thymocytes reveals spatiotemporal differences in their corticomedullary migration.
a, Cell abundances of αβ T lineage thymocytes after positive selection along the binned CMA based on deconvolved paediatric Visium data. The minimum-abundance cut-off for the inclusion of a Visium spot was 0.5%. b, Weighted nearest-neighbour (WNN) UMAP representation of paediatric CITE-seq data for conventional αβ T lineage cells from positive selection to full maturity (top). Developmental pseudotimes for the CD4 and CD8 lineage (bottom). c, CITE-seq cells ordered along CD4 (left) and CD8 (right) lineage pseudotime with the colour indicating discrete annotations. df, Spatial mapping of pseudotime-ordered CD4 (left) and CD8 (right) lineage cells to the CMA. Median values and the 0.05–0.95 quantiles of both the CMA and the pseudotime value for each annotated substage are shown. d, Cell localization inferred from Visium deconvolution using hyperclustered CITE-seq data. e, The position of IBEX cells after segmentation and CITE-seq-derived annotation. f, Direct comparison of the Visium (circle) and IBEX CMA mapping (diamond) shown in d and e. g, RNA and surface protein levels of relevant chemokine receptors along the pseudotimes for CD4 (left) and CD8 lineage (right) cells. Lines represent the smoothed mean ± s.e.m. h, The spatial distribution of chemokine transcripts along the CMA in paediatric Visium data. Source Data
Extended Data Fig. 1
Extended Data Fig. 1. Composition of fetal and paediatric scRNA-seq data.
a. Sample enrichment strategy for dissociated datasets as indicated by colour. Each dot represents a sample and stacked dots within a technology panel represent samples from the same donor. For samples marked by a black circle, αβTCR-seq was carried out. See Fig. 1c for sample source. b. Relative cell contribution to the dissociated dataset per donor, split by age group. Sample origin is indicated for all donors. n = 12 fetal donors, n = 17 paediatric donors. HTSA: Human Thymus Spatial Atlas. c. Relative contribution of published and newly generated scRNA-seq datasets by broad cell type (cell type level 1). n = 29 donors. d. UMAP embedding of the full, integrated scRNA-seq dataset with annotations of the major cell lineages (cell type level 0). e. UMAP embedding of the full, integrated scRNA-seq dataset with more detailed lineage annotations (cell type level 1). See Supplementary Notes 3 and 4 for complete annotation of T lineage, hematopoietic and stromal cells. “See_lv4_explore” refers to cells which could not confidently be assigned to a unique cell type based on literature or cell markers but can be explored in the provided AnnData object (Data availability). DC, dendritic cell; EC, endothelial cell; Fb, fibroblast; Mast, mast cell; Mono, monocyte; Neut, neutrophil; RBC, red blood cell; DN, double negative thymocyte; DP, double positive thymocyte; NK, natural killer cell. Source Data
Extended Data Fig. 2
Extended Data Fig. 2. Annotation of secondary structures in the thymus and distance measurements to region boundaries.
a. Representative H&E sections (left) of fetal (p.c.w. 15) and paediatric (3 months) Visium data, and IBEX virtual H&E (7 days old). Corresponding discrete annotation (annotation level 1, right) curated with TissueTag for Hassall’s corpuscles (HC), perivascular space (PVS), and additional small vessels. b. UMAP embedding of integrated samples for the three spatial datasets coloured by annotation level 1. c. UMAP embedding of integrated samples for the three spatial datasets coloured by min. L2 distances of each spot/cell to the cortex (right) and to the capsule/septum (“Edge”, left) demonstrating distinct spatial variance. d. CMA projected to Visium spot data and IBEX single cells on the same sections as shown in a.
Extended Data Fig. 3
Extended Data Fig. 3. Spatial sample composition and variance.
a-b. UMAP embeddings of integrated Visium spots coloured by donor, sample (Visium capture region), Visium slide, SpaceRanger version, age, number of genes captured, and section thickness. a. Integrated UMAP embeddings for fetal Visium samples. Age is indicated as post-conception weeks (p.c.w.) − 40. b. Integrated UMAP embeddings for paediatric Visium samples. c. UMAP embedding of integrated IBEX single nuclei data coloured by sample (one sample per donor). d. Cumulative explained variance of the ten first PCA components correlated to the spot CMA level for fetal and paediatric Visium, and paediatric IBEX samples. Samples are sorted by age from left to right and coloured by donor. Source Data
Extended Data Fig. 4
Extended Data Fig. 4. T cell markers and cytokine/chemokine expression profiles in fetal and paediatric single-cell and spatial datasets.
a. Dotplot showing expression of key cell type markers in the αβ T lineage differentiation stages depicted in Fig. 3d. Cells are arranged from most immature (left) to mature (right). Bar graphs indicate the total number of cells per subset. b. Boxplots showing the mean expression of selected chemokine genes in each CMA bin across different fetal vs. paediatric samples. Box boundary extends from the first to the third quartile of distribution with median in between, whiskers indicate min and max ranges with the exception of outliers (outside an inter-quartile range(IQR) of 1.5, indicated by diamonds). Cosine similarity between the mean fetal and paediatric expression values is indicated. n = 16 paediatric Visium samples, n = 12 fetal Visium samples c. Dotplot for chemokines/cytokines with differential distribution across the CMA bins for fetal vs. paediatric tissue as indicated either by low cosine similarity and/or a significant interaction effect. Bars show total number of cells per subset. Source Data
Extended Data Fig. 5
Extended Data Fig. 5. Identification of stromal and TEC subtypes using IBEX imaging.
a. IBEX confocal images from 2 month-old female thymus (IBEX_08) showing anatomical structures and cell types defined by 44-plex antibody panel. Images are representative of 8 samples/donors. Not shown: CD15 and LYVE-1. Large overview image shows a typical region of interest captured in each IBEX experiment (2-3 lobules). ANXA I, Annexin I; CHGA, Chromogranin A; Pan-CK, Pan-Cytokeratin; KRT, Keratin. b. Dot plot showing expression of proteins in IBEX data and of corresponding genes in scRNA-seq data for annotated TEC subsets. Depicted cell types represent cells in paediatric scRNA-seq data (“_gex”) and the corresponding cell types predicted in IBEX data based on KNN matching (“_ibex”). Expression was normalized per row. Boxes highlight corresponding cell types in the two datasets. KKNf is the fraction of mapped target KNN cells that come from the same cell type. c. Same as in b. but with rows clustered by mutual similarity dendrogram linkage to show similarity level between cell types within and across datasets. Boxes highlight cell types with highest similarity according to dendrogram.
Extended Data Fig. 6
Extended Data Fig. 6. Distribution of TEC subtypes in the fetal and paediatric thymus.
a. Dot plots showing the relative cell abundance of specialized TECs across the CMA bins in fetal and paediatric deconvolved Visium datasets. In all Visium dot plots, cutoff indicates the minimum proportion of the respective cell type in a Visium spot for the spot to be included. b. Dotplots showing relative cell abundance of specialized TECs across the CMA bins in paediatric IBEX KNN-mapped single nuclei datasets. For IBEX datasets KNN cutoff indicates the minimum percentage of KNNs that corresponded to the eventually assigned majority cell type agreement (see Methods). c. Relative cell distribution of TECs in CMA bins and spots associated with perivascular space (PVS) based on deconvolved Visium data. Boxes highlight mcTECs and PVS annotations. Note that proliferating mcTECs were only found in fetal thymus and cTECIII was exclusively detected in paediatric data. d. Relative cell distribution of TECs in CMA bins as well as PVS region based on paediatric IBEX KNN-mapped single nuclei datasets. Boxes highlight mcTECs and PVS annotations. e. 4-plex RNAscope staining of a fetal thymus tissue section (p.c.w. 13) for mcTECs (DLK2, IGFBP6), cTECs (LY75) and mTECs (EPCAM). DAPI was used to identify nuclei. White frame in the left image indicates magnified regions shown on the right. Lines in the left image indicate the CMJ, dashed lines in the right images highlight the capsule. Arrows indicate capsular mcTECs. Images are representative of four independent replicates. f-g. RareCyte protein staining of fetal and paediatric thymus sections with Ki-67, Pan-Cytokeratin (PanCK), and CD45 antibodies and DAPI. White frame in the left image indicates magnified regions on the right. f. Fetal thymus sample (p.c.w. 12). Arrows highlight a subcapsular niche with Ki-67+ non-lymphoid (CD45) epithelial (PanCK+) cells. Images are representative of a total of 10 replicates from 6 donors. g. Paediatric thymus sample (1 month old). Arrows highlight epithelial (PanCK+) cells in a lymphocyte-free (CD45) region in the PVS, which show little proliferation (Ki-67+/−). Images are representative of a total of 3 replicates from 3 donors. Source Data
Extended Data Fig. 7
Extended Data Fig. 7. Expression of mucosa- and skin-related genes in differentiated mTECIII subtypes.
a. Histogram showing the number of Visium spots with medullary annotation by their distance to the nearest HCs. The red dashed line indicates the maximum distance cutoff for Visium spots to be included. Note that around 90% of medullary Visium spots fall within this window. b. Multiscale diffusion space embedding of the mTECII/mTECIII populations generated using Palantir (coloured according to cell populations) with trajectory generated using scFates overlaid on top (colour indicates pseudotime stretching from dark violet to yellow). c. Heatmap showcasing differentially expressed genes between three different branches of the mTECII/TECIII trajectory, namely mTECII, mTECIII-skin and mTECIII-muc. See Methods for details on derivation of DE genes and source data for p-values. Specialization genes (SGs) are labelled. Source Data
Extended Data Fig. 8
Extended Data Fig. 8. Annotation and expression profiling of developing human thymocytes using CITE-seq.
a. UMAP embedding of the full paediatric CITE-seq dataset with high-resolution annotation of T cell maturation stages as well as several non-T cell subtypes. Supplementary Note 6 provides additional details on CITE-seq-derived annotation of T lineage cells. DP, double positive; (P), proliferating; (Q), quiescent; rearr, TCR-rearranging; pos sel, positive selected; SP, single positive; recirc, recirculating; tr, tissue resident; circ, circulating; itg, integrin. b. Surface expression levels of lineage and maturation markers along predicted pseudotimes for CD4 (left) and CD8 lineage (right). Line plots represent smoothed means ± s.e.m. of the expression levels in cells shown in Fig. 6c. Shaded boxes indicate the migration window and CD8SP cortical stage identified in Fig. 6d–f. c. Dot plot depicting expression of relevant chemokines in hematopoietic and stromal cells according to the paediatric scRNA-seq dataset. Colour coding indicates corresponding ligands to the receptors shown in Fig. 6g. Bar graphs indicate total number of cells per cell type. medFB, medullary fibroblast; EC, endothelial cell; Art, arterial; Ven, venous; Cap, capillary; Mac, macrophage; DC, dendritic cell.

Update of

  • A spatial human thymus cell atlas mapped to a continuous tissue axis.
    Yayon N, Kedlian VR, Boehme L, Suo C, Wachter B, Beuschel RT, Amsalem O, Polanski K, Koplev S, Tuck E, Dann E, Van Hulle J, Perera S, Putteman T, Predeus AV, Dabrowska M, Richardson L, Tudor C, Kreins AY, Engelbert J, Stephenson E, Kleshchevnikov V, De Rita F, Crossland D, Bosticardo M, Pala F, Prigmore E, Chipampe NJ, Prete M, Fei L, To K, Barker RA, He X, Van Nieuwerburgh F, Bayraktar O, Patel M, Davies GE, Haniffa MA, Uhlmann V, Notarangelo LD, Germain RN, Radtke AJ, Marioni JC, Taghon T, Teichmann SA. Yayon N, et al. bioRxiv [Preprint]. 2023 Oct 27:2023.10.25.562925. doi: 10.1101/2023.10.25.562925. bioRxiv. 2023. Update in: Nature. 2024 Nov;635(8039):708-718. doi: 10.1038/s41586-024-07944-6. PMID: 37986877 Free PMC article. Updated. Preprint.

References

    1. Farley, A. M. et al. Dynamics of thymus organogenesis and colonization in early human development. Development140, 2015–2026 (2013). - PMC - PubMed
    1. Haynes, B. F., Scearce, R. M., Lobach, D. F. & Hensley, L. L. Phenotypic characterization and ontogeny of mesodermal-derived and endocrine epithelial components of the human thymic microenvironment. J. Exp. Med.159, 1149–1168 (1984). - PMC - PubMed
    1. Park, J.-E. et al. A cell atlas of human thymic development defines T cell repertoire formation. Science367, eaay3224 (2020). - PMC - PubMed
    1. Spits, H. Development of alphabeta T cells in the human thymus. Nat. Rev. Immunol.2, 760–772 (2002). - PubMed
    1. Pearse, G. Normal structure, function and histology of the thymus. Toxicol. Pathol.34, 504–514 (2006). - PubMed

MeSH terms

LinkOut - more resources