. 2024 Nov;635(8039):690-698.
doi: 10.1038/s41586-024-08172-8. Epub 2024 Nov 20.

An integrated transcriptomic cell atlas of human neural organoids

Collaborators, Affiliations

An integrated transcriptomic cell atlas of human neural organoids

Zhisong He et al. Nature. 2024 Nov.

Erratum in

Abstract

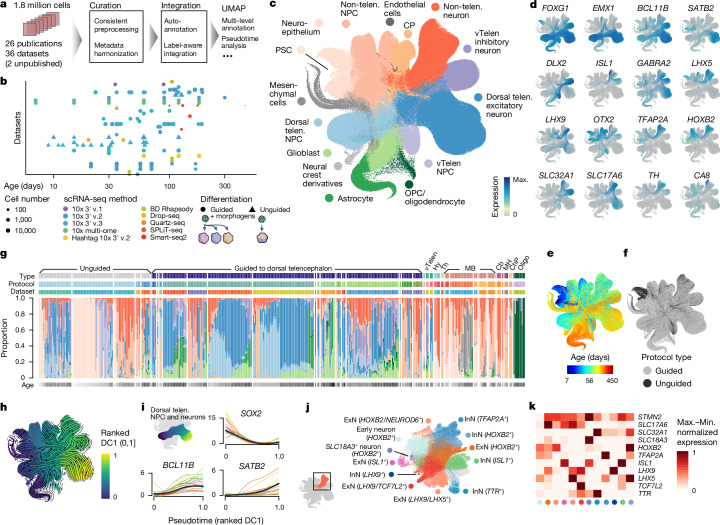
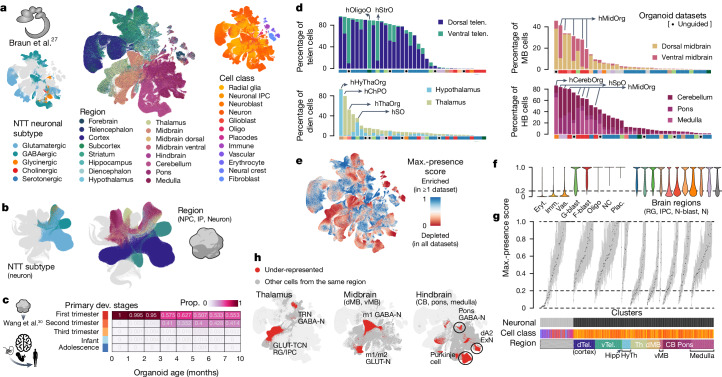
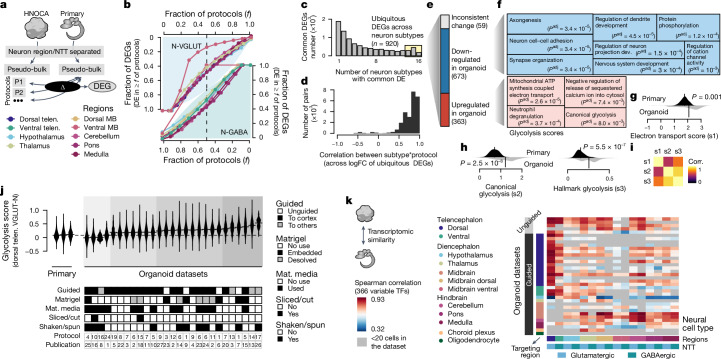
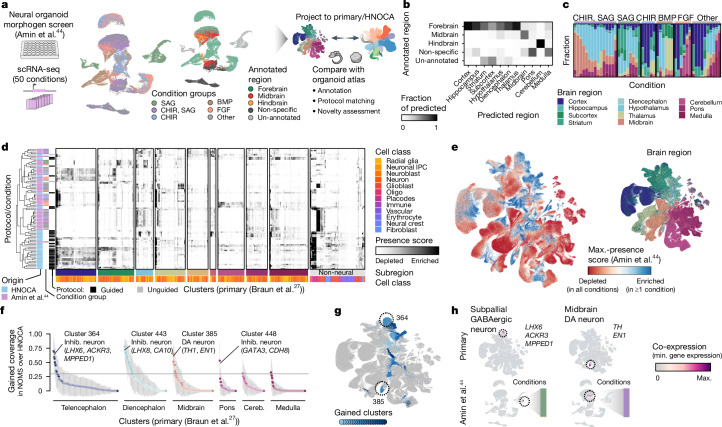
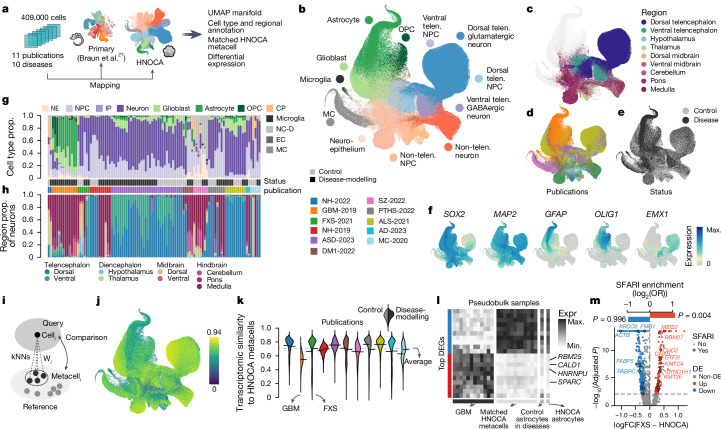
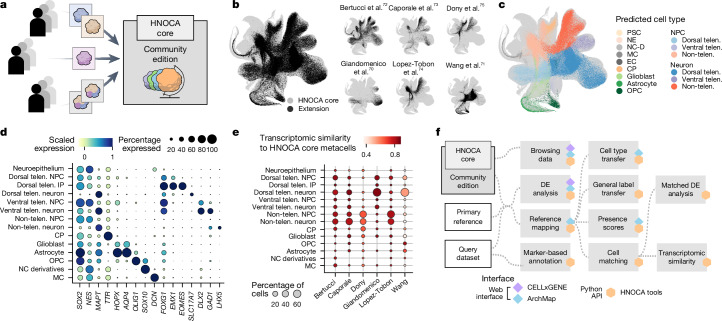
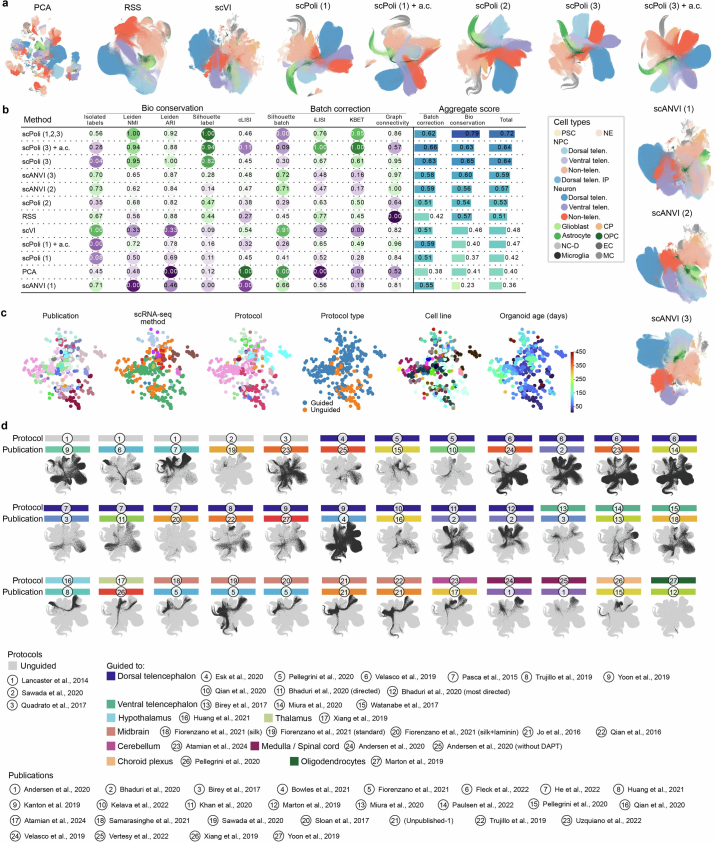
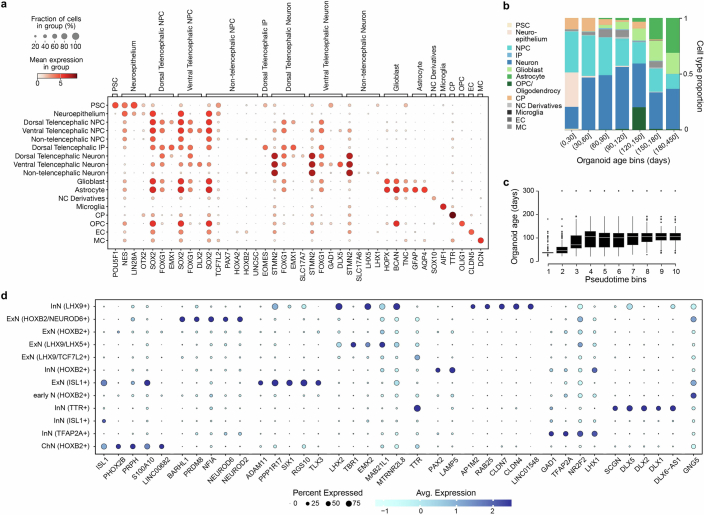
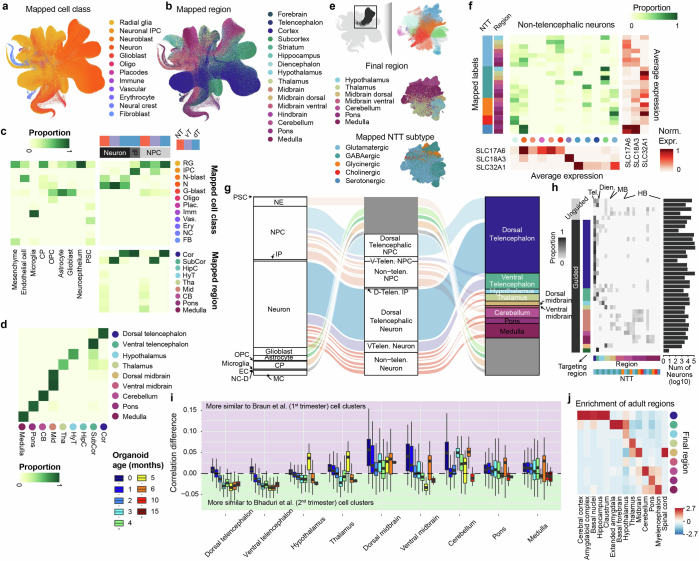
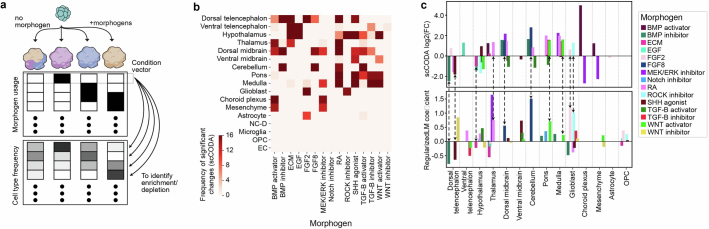
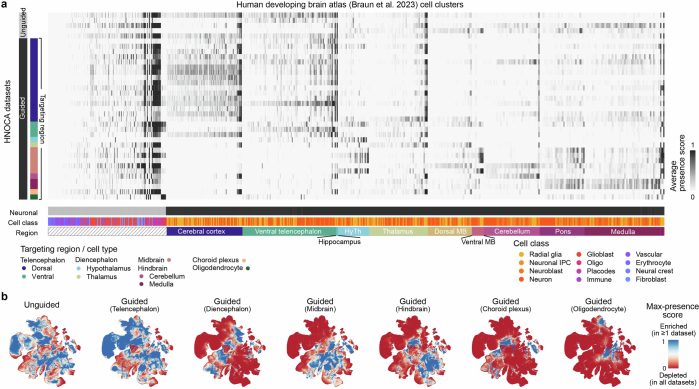
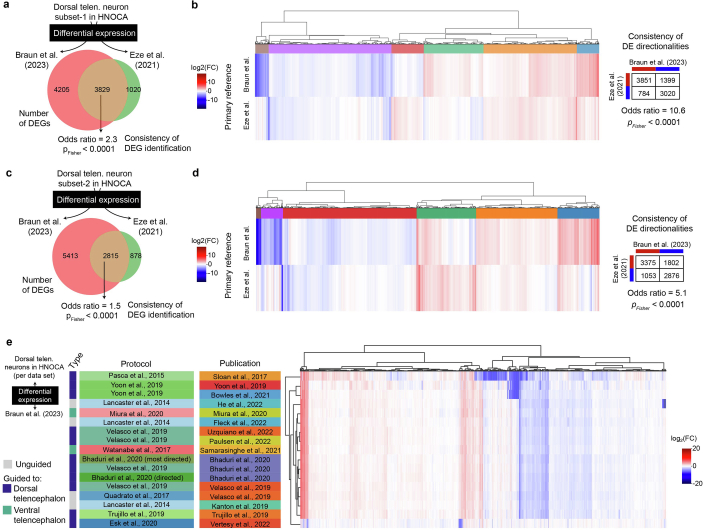
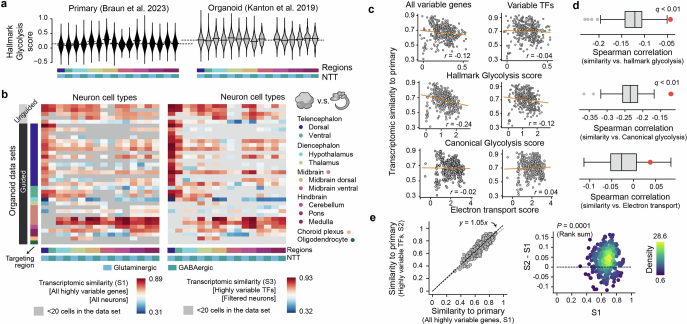
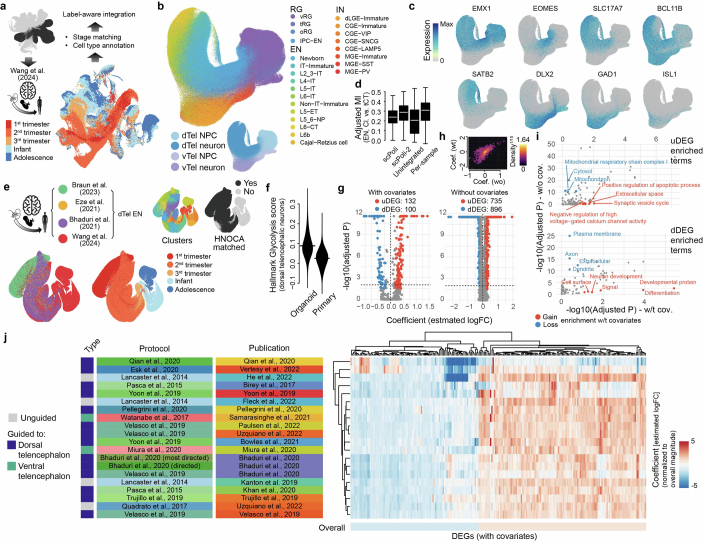
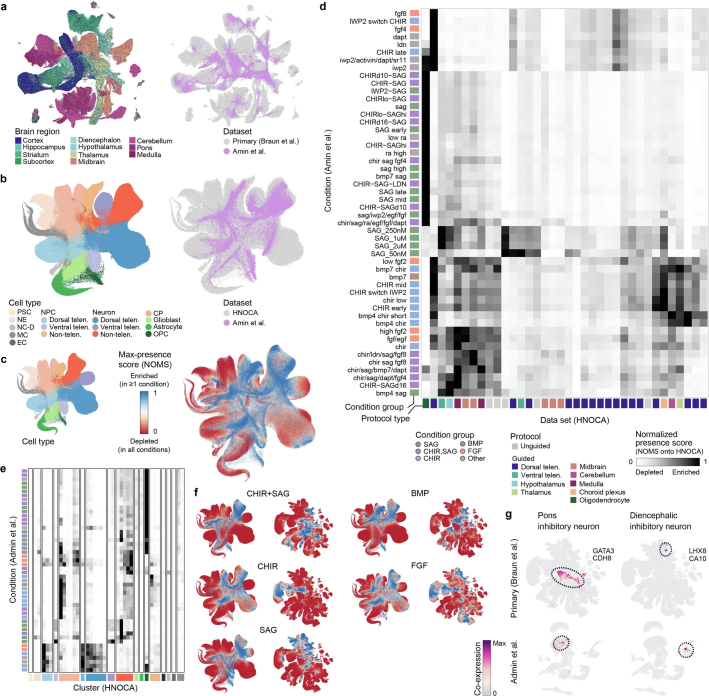
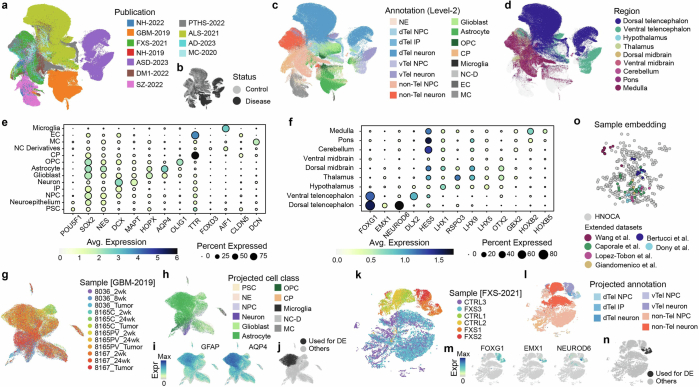
Human neural organoids, generated from pluripotent stem cells in vitro, are useful tools to study human brain development, evolution and disease. However, it is unclear which parts of the human brain are covered by existing protocols, and it has been difficult to quantitatively assess organoid variation and fidelity. Here we integrate 36 single-cell transcriptomic datasets spanning 26 protocols into one integrated human neural organoid cell atlas totalling more than 1.7 million cells1-26. Mapping to developing human brain references27-30 shows primary cell types and states that have been generated in vitro, and estimates transcriptomic similarity between primary and organoid counterparts across protocols. We provide a programmatic interface to browse the atlas and query new datasets, and showcase the power of the atlas to annotate organoid cell types and evaluate new organoid protocols. Finally, we show that the atlas can be used as a diverse control cohort to annotate and compare organoid models of neural disease, identifying genes and pathways that may underlie pathological mechanisms with the neural models. The human neural organoid cell atlas will be useful to assess organoid fidelity, characterize perturbed and diseased states and facilitate protocol development.


Conflict of interest statement

Competing interests: F.J.T. consults for Immunai Inc., Singularity Bio B.V., CytoReason Ltd, Cellarity, and has ownership interest in Dermagnostix GmbH and Cellarity. The other authors declare no competing interests.

Figures

Fig. 1
Fig. 1. Integrated HNOCA.
a, Overview of HNOCA construction pipeline. b, Metadata of biological samples included in HNOCA. cf, UMAP of the integrated HNOCA, coloured by level 2 cell type annotations (c), gene expression profiles of selected markers (d), sample ages (e) and differentiation protocol types (f). g, Proportions of cells assigned to different cell types in the HNOCA. Every stacked bar represents one biological sample, grouped by datasets and ordered by increasing sample ages. Top bars show 36 datasets, organoid differentiation protocols, protocol types. Bottom bars show the sample age. h, UMAP of the integrated HNOCA coloured by top-ranked diffusion component (DC1) on the real-time-informed transition matrix between cells. The stream arrows visualize the inferred flow of cell states toward more mature cells. i, Marker gene expression profiles along cortical pseudotime. j, UMAP of non-telencephalic neurons, coloured and labelled by clusters. k, Heatmap showing relative expression of selected genes across different non-telencephalic neuron clusters. Coloured dots show cluster identities as shown in j. Cb, cerebellum; ChP, choroid plexus; CP, choroid plexus; Hy, hypothalamus; max., maximum; MB, midbrain; MH, medulla; min., minimum; Oligo, oligodendrocyte; OPC, oligodendrocyte progenitor cell; PSC, pluripotent stem cell; telen., telencephalon; Th, thalamus; vTelen, ventral telencephalon.
Fig. 2
Fig. 2. Projection of HNOCA to primary developing human brain cell atlases assists organoid neural cell type annotation and estimation of primary cell type representation.
a, UMAP of a human developing brain cell atlas, coloured by NTT subtypes (left), region (middle) and annotated cell classes (right). b, UMAP of HNOCA, coloured by the mapped neuron NTT subtypes (left) and regional labels of NPCs, intermediate progenitor cells (IP) and neurons. c, Heatmap showing proportions of cells from organoids of different ages matched to cells from different primary developmental (dev.) stages. d, Percentages of neural cells representing different regions (telencephalon, diencephalon, midbrain and hindbrain) in different datasets. The x axes show datasets, descendingly ordered by the total proportions (bar height). Datasets based on unguided differentiation protocols are marked by dots underneath. The bars at the bottom of each panel show organoid protocol types. e, UMAP of the human developing brain cell atlas coloured by cell population presence within HNOCA datasets (max presence score). A low score denotes under-representation of cell state in HNOCA datasets. f, Distribution of max presence scores of different cell classes in the human reference atlas. Eryt., erythrocyte; Imm., immune; Vas., vascular; G-blast, glioblast; F-blast, fibroblast; NC, neural crest; Plac., placodes; RG, radial glia; IPC, intermediate progenitor cell; N-blast, neuroblast; N, neuron. g, Box plots showing distribution of max presence scores in different primary reference cell clusters. Bottom side bars show neuronal versus non-neuronal, cell class, region information of primary reference. h, UMAP of human developing brain atlas showing primary neural cell types or states under-represented in HNOCA (in red). Hippo, hippocampus; HyTh, hypothalamus; d, dorsal; v, ventral; CB, cerebellum.
Fig. 3
Fig. 3. Transcriptomic comparison between organoid neurons and their primary counterpart reveals universal cell stress in organoids.
a, Schematic of DE analysis comparing neural cell types in different protocols in HNOCA to their primary counterparts. b, Proportions of expressed genes in different neural cell types that show DE in certain fractions of protocols that generate the corresponding subtypes. Top left, glutamatergic neurons; bottom right, GABAergic neurons. Colour shows the brain region. c, Numbers of protocol-common DEGs (DE in at least half of protocols), grouped by the number of neural cell types in which a gene is DE. d, Distribution of expression log-fold-change (logFC) correlation of ubiquitous DEGs among different neuron subtype*protocol (that is, each of the neural cell types generated by each of the different protocols). e, Numbers of DEGs per category. f, Gene ontology enrichment analysis of downregulated (upper, blue) and upregulated (lower, red) ubiquitous DEGs. Sizes of the squares correlate with −log-transformed adjusted P values. g,h, Distribution of the mitochondrial ATP synthesis-coupled electron transport module scores (g), canonical glycolysis module scores (h, left) and the Molecular Signatures Database hallmark glycolysis module scores (h, right), in primary neural cell types (upper, dark) and organoid counterparts (lower, light). P values, significance of a two-sided Wilcoxon test. i, Heatmap shows pairwise correlation (corr.) of the three module scores. j, Hallmark glycolysis score of dorsal telencephalic excitatory neurons (dTelen VGLUT-N), split by the three primary developing human brains and 27 organoid datasets with at least 20 dTelen VGLUT-N. The lower panel shows selected features of differentiation protocols that may be relevant to cell stress. The protocol and publication indices are shown in Extended Data Fig. 1. Mat. media, maturation media. k, Spearman correlations between gene expression profiles of neural cell types in HNOCA and those in the human developing brain atlas, across the variable transcription factors (TFs). Datasets are in the same order as in Supplementary Table 1.
Fig. 4
Fig. 4. Projection of neural organoid morphogen screen scRNA-seq data to HNOCA and human developing brain atlas allows cell type annotation and organoid protocol evaluation.
a, Schematic of projecting neural organoid morphogen screen scRNA-seq data to the HNOCA, and a human developing brain reference atlas. UMAPs show screen condition groups (left, using morphogens SAG (sonic hedgehog signaling agonist), CHIR, BMP and FGF) and regional annotation of screen data (right). b, Comparison of regional annotation of screen data (rows) and scArches-transferred regional labels from the primary reference. c, Proportions of cells assigned to different regions on the basis of reference projection. Every stacked bar represents one screen condition. d, Clustering of HNOCA datasets with conditions in the screen data on the basis of average presence scores of clusters in the primary reference. The heatmap shows average presence scores per cluster in the primary reference (columns). e, UMAP of primary reference coloured by the dissected regions (right) and the maximum presence scores across the screen conditions (left). f, Gain of cell cluster coverage of screen conditions relative to HNOCA datasets, with negative values trimmed to zero. The grey horizontal line shows the threshold (0.3) to define gained clusters in screen data. g, UMAP of the primary reference, with gained clusters highlighted in shades of blue. Dashed circles highlight two clusters with highest gain of coverage in telencephalon and midbrain, respectively. h, Coexpression scores of cluster marker genes of the two clusters highlighted in g, in the primary reference (upper) and screen dataset (lower). DA, dopaminergic.
Fig. 5
Fig. 5. The HNOCA as a control cohort to facilitate cell type annotation and transcriptomic comparison for neural organoid disease-modelling data.
a, Overview of disease-modelling neural organoid atlas construction, and projection to primary atlas and HNOCA for downstream analysis. bf, UMAP of integrated disease-modelling neural organoid atlas coloured by predicted cell type annotation (b), predicted regional identities of NPCs, intermediate progenitor cells and neurons (c), publications (d), disease status (e) and marker gene expression (f). g,h, Proportions (prop.) of cells assigned to different cell classes (g) and regions (h). Every stacked bar represents one biological sample. Side bars show disease status and publication. i, Schematic of reconstructing matched HNOCA metacell for each cell in the disease-modelling neural organoid atlas. j, UMAP of disease-modelling neural organoid atlas, coloured by transcriptomic similarity with the matched HNOCA metacells. k, Violin plot indicates distribution of estimated transcriptomic similarities, split by publication. Left, distribution in control cells and right, distribution in disease cells. l, Heatmap showing expression of top DEGs between the AQP4+ population in the GBM-2019 dataset and their matched HNOCA metacells. Rows show DEGs with the ten strongest decreased and increased expressions. Columns show average expression in the AQP4+ population of disease-modelling samples (first panel), the matched HNOCA metacells per sample (second panel), all predicted control astrocytes and all astrocytes in HNOCA. m, Volcano plot shows DE analysis between dorsal telencephalic cells in the FXS-2021 dataset and their matched HNOCA metacells. DEGs coloured in red (increased in FXS) and blue (decreased in FXS). Encircled dots show DEGs annotated in SFARI database. Top bars show the log-transformed odds ratio of SFARI gene enrichment in the increased (red) and decreased (blue) DEGs. GBM, glioblastoma.
Fig. 6
Fig. 6. Extending the HNOCA by means of projection of extra datasets.
a, Schematic of projecting further scRNA-seq data by the community to extend the HNOCA. b, UMAP shows the dataset composition of the current extended HNOCA. c, UMAP shows the projected cell type annotation of cells in the five extended datasets. NE, neuroepithelium; NC-D, neural crest derivatives; MC, mesenchymal cell; EC, endothelial cell. d, Dot plot shows the expression of selected cell type and regional markers across projected cell types in the extended HNOCA datasets. e, Dot plot shows cell type composition and average similarity to the matched HNOCA metacells of the extended datasets. f, Schematic shows the analytical pipelines and varied interfaces to facilitate analysing scRNA-seq data of neural organoids for the community.
Extended Data Fig. 1
Extended Data Fig. 1. Benchmark of data integration.
(a) UMAPs of HNOCA, either without any data integration (PCA) or with different data integration methods applied. Number in parenthesis indicates which level of RSS-based snapseed annotation labels were provided as input to the model for methods which support semi-supervised data integration. Dots in all UMAP embeddings, each of which represents a cell, are colored by the cell type annotation introduced in Fig. 1. a.c. = aggrecell algorithm (b) scIB benchmarking metrics on all tested integration methods. (c) PCA of the scPoli sample embeddings from the final scPoli integration of HNOCA presented throughout the manuscript, colored by publications, scRNA-seq methods, organoid protocols, protocol types, cell lines, and sample ages. (d) UMAPs of HNOCA based on the final scPoli integration, each with one data set highlighted. Here, one data set is defined as data representing one protocol in one publication. The protocol and publication of each data set are shown by the color bar and indices on top of the UMAP.
Extended Data Fig. 2
Extended Data Fig. 2. Characterization of HNOCA.
(a) Expression of selected marker genes used in the semi-automatic annotation of cell types for Fig. 1. (b) Mean cell type proportion over all data sets per organoid age bin. (c) Distribution of sample real-time age in days over deciles of computed pseudotime. (d) Expression of top markers in different non-telencephalic neural cell types. Markers are defined as genes with AUC > 0.7, in-out detection rate difference>20%, in-out detection rate ratio>2 and fold change>1.2. When more than 5 markers are found, only the top-5 (with the highest in-out detection rate ratio) are shown.
Extended Data Fig. 3
Extended Data Fig. 3. Mapping-assisted annotation refinement of HNOCA.
(a-b) UMAP of HNOCA colored by the mapped (a) cell classes and (b) brain regions, both from the human developing brain cell atlas as the primary reference. (c) Comparison of the HNOCA cell type annotation with the primary reference mapping-based transferred cell class and brain region labels. Darkness of cells indicates proportions of each HNOCA cell type being assigned to different cell class and brain region categories. Brain region labels are only shown for the HNOCA neural cell types. (d) Comparison of the simple majority-voting-based regional label transfer and the hierarchical regional label transfer with random-walk-with-restart-based smoothening. Only cells annotated as NPCs, IPs and neurons are included. (e) UMAP of non-telencephalic neurons, colored by clusters (upper), mapped brain regions (middle) and mapped neurotransmitter transporter (NTT) subtypes (bottom). (f) Comparison of non-telencephalic neural cell types, defined as the concatenation of the mapped brain region and NTT subtype, with the clusters. The middle heatmap shows contributions of different clusters to different neural cell types. The sidebar on the left shows the neural cell types; dots under the heatmap show clusters. The heatmaps on the bottom and on the right show the average expression of three neurotransmitter transporters SLC17A6, SLC18A3 and SLC32A1 in clusters (bottom) and neural cell types (right). (g) Overview of the HNOCA cell type composition for the first two levels of the cell annotation (left - level-1, middle - level-2), and the refined regional annotation assisted by mapping of non-telencephalic NPC and neurons to the primary reference (right). (h) neural cell type compositions of different data sets (rows). Darkness of the heatmap shows the proportions of different neural cell types per HNOCA data set. Sidebars on the left show organoid protocol types of different data sets. Sidebars on the bottom show neural cell types. Bars on the right show total neuron numbers across data sets. (i) Distribution of transcriptomic similarity differences of NPCs and neurons in HNOCA with the primary neuronal populations in the first trimester (represented by Braun et al.) and the second trimester (represented by Bhaduri et al.). Cells are firstly grouped by regional identities, followed by organoid ages (in months). Colors of boxes indicate organoid ages. (j) Heatmap shows the enrichment of adult regional identities (columns) for HNOCA NPCs and neurons with different estimated regional identities (rows).
Extended Data Fig. 4
Extended Data Fig. 4. Relationship between morphogen usage and cell type as well as regional composition.
(a) Schematic of estimating cell type enrichment with different morphogen usages. (b) This heat map indicates in how many of the 17 iterations scCODA was executed (using each of the 17 regional cell identity as a reference once) the respective morphogen was found to lead to compositional changes with respect to the reference regional cell identity. A morphogen effect was called significant in this consensus approach if it had a significant effect on cell type composition with respect to more than half of the reference cell types. (c) Effect of different morphogens on regional organoid composition in HNOCA. Positive values correspond to a higher abundance of cells from the indicated regional cell identity in cases where the respective morphogen was used in the differentiation protocol. Top: log2-fold-effect sizes of morphogens per regional cell identity as computed by the scCODA model. Bottom: L1-regularized linear model coefficients. The dashed arrows show consistent enrichment/depletion identified by the two methods.
Extended Data Fig. 5
Extended Data Fig. 5. Presence scores per HNOCA data set.
(a) Average normalized presence scores of different HNOCA data sets (rows) in different cell clusters in the primary reference of the human developing brain atlas (columns). Sidebars on the left show organoid differentiation protocol types of HNOCA data sets. Sidebars underneath show cell class and the commonest region information of the cell clusters in the primary reference (HyTh - hypothalamus, MB - midbrain). (b) UMAP of the primary reference, colored by the max presence scores across different HNOCA data subsets, split by organoid protocol types. A high max presence score suggests enrichment of the corresponding primary cell state in at least one HNOCA data set among the data sets based on the specific type of organoid protocols, with a low score meaning under-representation of the cell state in all data sets in the subset.
Extended Data Fig. 6
Extended Data Fig. 6. Robustness of organoid-primary DEGs against primary reference, and across organoid data set.
(a) Number of DEGs between organoid Dorsal Telencephalic Neurons NT-VGLUT generated using the Velasco et al. protocol (10×3’ v2 chemistry only) and primary fetal cortical neurons from Braun et al. (10×3’ v2 chemistry only) or Eze et al. respectively. Of the 3829 shared DEGs, 3423 genes had an aligned direction of fold-change while 406 genes had an opposite direction of fold-change. (b) Heatmap of log2-transformed fold changes (log2FC) across all 9054 DEGs between Dorsal Telencephalic Neurons NT-VGLUT from Velasco et al. and either primary fetal cortical neurons from Braun et al. (10×3’ v2 chemistry only) or Eze et al. The dendrogram shows the hierarchical clustering of DEGs based on their log2FC against the two primary data. (c) Number of DEGs between organoid Dorsal Telencephalic Neurons NT-VGLUT generated using the Lancaster et al. protocol (10×3’ v2 chemistry only) and primary fetal cortical neurons from Braun et al. (10×3’ v2 chemistry only) or Eze et al. respectively. Of the 2815 shared DEGs, 2375 genes had an aligned direction of fold-change while 440 genes had an opposite direction of fold-change. (d) Heatmap of log2-transformed fold changes (log2FC) across all 9106 DEGs between dorsal telencephalic neurons from Lancaster et al. and either primary fetal cortical neurons from Braun et al. (10×3’ v2 chemistry only) or Eze et al. The dendrogram shows the hierarchical clustering of DEGs based on their log2FC against the two primary data. (e) Heatmap showing the mean log-fold change per gene across organoid publications for Dorsal Telencephalic Neurons NT-VGLUT compared to the expression in the matching cell type from the Braun et al. primary atlas. Shown are all genes that are significantly differentially expressed compared to primary cells in the data from at least one publication.
Extended Data Fig. 7
Extended Data Fig. 7. Transcriptomic fidelity of neurons and cell stress.
(a) Hallmark glycolysis scores of different neural cell types in primary (left, Braun et al.) and a selected organoid data set (right, Kanton et al.). (b) Spearman correlation between average gene expression profiles of neural cell types in HNOCA and those in the primary reference of human developing brain atlas, across either all the variable genes (left, S1) or variable transcriptional factors (TFs) (right, S3). The average gene expression profile per neural cell type was calculated with all cells (S1) or cells with low glycolysis scores (glycolysis score <0.6, S3). (c) Correlation between different average metabolic scores (up - hallmark glycolysis score, middle - canonical glycolysis score, low - electron transport score) and transcriptomic similarities (Spearman correlation) to primary counterparts. Each dot represents one neural cell type generated by one protocol. The correlation is calculated based on either all variable genes (left, S1) or variable TFs (right, S2). (d) The correlation between hallmark and canonical glycolysis scores and transcriptomic similarities to primary is significantly weaker when only TFs are taken into consideration, while electron transport scores show no correlation with transcriptomic similarities. The boxes show the distributions of correlation when a random subset of variable genes, with the same number as the variable TFs, are used. The red dots show the correlation using variable TFs. (e) Core transcriptomic fidelity of organoid neurons (S2, shown in Fig. 3) which only considers TFs, is higher than the global transcriptomic fidelity (S1) which considers all the highly variable genes. Core transcriptomic fidelity and global transcriptomic fidelity are highly correlated (left, x-axis - S1, y-axis - S2, each dot represents one neural cell type in one HNOCA data set), while core transcriptomic fidelity is significantly higher (right, x-axis: S1, y-axis: S2-S1, dots are colored by density estimated with Gaussian kernel). P-value shows the Wilcoxon test significance.
Extended Data Fig. 8
Extended Data Fig. 8. Heterogeneity of telencephalic NPCs and neurons and its incorporation to differential expression analysis between dorsal telencephalic neurons in HNOCA and primary developing human brains.
(a) Overview of mapping the telencephalic NPCs and neurons in HNOCA to the human neocortical developmental atlas for cell type annotations. (b) UMAP of cells from the HNOCA telencephalic trajectories, colored by the transferred cell types from the human neocortical developmental atlas (upper) and the HNOCA annotation. (c) UMAP of HNOCA telencephalic cells colored by expression levels of selected cell type markers. (d) Distributions of adjusted mutual information across dorsal telencephalic neurons in different HNOCA samples, between the transferred cell type labels and cluster labels generated with four different representations: 1) the original scPoli (scPoli-1), 2) the re-computed telencephalon-only scPoli based on given the transferred labels; 3) unintegrated PCA of the merged data; 4) PCA and clustering sample-wise. (e) The joint atlas of human neocortical development, colored by data sets, developmental stages, clusters, and whether there is any counterpart in HNOCA dorsal telencephalic neurons. (f) Distribution of the hallmark glycolysis scores in HNOCA and the primary atlas. (g) Volcano plots show the F-test-based DE analysis results, with (left) and without (right) the glycolysis scores and matched cluster labels as covariates. The identified DEGs are colored by red (increased expression in HNOCA) or blue (decreased expression in HNOCA). (i) Changes of functional term enrichment by DAVID for DEGs based on the analysis with or without covariates. The top panel shows enrichments for the up-regulated DEGs (uDEG) in organoids, and the lower panel shows enrichments for the down-regulated DEGs (dDEG). Each dot indicates one functional term with raw P-value < 0.05 for both DEG sets. Red dots indicate functional terms gaining enrichment with DEGs with covariates (with-covariate adjusted Pwt < 0.1, and without-covariate adjusted Pwo>Pwt). Blue dots indicate functional terms losing enrichment with DEGs without covariates (Pwt>0.1 and Pwo < 1 × 10⁻¹⁰). (j) Heatmap shows normalized coefficient (estimated logFC normalized by the overall logFC magnitude) of each DEG per data set. Dendrograms show hierarchical clustering of DEGs and data sets. Rows represent data sets. Side bars on the left are colored based on the types of protocols, individual protocols, and publications corresponding to the data sets. Columns represent DEGs.
Extended Data Fig. 9
Extended Data Fig. 9. Reference mapping of the neural organoid morphogen screen data to HNOCA and the human developing brain atlas.
(a) UMAP embedding of the human developing brain atlas and neural organoid morphogen screen data sets based on the joint scANVI latent space colored by brain region (left) and data set (right). (b) UMAP embedding of HNOCA and the screen data sets based on the joint scPoli latent space colored by annotated cell type (left) and data set (right). (c) scPoli UMAP embedding of the HNOCA colored by cell type (left) and max presence score across all data sets (right). (d) Heatmap showing min-max scaled average presence scores of each condition in the screen data set in HNOCA data sets. (e) Heatmap showing min-max scaled average presence scores of each condition in the screen data set in each leiden cluster in HNOCA, ordered by annotated cell type. (f) UMAP embeddings of HNOCA (left) and the human developing brain atlas (right) colored by presence scores for each condition group in the screen data set. (g) UMAP embeddings of the human developing brain atlas (upper) and screen data set (lower) colored by coexpression scores of clusters with gained coverage in the screen data set.
Extended Data Fig. 10
Extended Data Fig. 10. Disease-modeling neural organoid scRNA-seq atlas and data projection based extension of HNOCA.
(a-c) UMAP of the unintegrated disease-modeling neural organoid atlas, colored by (a) publications, (b) disease status, (c) transferred level-2 annotation from HNOCA, and (d) transferred regional identities from HNOCA. (e) Dot plot shows expression of selected cell type markers in cells with different transferred cell class labels (level-1) from HNOCA. (f) Dot plot shows expression of selected regional markers in the predicted NPCs and neurons in the disease-modeling atlas with different transferred regional identities from HNOCA. In both (e) and (f), sizes of dots represent percentages of cells expressing the gene, and colors of dots represent the average expression levels. (g-j) UMAP of the glioblastoma GBM-2019 data set, colored by (g) samples, (h) predicted cell class labels (level-1) from the HNOCA projection, (i) expression of astrocyte markers GFAP and AQP4, and (j) the AQP4+ population selected for DE analysis with HNOCA. (k-n) UMAP of the fragile X syndrome FXS-2021 data set, colored by (k) samples, (l) predicted cell type annotation (level-2) from the HNOCA projection, (m) expression of dorsal telencephalic cell markers FOXG1, EMX1 and NEUROD6, (n) the dorsal telencephalic NPC and neuron subset for DE analysis with HNOCA. (o) PCA of the scPoli sample embeddings of samples in HNOCA and five additional data sets projected to HNOCA.

References

    1. Birey, F. et al. Assembly of functionally integrated human forebrain spheroids. Nature545, 54–59 (2017). - PMC - PubMed
    1. Sloan, S. A. et al. Human astrocyte maturation captured in 3D cerebral cortical spheroids derived from pluripotent stem cells. Neuron95, 779–790.e6 (2017). - PMC - PubMed
    1. Kanton, S. et al. Organoid single-cell genomic atlas uncovers human-specific features of brain development. Nature574, 418–422 (2019). - PubMed
    1. Marton, R. M. et al. Differentiation and maturation of oligodendrocytes in human three-dimensional neural cultures. Nat. Neurosci.22, 484–491 (2019). - PMC - PubMed
    1. Trujillo, C. A. et al. Complex oscillatory waves emerging from cortical organoids model early human brain network development. Cell Stem Cell25, 558–569.e7 (2019). - PMC - PubMed

MeSH terms

LinkOut - more resources