. 2025 Jan;44(1):225-250.
doi: 10.1038/s44318-024-00293-0. Epub 2024 Nov 20.

Molecular condensation of the CO/NF-YB/NF-YC/FT complex gates floral transition in Arabidopsis

Affiliations

Molecular condensation of the CO/NF-YB/NF-YC/FT complex gates floral transition in Arabidopsis

Xiang Huang et al. EMBO J. 2025 Jan.

Abstract

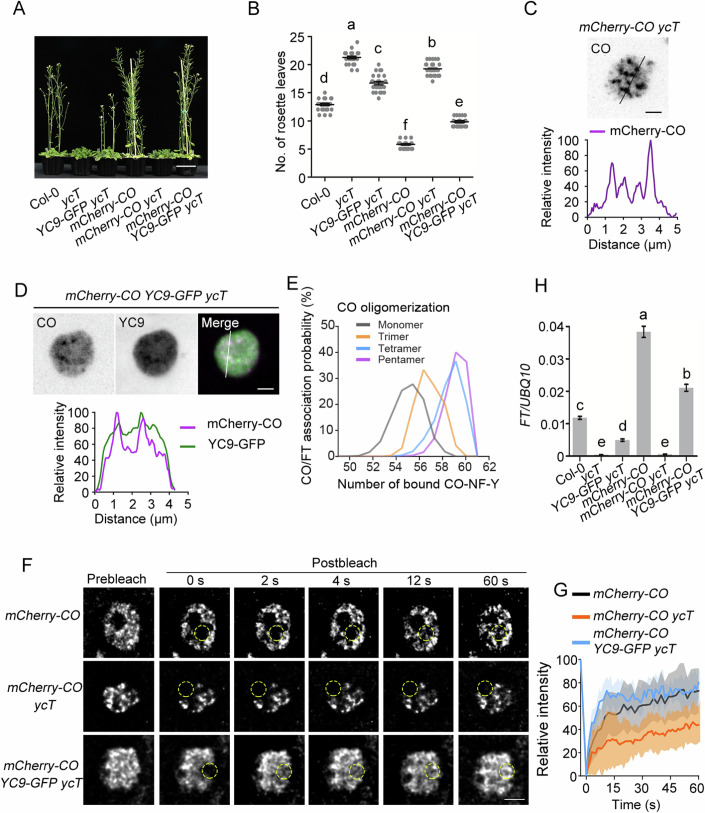
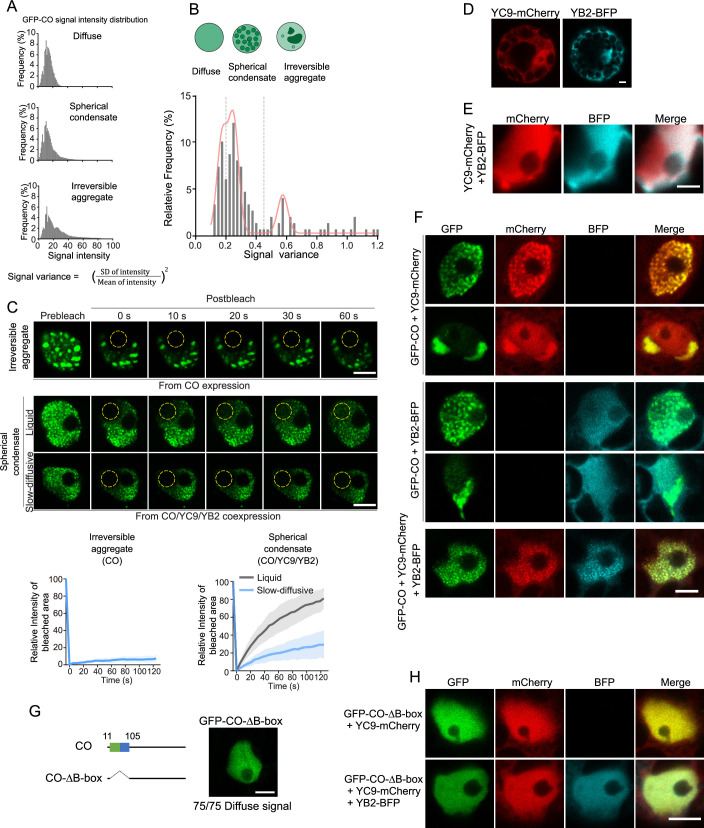
The plant master photoperiodic regulator CONSTANS (CO) interacts with Nuclear Factor-Y subunits B2 (NF-YB2) and C9 (NF-YC9) and transcriptionally activates the florigen gene FLOWERING LOCUS T (FT), regulating floral transition. However, the molecular mechanism of the functional four-component complex assembly in the nucleus remains elusive. We report that co-phase separation of CO with NF-YB2/NF-YC9/FT precisely controls heterogeneous CO assembly and FT transcriptional activation. In response to light signals, CO proteins form functional percolation clusters from a diffuse distribution in a B-box-motif-dependent manner. Multivalent coassembly with NF-YC9 and NF-YB2 prevents inhibitory condensate formation and is necessary to maintain proper CO assembly and material properties. The intrinsically disordered region (IDR) of NF-YC9, containing a polyglutamine motif, fine-tunes the functional properties of CO/NF-YB/NF-YC condensates. Specific FT promoter recognition with polyelectrolyte partitioning also enables the fluidic functional properties of CO/NF-YB/NF-YC/FT condensates. Our findings offer novel insights into the tunable macromolecular condensation of the CO/NF-YB/NF-YC/FT complex in controlling flowering in the photoperiod control.

Keywords: CO/NF-Y; Floral Transition; Macromolecular Condensation; Photoperiodic Regulation.


Conflict of interest statement

Disclosure and competing interests statement. The authors declare no competing interests.

Figures

Figure 1
Figure 1. The functional fluidic state of CO condensates depends on NF-YCs in plants.
(A) Flowering phenotype of representative 28-day-old Col-0, ycT, 35S:NF-YC9-GFP ycT, 35S:mCherry-CO, 35S:mCherry-CO ycT, and 35S:mCherry-CO 35S:NF-YC9-GFP ycT. Scale bar, 5 cm. (B) Comparison of rosette leaf number for Col-0, ycT, 35S:NF-YC9-GFP ycT, 35S:mCherry-CO, 35S:mCherry-CO ycT, and 35S:mCherry-CO 35S:NF-YC9-GFP ycT. Error bars, means ± SD; n = 25 seedlings. Different lowercase letters above the columns indicate the significant difference among different groups (one-way ANOVA, P  <  0.0001). (C) mCherry-CO formed obvious condensates in 5-day-old 35S:mCherry-CO ycT seedlings, pretreated with 15 h darkness and then transferred to light for 2 h. Scale bars, 2 µm. (D) Colocalization of mCherry-CO and NF-YC9-GFP in smaller condensates in 5-day-old 35S:mCherry-CO 35S:NF-YC9-GFP ycT seedlings, pretreated with 15 h darkness and then transferred to light for 2 h. Scale bars, 2 µm. (E) The distribution of the number of bound CO-NF-Y on FT promotor fragments in each indicated oligomerized CO-NF-Y complexes. The method for doing molecular simulations of oligomerized CO-NF-Y complex binding on FT promotor fragments containing the four binding motifs of CO was shown in Fig. EV1D. (F) FRAP assay of CO condensates in 35S:mCherry-CO, 35S:mCherry-CO ycT and 35S:mCherry-CO 35S:NF-YC9-GFP ycT. Deconvolution was applied to denoise the image due to weaker signal was obtained in time-series imaging as lower exposure was set for long-term image. Time indicates the duration after the photobleaching pulse. Dash circles indicate the bleached areas. Scale bar, 2 µm. (G) FRAP recovery plot of CO nuclear condensates in 35S:mCherry-CO, 35S:mCherry-CO ycT and 35S:mCherry-CO 35S:NF-YC9-GFP ycT. Solid lines and shaded area represent means ± SD; n = 10. (H) qRT-PCR analysis of the FT expression in 5-day-old transgenic seedlings of Col-0, ycT, 35S:NF-YC9-GFP ycT, 35S:mCherry-CO, 35S:mCherry-CO ycT, and 35S:mCherry-CO 35S:NF-YC9-GFP ycT. Gene expression levels are normalized to UBQ10, acting as an internal control. Error bars, means ± SD, n = 3. Different lowercase letters above the columns indicate the significant difference among different groups (one-way ANOVA, P  <  0.0001). Source data are available online for this figure.
Figure 2
Figure 2. NF-YC9 and NF-YB2 preserve liquid CO condensate properties for FT expression.
(A) The distribution of GFP-CO signal variance under indicated combinations of transient expression, subjecting to multipeak fitting. The distribution peaks highlight the major population of CO assembly at either ‘Diffuse’ (signal variance <0.21), ‘Spherical condensate’ (signal variance 0.21–0.45), or ‘Irreversible aggregate’ (signal variance >0.45), respectively, as classified in Fig. EV2A,B. n = 75. (B) The three representative CO assembly status as in A, which were obtained from the transient expression of GFP-CO alone in Arabidopsis protoplasts. Scale bars, 5 µm. (C) FRAP assay of spherical condensates of CO as shown in (B), indicating either liquid or slow-diffusive material properties of those CO condensation. Time indicates the duration after the photobleaching pulse. Dash circles indicate the bleached areas. Scale bar, 5 µm. (D) FRAP recovery curves from the intensity quantification of the bleached area in (C). Five independent observations were plotted for each category. Solid lines and shaded areas represent means ± SD. (E) Quantification of the distribution ratios of CO spherical condensates showing either liquid or slow-diffusive material property in transient expression of CO alone or CO/YC9/YB2 co-expression in Arabidopsis protoplasts. Error bars, means ± SD; n = 50 nuclei. (F) Transient expression assay indicating that the expression of FT was synergistically promoted by CO, NF-YC9, and NF-YB2 in Arabidopsis protoplasts. Error bars, means ± SD, n = 3. Different lowercase letters above the columns indicate the significant difference among different groups (one-way ANOVA, P  <  0.0001). Source data are available online for this figure.
Figure 3
Figure 3. Inter- and intramolecular multivalent interactions underlying CO/NF-YB2/NF-YC9/FT phase separation.
(A) Representative SPR kenetics of the inter/intra molecular interaction of mCherry-CO, NF-YC9-GFP, and NF-YB2. Magentas cloud, green triangle, and red circle indicated NF-YB2, NF-YC9, and mCherry-CO proteins, respectively. Series two-times diluted proteins, with indicated highest and lowest concentrations, were used as analytes that flowed through the chip immobilized with indicated proteins. Binding parameters were generated by fitting the sensorgrams using a bivalent model. (B) Coassembly of CO, NF-YC9, and NF-YB2 as nano molar scale. 10 nM of recombinant mCherry-CO, NF-YC9-GFP and NF-YB2 (labeled Alexa fluor 647) was mixed in buffer of 20 mM HEPES, 150 mM NaCl, pH 7.4 for 5 min before being added on cover glass and then checked under TIRFM. Merged image shows the colocalization of those three components. Arrow heads indicate the colocalized foci and the related protein single particles in each channel. Scale bar, 2 µm. (C) Single particle images of 10 nM recombinant mCherry-CO mixed with 10 nM NF-YC9-GFP and further supplied with or without a series concentration of NF-YB2 as indicated. The proteins were mixed in the buffer of 20 mM HEPES, 150 mM NaCl, pH 7.4 for 5 min before being added on cover glass and then checked under TIRFM. Scale bar, 2 µm. (D) Quantification of the mCherry-CO single particle total intensity in (C). n > 1000 single particles in each chart. The middle lines indicate the mean values. Error bars represent 95% confidence intervals. Significant differences were determined by one-way ANOVA, P  <  0.0001. (E) FRAP of mCherry-CO in the mixed droplets of 0.25 µM mCherry-CO/0.25 µM NF-YC9-GFP/15 µM NF-YB2/5 µg/mL FT and 0.25 µM mCherry-CO/0.25 µM NF-YC9-GFP/15 µM NF-YB2/5 µg/mL DNA, respectively. All the proteins were diluted in 20 mM HEPES, 150 mM NaCl, pH 7.4 buffer. Time indicates the duration after the photobleaching pulse. Dash circles indicate the bleached areas. Scale bar, 2 µm. (F) FRAP recovery plot of mCherry-CO in the mixed droplets of 0.25 µM mCherry-CO/0.25 µM NF-YC9-GFP/15 µM NF-YB2/5 µg/mL FT, n = 14, and 0.25 µM mCherry-CO/0.25 µM NF-YC9-GFP/15 µM NF-YB2/5 µg/mL DNA, n = 19, respectively. Solid lines and shaded area represent means ± SD. (G) Quantification of the mCherry-CO single recovery plateau in the bleached areas in (E). FRAP recovery plots in (F) were fitted with one one-phase decay model. The middle lines indicate the mean values. Error bars represent 95% confidence intervals. Significant difference was determined by Student’s t test, P = 0.0371. Source data are available online for this figure.
Figure 4
Figure 4. The polyQ repeat in NF-YC9 IDR is essential for NF-YC9 mediating CO phase separation and CO function to control flowering time.
(A) Schematic of NF-YC9 and NF-YC9-polyQ mutant constructs, which are deleted polyQ repeat (NF-YC9-0Q) or with a longer polyQ repeat (NF-YC9-37Q). (B) Subcellular localization of GFP-CO, NF-YB2-BFP, and NF-YC9-0Q-mCherry (or NF-YC9-37Q-mCherry) in Arabidopsis protoplasts. Scale bars, 5 µm. (C) The distribution of GFP-CO signal variance under indicated combinations of transient expression, subjecting to Gaussian fitting. Dashes lines indicate the cut off on signal variance values to classify the CO assembly to diffuse, spherical condensation and irreversible aggregate. n = 75. (D) Quantification of the distribution ratios of CO spherical condensates showing either liquid of slow-diffusive material property in transient expression under combinations of GFP-CO, NF-YB2-BFP, and NF-YC9-mCherry (or NF-YC9-0Q/37Q-mCherry) in Arabidopsis protoplasts. Error bars, means ± SD; n = 50 nuclei. Significant differences were determined by Student’s t test. (E) Transient expression assay of the FT promoter activity modulated with combinations of GFP-CO, NF-YB2-BFP, and NF-YC9-0Q-mCherry (or NF-YC9-37Q-mCherry) in Arabidopsis protoplasts. Error bars, means ± SD, n = 3. Different lowercase letters above the columns indicate the significant difference among different groups (one-way ANOVA, P  <  0.0001). (F) qRT-PCR analysis of FT expression in 5-day-old seedlings of Col-0, ycT, 35S:NF-YC9-GFP ycT, 35S:NF-YC9-0Q-GFP ycT, and 35S:NF-YC9-37Q-GFP ycT. Gene expression levels are normalized to UBQ10, acting as an internal control. Error bars, means ± SD, n = 3. Different lowercase letters above the columns indicate the significant difference among different groups (one-way ANOVA, P  <  0.0001). (G) Flowering phenotype of Col-0, ycT, 35S:NF-YC9-GFP ycT, 35S:NF-YC9-0Q-GFP ycT, and 35S:NF-YC9-37Q-GFP ycT. Scale bar, 5 cm. Source data are available online for this figure.
Figure 5
Figure 5. A model of fine-tuned CO condensation in regulating FT expression and flowering.
The condensation and function of CO are driven by multivalent interactions. Coassembly with NF-YC9, NF-YB2, and FT is essential for the formation of percolation clusters of CO condensates, which maintain functional fluidic properties required for activating FT transcription and triggering flowering transition. However, in the absence of NF-YC, CO proteins lead to over-assembly via strong self-interaction into slow-fluidic condensates, resulting in the improper partition of flexible NF-YB proteins and leading to the formation of malfunctional gelated condensates.
Figure EV1
Figure EV1. CO proteins accumulate and assemble to condensates in response to light.
(A) Time course of light-dependent CO condensate formation in 5-day-old transgenic Arabidopsis seedlings (35S:mCherry-CO, 35S:mCherry-CO ycT, and 35S:mCherry-CO 35S:NF-YC9-GFP ycT) with 15 h darkness treatment. Scale bars, 5 µm. (B) Quantification of mCherry-CO cluster index in (A). n = 0, 0, 0, 42, 37, 43, 59, 48, 45 ROIs (1 ROI in each nucleus) from left to right chart. Error bars, means ± SD. Significant differences among different groups were determined by one-way ANOVA test. (C) NF-YC9-GFP displayed a diffuse fluorescence signal pattern in 5-day-old 35S:NF-YC9-GFP ycT root epidermal cell. Noted there is no CO expression here as endogenous CO is not expressed in root epidermal cells. Scale bars, 2 µm. (D) A framework showing the procedures of computer simulation to understand oligomerized CO-NF-Y complex binding on FT promotor fragments. Here, the structures of monomeric, trimeric, tetrameric and pentameric CO were first predicted by Alpha-Fold2. Subsequently, the resolved structure of CO-CCT-NF-Y complex (PDB: 7CVO) was applied to replace the CCT domains in the multimeric CO structure. The resulting multimeric CO-NF-Y complexes were then modeled together with the FT promoter DNA fragments containing the four binding motif: P1, P2, CORE1, CORE2, colored for highlight, in the simulation boxes with same size, in which the proteins and DNA were shown after the simulation reaching equilibrium. The number of CO-NF-Y molecule and DNA fragment were fixed at 60 and 15, respectively, though the number of CO-NF-Y oligomers were not constant. (E) The distribution of the number of bound CO-NF-Y on each CO binding motif, as shown in d, in the simulation box modeling monomeric CO-NF-Y complex and DNA. Source data are available online for this figure.
Figure EV2
Figure EV2. Characterization of CO assembly.
(A) The character of fluorescence signal intensity distribution of diffuse, spherical condensation, and irreversible aggregate of CO assemblies. The equation below shows the calculation of the signal variance in each individual nucleus. (B) Plotting of CO signal variance distribution after collecting the overall CO signal variance data from different combination of CO, NF-YC9, NF-YB2 co-expression. The variances of fluorescence signal intensities were peaked and thus were classified to three populations: diffuse CO (signal variance < 0.21), spherical CO condensation (signal variance 0.21–0.45), and irreversible CO aggregate signals (signal variance > 0.45). n = 150. (C) FRAP assay showing unrecoverable CO signal in the irreversible aggregate of CO assembly as in (B) and the liquid/slow-diffusive spherical condensates of CO on CO/YC9/YB2 coexpression, respectively. Time indicates the duration after the photobleaching pulse. Dash circles indicate the bleached areas. Recovery curves from the intensity quantification of the bleached area was plotted. n = 5, 11 of independent observations from left to right graph. Solid lines and shaded areas represent means ± SD. Scale bars, 5 µm. (D) Subcellular localization of NF-YC9-mCherry and NF-YB2-BFP in Arabidopsis protoplasts, respectively. Scale bars, 5 µm. (E) Co-expression of NF-YC9-mCherry and NF-YB2-BFP in nuclei of Arabidopsis protoplasts. Scale bars, 5 µm. (F) Co-expression of GFP-CO and NF-YC9-mCherry, GFP-CO and NF-YB2-BFP, and GFP-CO, NF-YC9-mCherry and NF-YB2-BFP in nuclei of Arabidopsis protoplasts. Scale bars, 5 µm. (G) Schematic of CO and CO-∆B-boxes (deletion of two B-boxes, which are indicated by green and blue boxes) constructs. Subcellular localization of GFP-CO-∆B-boxes in Arabidopsis protoplasts. Scale bars, 5 µm. (H) Co-expression of GFP-CO-∆B-boxes and NF-YC9-mCherry, and GFP-CO-∆B-boxes, NF-YC9-mCherry and NF-YB2-BFP in nuclei of Arabidopsis protoplasts. Scale bars, 5 µm. Source data are available online for this figure.
Figure EV3
Figure EV3. The condensation properties of mCherry-CO, NF-YC9-GFP, and NF-YB2 assemblies in vitro at nano- or micro-molar scale.
(A) FRAP of 0.25 µM mCherry-CO, 0.25 µM NF-YC9-GFP, and 15 µM NF-YB2 with Alex647. All the proteins, including the following experiments, were diluted in 20 mM HEPES, 150 mM NaCl, pH 7.4 buffer. Scale bar, 2 µm. (B) FRAP recovery plot of 0.25 µM of mCherry-CO (n = 5), 0.25 µM of NF-YC9-GFP (n = 6), and 15 µM of NF-YB2 with Alex647 (n = 14), respectively. (C, D) Phase diagram of NF-YB2. The size of NF-YB2 droplets is dependent on the concentration of protein (0.25 μM to 20 μM) and salt (100 mM to 450 mM). Scale bar, 5 µm. (E) Single particle image of recombinant mCherry-CO, NF-YC9-GFP, and NF-YB2 (labeled by Alexa fluor 647), indicating the intermolecular interaction of any two of those three components. 10 nM indicated two proteins were mixed in the buffer of 20 mM HEPES, 150 mM NaCl, pH 7.4 for 5 min before being added on cover glass and then checked under TIRFM. Merged image shows the colocalization of indicated two components. Arrow heads indicate the colocalized foci and the related protein single particles in each channel. Scale bar, 2 µm. (F) Single particle images of 10 nM recombinant mCherry-CO mixed with a series of concentrations of YC9-GFP or NF-YB2. The proteins were mixed in the buffer of 20 mM HEPES, 150 mM NaCl, pH 7.4 for 5 min before being added on cover glass and then checked under TIRFM. Scale bar, 2 µm. (G) Quantification of the mCherry-CO single particle total intensity in (E). n > 700 single particles in each chart. The middle lines indicate the mean values. Error bars represent 95% confidence intervals. No signal difference was detected over each group by one-way ANOVA test. (H) FRAP of mixed droplets of 0.25 µM of mCherry-CO, 0.25 µM of NF-YC9-GFP, and 15 µM of NF-YB2 in pairs or together. Scale bar, 2 µm. (I) FRAP recovery plot of mCherry-CO in the mixed droplets of 0.25 µM mCherry-CO/0.25 µM NF-YC9-GFP (n = 6), 0.25 µM mCherry-CO/15 µM NF-YB2 (n = 11), and 0.25 µM mCherry-CO/0.25 µM NF-YC9-GFP/15 µM NF-YB2 (n = 14), respectively. (J) FRAP recovery plot of NF-YC9-GFP in the mixed droplets of 0.25 µM mCherry-CO/0.25 µM NF-YC9-GFP (n = 6), 0.25 µM NF-YC9-GFP/15 µM NF-YB2 (n = 10), and 0.25 µM mCherry-CO/0.25 µM NF-YC9-GFP/15 µM NF-YB2 (n = 14), respectively. (K) FRAP of mixed droplets of 0.25 µM mCherry-CO/5 µg/mL FT and 0.25 µM NF-YC9-GFP/5 µg/mL FT, respectively. Scale bar, 2 µm. (L) FRAP recovery plot of mCherry-CO in the mixed droplets of 0.25 µM mCherry-CO/5 µg/mL FT (n = 19), and NF-YC9-GFP in the mixed droplets of 0.25 µM NF-YC9-GFP/5 µg/mL FT (n = 16), respectively. (M) Quantification of total intensity of mCherry-CO condensates in Fig. 3E. n = 67, 73 from left to right. The middle lines indicate the mean values. Error bars represent 95% confidence intervals. ns indicate no significant differences (Student’s t test). Noted for all the FRAP assays in (A), (H), and (K), the time indicates the duration after the photobleaching pulse and the dash circles indicate the bleached areas. The solid lines and shaded areas in (B), (I), (J), and (L) represent means ± SD. Source data are available online for this figure.
Figure EV4
Figure EV4. IDRs within NF-YC9 are required for CO phase separation and its function in flowering control.
(A) Sequence analysis of NF-YC9, containing two IDR domains. Schematic of NF-YC9 and NF-YC9-∆IDR mutants (deletion of IDR1, IDR2, or both) constructs. (B) Yeast two-hybrid assays show the interactions between CO and NF-YC9, and CO and NF-YC9-∆IDR mutants. Transformed yeast cells were grown on SD/Trp-/Leu- and SD/Trp-/Leu-/His- (containing 10 mM 3-AT) medium. AD/BD-vector, vector-only controls; AD, activation domain; BD, DNA-binding domain. (C) Subcellular localization of GFP-CO, NF-YB2-BFP, and NF-YC9-∆IDRs-mCherry in Arabidopsis protoplasts. Scale bars, 5 µm. (D) The distribution of GFP-CO signal variance under indicated combinations of transient expression, subjecting to Gaussian fitting. Dashes lines indicate the cut off on signal variance values to classify the CO assembly to diffuse, spherical condensation and irreversible aggregate. n = 75. (E) FRAP assays for the spherical GFP-CO condensates in the nucleus with CO/NF-YC9-∆IDRs/NF-YB2 co-expression. Time indicates the duration after the photobleaching pulse. Dash circles indicate the bleached areas. Scale bar, 5 μm. (F) FRAP recovery curves from the intensity quantification of the bleached area in (E). Data from ≥7 and 4 of independent observations were plotted for liquid and slow-diffusive condensates, respectively. Solid lines and shaded areas represent means ± SD. (G) Quantification of the distribution ratios of CO spherical condensates showing either liquid or slow-diffusive material property in transient expression under combinations of GFP-CO, NF-YB2-BFP, and NF-YC9 (NF-YC9-∆IDRs-mCherry) in Arabidopsis protoplasts. Error bars, means ± SD, n = 50 nuclei. Asterisks indicate significant differences (Student’s t test, *P < 0.05). (H) qRT-PCR analysis of FT expression in 5-day-old seedlings of Col-0, ycT, 35S:NF-YC9-GFP ycT, 35S:NF-YC9-∆IDR1-GFP ycT, 35S:NF-YC9-∆IDR2-GFP ycT, and 35S:NF-YC9-∆IDR1&2-GFP ycT. Gene expression levels were normalized to UBQ10, acting as an internal control. Error bars, means ± SD, n = 3. Different lowercase letters above the columns indicate the significant difference among different groups (one-way ANOVA, P  <  0.0001). (I) Flowering phenotype of Col-0, ycT, 35S:NF-YC9-GFP ycT, 35S:NF-YC9-∆IDR1-GFP ycT, 35S:NF-YC9-∆IDR2-GFP ycT, and 35S:NF-YC9-∆IDR1&2-GFP ycT. Scale bar, 5 cm. (J) Comparison of rosette leaf number for the representative transgenic plants in (I). n = 25 seedlings. Different lowercase letters above the columns indicate the significant difference among different groups (one-way ANOVA, P  <  0.0001). (K) Western blot analysis of NF-YC9-GFP, NF-YC9-∆IDR1-GFP, NF-YC9-∆IDR2-GFP, and NF-YC9-∆IDR1&2-GFP expression in the representative transgenic plants. Source data are available online for this figure.
Figure EV5
Figure EV5. The polyQ repeat embedded within NF-YC9 IDR is required for mediating CO function in controlling flowering.
(A) Sequence analysis of NF-YC family members in Arabidopsis thaliana revealed a conserved polyQ repeat among NF-YC1/4/3/9/2, which are related to flowering. (B) Structures of CO/NF-YC9/NF-YB2/DNA complex with original NF-YC9, NF-YC9 (0Q) or NF-YC9 (37Q) as predicted by AlphaFold3. The DNA fragment input contains the CORE2 site for CO/NF-Y binding. Zoomed regions show the polyQ region embedded α-helices, the polyQ repeats were highlighted with the black box. (C) Yeast two-hybrid assays show the interactions between CO and NF-YC9, and CO and NF-YC9-polyQ mutants. Transformed yeast cells were grown on SD/Trp-/Leu- and SD/Trp-/Leu-/His- (containing 10 mM 3-AT) medium. AD/BD-vector, vector-only controls; AD, activation domain; BD, DNA-binding domain. (D) FRAP assays for the spherical GFP-CO condensates in the nucleus with CO/YC9-0Q/YB2 or CO/YC9-37Q/YB2 co-expression. Time indicates the duration after the photobleaching pulse. Dash circles indicate the bleached areas. Scale bar, 5 μm. (E) FRAP recovery curves from the intensity quantification of the bleached area in (D). Data from ≥7 and 4 of independent observations were plotted for liquid and slow-diffusive condensates, respectively. Solid lines and shaded areas represent means ± SD. (F) Western blot analysis of NF-YC9-GFP, NF-YC9-0Q-GFP, and NF-YC9-37Q-GFP expression in the representative transgenic plants. (G) Comparison of rosette leaf number of Col-0, ycT, 35S:NF-YC9-GFP ycT, 35S:NF-YC9-0Q-GFP ycT, and 35S:NF-YC9-37Q-GFP ycT. Error bars, means ± SD. n = 25 seedlings. Different lowercase letters above the columns indicate the significant difference among different groups (one-way ANOVA, P  <  0.0001). Source data are available online for this figure.

Similar articles

Cited by

References

    1. Abramson J, Adler J, Dunger J, Evans R, Green T, Pritzel A, Ronneberger O, Willmore L, Ballard AJ, Bambrick J et al (2024) Accurate structure prediction of biomolecular interactions with AlphaFold 3. Nature 630:493–500 - PMC - PubMed
    1. Alberti S, Gladfelter A, Mittag T (2019) Considerations and challenges in studying liquid-liquid phase separation and biomolecular condensates. Cell 176:419–434 - PMC - PubMed
    1. An H, Roussot C, Suárez-López P, Corbesier L, Vincent C, Piñeiro M, Hepworth S, Mouradov A, Justin S, Turnbull C et al (2004) CONSTANS acts in the phloem to regulate a systemic signal that induces photoperiodic flowering of Arabidopsis. Development 131:3615–3626 - PubMed
    1. Andrés F, Coupland G (2012) The genetic basis of flowering responses to seasonal cues. Nat Rev Genet 13:627–639 - PubMed
    1. Banani SF, Lee HO, Hyman AA, Rosen MK (2017) Biomolecular condensates: organizers of cellular biochemistry. Nat Rev Mol Cell Biol 18:285–298 - PMC - PubMed

MeSH terms

LinkOut - more resources