. 2024 Dec;43(24):6444-6468.
doi: 10.1038/s44318-024-00314-y. Epub 2024 Nov 20.

Viral N protein hijacks deaminase-containing RNA granules to enhance SARS-CoV-2 mutagenesis

Affiliations

Viral N protein hijacks deaminase-containing RNA granules to enhance SARS-CoV-2 mutagenesis

Zhean Li et al. EMBO J. 2024 Dec.

Abstract

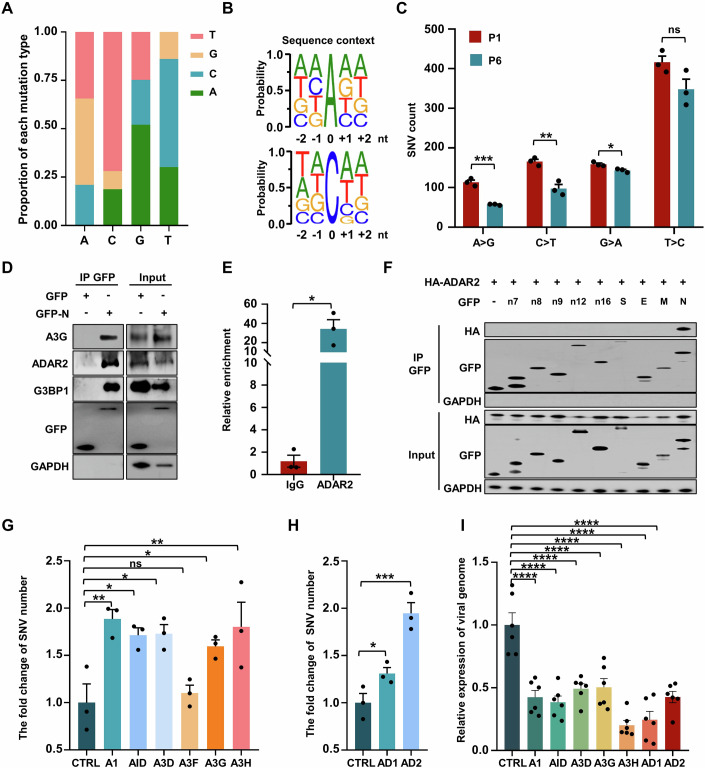
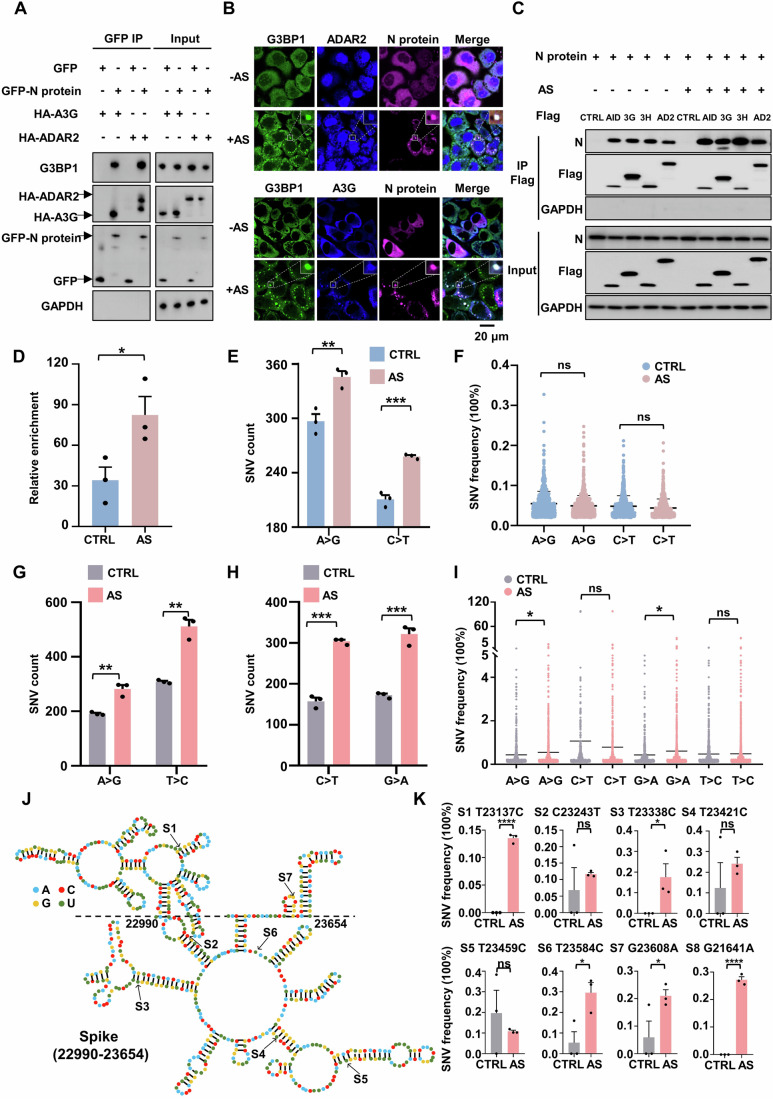
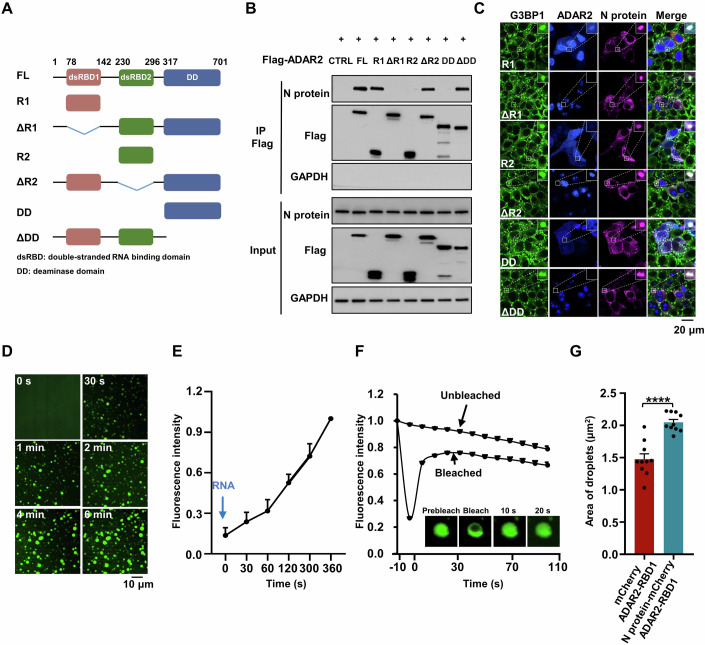
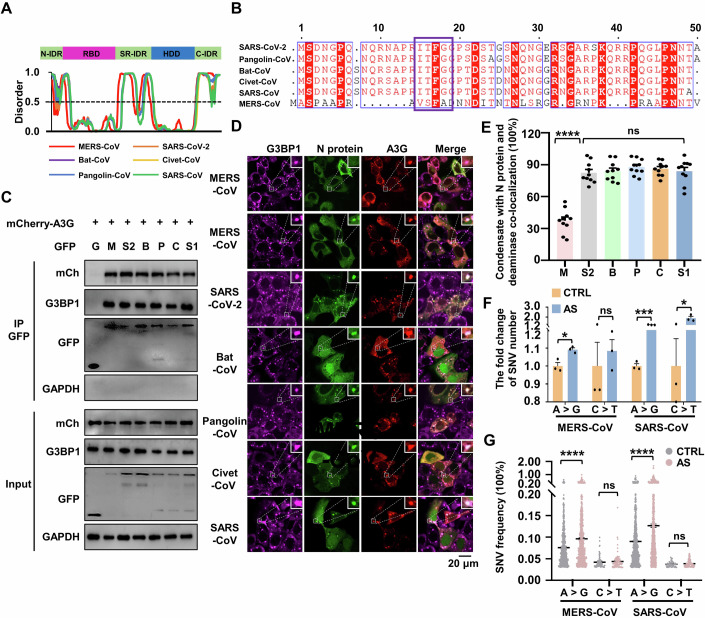
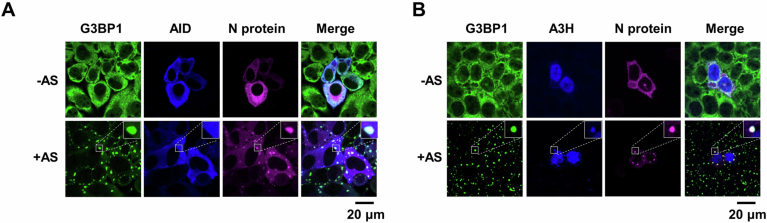
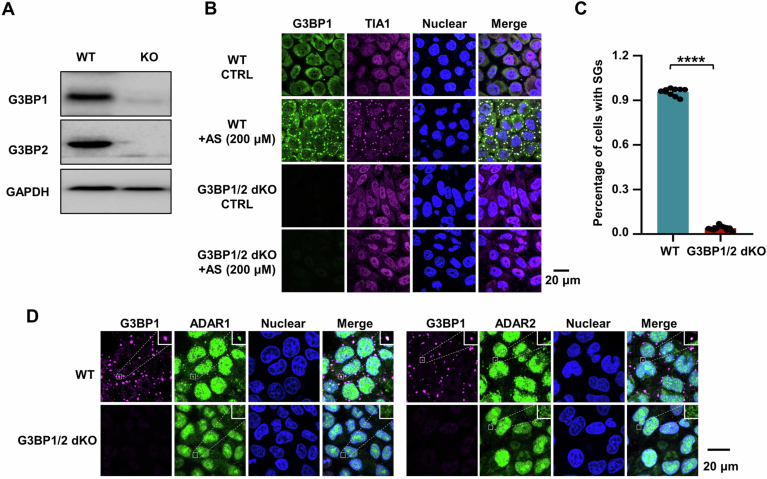
Host cell-encoded deaminases act as antiviral restriction factors to impair viral replication and production through introducing mutations in the viral genome. We sought to understand whether deaminases are involved in SARS-CoV-2 mutation and replication, and how the viral factors interact with deaminases to trigger these processes. Here, we show that APOBEC and ADAR deaminases act as the driving forces for SARS-CoV-2 mutagenesis, thereby blocking viral infection and production. Mechanistically, SARS-CoV-2 nucleocapsid (N) protein, which is responsible for packaging viral genomic RNA, interacts with host deaminases and co-localizes with them at stress granules to facilitate viral RNA mutagenesis. N proteins from several coronaviruses interact with host deaminases at RNA granules in a manner dependent on its F17 residue, suggesting a conserved role in modulation of viral mutagenesis in other coronaviruses. Furthermore, mutant N protein bearing a F17A substitution cannot localize to deaminase-containing RNA granules and leads to reduced mutagenesis of viral RNA, providing support for its function in enhancing deaminase-dependent viral RNA editing. Our study thus provides further insight into virus-host cell interactions mediating SARS-CoV-2 evolution.

Keywords: Deaminases; Innate Immunity; Mutagenesis; SARS-CoV-2.


Conflict of interest statement

Disclosure and competing interests statement. The authors declare no competing interests.

Figures

Figure 1
Figure 1. Deaminases link N protein to edit viral RNA and impair viral production.
(A) Average proportion of nucleotide changes in SARS-CoV-2 transcriptomes (allelic fraction ≥0.1%). Mean with SE were plotted from three independent biological replicates. The x-axis represents the original nucleotide of the SARS-CoV-2 genome, and indicative colour blocks represent nucleotides to which original nucleotide mutated. (B) Sequence contexts for A > I (G) and C > U (T) mutations in the viral transcriptome. (C) The number of SNVs identified in the SARS-CoV-2 transcriptomes following one (P1) and six passages (P6, allelic fraction ≥0.1%). Mean with SE were plotted from three biological replicates. Statistical analysis was performed with a two-tailed unpaired t-test. ns >0.05, *P < 0.05, **P < 0.01, ***P < 0.001. ns, not significant. (D) The SARS-CoV-2 N protein interacts with host endogenous G3BP1, A3G and ADAR2. HeLa cells were transfected with plasmids encoding GFP-tagged N protein, followed by immunoprecipitation with an anti-GFP antibody and the bound proteins were then analyzed by western blotting. (E) Enrichment of N protein mRNA, as measured by RIP assay in HeLa cells. Cells were transfected with the N gene with a GFP tag and lysates were collected at 48 h post-transfection. Lysates were divided for incubation with a mouse anti-ADAR2 antibody, and co-precipitated RNA was analyzed by RT-qPCR. Mean with SE were plotted from three biological replicates. Statistical analysis was performed with a two-tailed unpaired t-test. *P < 0.05. (F) ADAR2 specifically interacts with the SARS-CoV-2 N protein. HeLa cells were co-transfected with plasmids encoding HA-tagged ADAR2 and GFP control or GFP-tagged SARS-CoV-2 genes, including nsp7 (n7), nsp8 (n8), nsp9 (n9), nsp12 (n12), nsp16 (n16), spike protein (S), envelope protein (E), membrane protein (M) and nucleocapsid protein (N). (G) APOBECs mediate SARS-CoV-2 RNA mutagenesis (allelic fraction ≥2%). Mean with SE were plotted from three biological replicates. The number of SNVs with C > T/G > A mutations was normalized to the number of control group. Statistical analysis was performed with a one-way ANOVA test. ns > 0.05, *P < 0.05, **P < 0.01. ns, not significant. (H) ADARs mediate SARS-CoV-2 RNA mutagenesis (allelic fraction ≥2%). Mean with SE were plotted from three biological replicates. The number of SNVs with A > G/T > C mutations was normalized to the number of control group. Statistical analysis was performed with an unpaired t-test. *P < 0.05, ***P < 0.001. (I) Deaminases regulate SARS-CoV-2 production. Viral genomic RNA expression was normalized to that of the control group. Mean with SE were plotted from six biological replicates. Statistical analysis was performed with a one-way ANOVA test. ****P < 0.0001. Source data are available online for this figure.
Figure 2
Figure 2. SARS-CoV-2 N protein and viral RNA enter deaminase-enriched condensates to efficiently promote viral RNA mutagenesis.
(A) The SARS-CoV-2 N protein interacts with host G3BP1 and deaminase A3G or ADAR2. HeLa cells were co-transfected with plasmids encoding GFP-tagged N protein or GFP control and HA-tagged A3G or ADAR2. Cell lysates were immunoprecipitated with an anti-GFP antibody, and the precipitated proteins were analyzed by western blotting with antibodies against HA or G3BP1. (B) A3G or ADAR2 co-localizes with the N protein in SGs in HeLa cells. HeLa cells transfected with the N gene and A3G or ADAR2 were treated with 200 μM AS for 45 min to induce SG formation, followed by immunofluorescence staining for the N protein, A3G or ADAR2 and endogenous G3BP1. Scale bar: 20 μm. (C) Condensate formation of N protein-deaminases complex enhances the interaction between the N protein and deaminases. HeLa cells transfected with the N gene and Flag control or Flag-tagged deaminases, including AID, A3G (3G), A3H (3H) and ADAR2 (AD2), were treated with or without AS. (D) mRNA enrichment of the N protein was measured by RIP assay in HeLa cells treated with or without 200 μM AS treatment. Mean with SE were plotted from three biological replicates. Statistical analysis was performed with a two-tailed unpaired t-test. *P < 0.05. (E) Condensate formation promotes the count of SNVs (A > G and C > T mutations) identified in the N protein mRNA in HeLa cells. Values and error bars were represented as the mean ± SEM of three independent biological replicates (allelic fraction ≥0.02%). Statistical analysis was performed with a two-tailed unpaired t-test. **P < 0.01, ***P < 0.001. (F) Allelic fraction of SNVs (A > G and C > T mutations) in the N gene in HeLa cells with or without AS treatment. Mean with SE were plotted from three biological replicates. Statistical analysis was performed with a two-tailed unpaired t-test. ns > 0.05. ns, not significant. (G, H) Formation of N protein-deaminase complex-containing RNA condensates increases the number of SNVs identified in the SARS-CoV-2 genome. (G) A > G and T > C mutations; (H) C > T and G > A mutations. Values and error bars were represented as the mean ± SEM of three independent biological replicates (allelic fraction ≥0.1%). Statistical analysis was performed with a two-tailed unpaired t-test. **P < 0.01, ***P < 0.001. (I) Allelic fraction of the indicated SNVs in the SARS-CoV-2 genome in infected cells with or without AS. Mean with SE were plotted from three biological replicates. Statistical analysis was performed with a two-tailed unpaired t-test. ns >0.05, *P < 0.05. ns, not significant. (J) Representative secondary structure prediction of the region (22,990-23,654nt) extracted from the spike gene based on icSHAPE data (Sun et al, 2021a). The edited base is indicated by arrows. Site, S. (K) Condensate formation of the N protein-deaminases complex promotes the mutational rate of indicated sites in the spike gene. Mean with SE were plotted from three biological replicates. Statistical analysis was performed with an unpaired t-test. ns > 0.05, *P < 0.05, ****P < 0.0001. ns, not significant. Source data are available online for this figure.
Figure 3
Figure 3. Disruption of N protein/deaminase-containing condensates attenuates viral RNA mutagenesis.
(A) Deletion of G3BP1/2 (G3BP1/2 dKO) in HeLa cells abrogates the formation of N protein/deaminase-containing condensates in G3BP1/2-null HeLa cells. Scale bar: 20 μm. (B) Immunofluorescence analysis showing the localization of the N protein in SGs in cells with or without G3BP1/2 under sorbitol-induced stress. The WT or G3BP1/2-depleted HeLa cells transfected with the N gene were treated with 0.5 M sorbitol for 1 h to induce SG formation, followed by immunostaining for N protein, and endogenous G3BP1 or TIA1. Scale bar: 20 μm. (C) Quantification of SGs, expressed as the percentage of cells containing SGs in fixed WT or G3BP1/2 dKO HeLa cells with or without sorbitol treatment. Mean with SE were plotted from ten biological replicates. Statistical analysis was performed with an unpaired t-test. ****P < 0.0001. (D) Disruption of N protein/deaminase-containing condensates attenuates ADARs and APOBECs-mediated RNA editing in the N protein mRNA. Values and error bars were represented as the mean ± SEM of three independent biological replicates (allelic fraction ≥0.02%). Statistical analysis was performed with a one-way ANOVA test. ns > 0.05, *P < 0.05, **P < 0.01. ns, not significant. Source data are available online for this figure.
Figure 4
Figure 4. The NF17A protein fails to enter deaminase-localized RNA condensates, impairing deaminases-mediated editing activity on viral RNA.
(A) Schematic domain structure of the NF17A protein. NTD: N-terminal domain; RBD: RNA-binding domain; SR: serine/arginine rich motif; HDD: homodimerization domain; CTD: C-terminal domain. (B) The F17A mutation in the N protein impairs phase separation with G3BP1. Scale bar, 10 μm. (C) Column scatter charts display the droplet area from reactions shown in (B). Data are shown as mean ± SEM (n = 20 independent images). Statistical analysis was performed with an unpaired t-test. ****P < 0.0001. (D) The NF17A protein retains the ability to interact with ADAR2. HeLa cells were co-transfected with plasmids encoding GFP-tagged N wild type or NF17A mutant and HA-tagged ADAR2. (E) The NF17A protein fails to enter deaminase-containing RNA condensates. HeLa cells co-transfected with NWT or NF17A mutant were treated with AS for 45 min to induce SGs, followed by immunostaining for N protein (green) and the endogenous ADAR2 (red). (F) Enrichment of the N protein mRNA, as measured by RIP assay in HeLa cells with or without AS treatment. Cells were transfected with NWT or NF17A mutant with a GFP tag for 48 h and then treated with or without AS treatment for 45 min. Values and error bars were represented as the mean ± SEM of three independent biological replicates. Statistical analysis was performed with one-way ANOVA. ns > 0.05, *P < 0.05. ns, not significant. (G) The NF17A protein fails to enter deaminase-containing condensates, impairing deaminases-mediated RNA editing activity on N protein mRNA. Values and error bars were represented as the mean ± SEM of three independent biological replicates (allelic fraction ≥0.02%). Statistical analysis was performed with an unpaired t-test. ns > 0.05, **P < 0.01. ns, not significant. (H) Average proportion of nucleotide changes in the SARS-CoV-2 transcriptomes. Values and error bars were represented as the mean ± SEM of three independent biological replicates. Statistical analysis was performed with unpaired t-test. ns >0.05, *P < 0.05, **P < 0.01. ns, not significant. (I) Fold change in the number of SNVs in the SARS-CoV-2 transcriptomes of infected cells with or without AS treatment. Values and error bars were represented as the mean ± SEM of three independent biological replicates. Statistical analysis was performed with a one-way ANOVA test. ns > 0.05, *P < 0.05, **P < 0.01, ***P < 0.001, ****P < 0.0001. ns, not significant. (J) Allelic fraction of SNVs for C900T, A4870G, C20270T and G29528A in the SARS-CoV-2 transcriptomes. Values and error bars were represented as the mean ± SEM of three independent biological replicates. Statistical analysis was performed with a one-way ANOVA test. ns >0.05, ****P < 0.0001. ns not significant. Source data are available online for this figure.
Figure 5
Figure 5. The RNA binding domain is essential for ADAR2 association with the N protein to form phase separation-mediated condensates.
(A) Schematic domain structure of ADAR2. (B) Characterization of ADAR2 mutants required for the interaction with the N protein. HeLa cells were co-transfected with plasmids encoding the N protein and either Flag control or various Flag-tagged ADAR2 truncations. (C) Characterization of ADAR2 mutants required for SG localization. HeLa cells co-transfected with the N gene and BFP-tagged ADAR2 mutants were treated with AS for 45 min to induce SG formation, followed by immunostaining for the N protein and G3BP1. (D) Time-lapse microscopy of RNA-induced RBD1 phase separation. Liquid droplets formed upon mixing of ADAR2-RBD1 protein with 75 ng/μL RNA. (E) Quantification of fluorescence intensity of ADAR2-RBD1 liquid droplets in the presence of 75 ng/μL RNA. Values and error bars were represented as the mean ± SEM of five independent biological replicates. (F) FRAP analysis of ADAR2-RBD1 liquid droplets formed in the presence of RNA. The dotted square displays the photobleached region. Values represent mean ± SEM from n = 30 droplets. Scale bar, 10 μm. (G) Column scatter charts displaying the droplet area from experiments related to Appendix Fig. S11B. Values and error bars were represented as the mean ± SEM of 10 independent images. Statistical analysis was performed with a two-tailed unpaired t-test. ****P < 0.0001. Source data are available online for this figure.
Figure 6
Figure 6. Functional characteristics of coronavirus N proteins.
(A) Domain structure (top) and sequence features (bottom) of the N proteins from MERS-CoV, SARS-CoV-2, bat-CoV, civet-CoV, pangolin-CoV and SARS-CoV. The domains of the N proteins were aligned with the disorder propensity calculated by the DISOPRED3 server. (B) Sequence alignment of six related coronavirus N proteins (MERS-CoV, SARS-CoV-2, bat-CoV, civet-CoV, pangolin-CoV and SARS-CoV) showing the N terminal IDR. (C) Interaction assay between the N proteins and APOBEC3G (A3G). HeLa cells were co-transfected with plasmids encoding GFP-tagged N proteins from MERS-CoV, SARS-CoV-2, bat-CoV, civet-CoV, pangolin-CoV and SARS-CoV or GFP control, and mCherry-tagged A3G. (D) N proteins from MERS-CoV, SARS-CoV-2, bat-CoV, civet-CoV, pangolin-CoV and SARS-CoV exhibit the ability to co-localize with A3G in SGs in HeLa cells. Cells co-transfected with the N protein and A3G were treated with AS for 45 min to induce SG formation, followed by immunostaining for N protein, A3G and endogenous G3BP1. Scale bar: 20 μm. (E) Quantification of condensates with co-localization of N protein and deaminase in fixed HeLa cells. Values and error bars were represented as the mean ± SEM of ten independent biological replicates. Statistical analysis was performed with a one-way ANOVA test. ns > 0.05, ****P < 0.0001. ns, not significant. (F) Fold change of SNVs number in the N protein transcriptome (MERS-CoV and SARS-CoV) in cells treated with or without AS. Values and error bars were represented as the mean ± SEM of three independent biological replicates (allelic fraction ≥0.03%). Statistical analysis was performed with an unpaired t-test. ns > 0.05, *P < 0.05, ***P < 0.001, ns, not significant. The number of SNVs with A > G/C > T mutations was normalized to the number of control group. (G) SNVs frequency in the N protein transcriptome (MERS-CoV and SARS-CoV) in cells treated with or without AS. Values and error bars were represented as the mean ± SEM of three independent biological replicates. Statistical analysis was performed with an unpaired t-test. ns >0.05, ****P < 0.0001. ns not significant. Source data are available online for this figure.
Figure EV1
Figure EV1. Co-localization of N Protein with AID and A3H in SGs.
(A) AID co-localizes with N protein in SGs in HeLa cells. HeLa cells were transfected with the N gene and AID, then treated with AS for 45 min to induce SG formation, followed by immunostaining for N protein, AID and G3BP1. Scale bar: 20 μm. (B) A3H co-localizes with N protein in SGs in HeLa cells. HeLa cells were transfected with the N gene and A3H, then treated with AS for 45 min to induce SG formation, followed by immunostaining for N protein, A3H and G3BP1. Scale bar: 20 μm.
Figure EV2
Figure EV2. Specific co-localization of N protein with host deaminases under diverse stress conditions.
(AC) A3G or ADAR2 co-localizes with N protein in SGs in response to various stressors. HeLa cells were transfected with the N gene and A3G or ADAR2, and treated with polyI:C for 7 h (A), DTT for 1 h (B) or sorbitol for 1 h (C) to induce SG formation, followed by immunostaining for N protein, A3G or ADAR2 and G3BP1. Scale bar: 20 μm.
Figure EV3
Figure EV3. The lack of G3BP1/2 disrupts the formation of N protein-deaminase complex-containing RNA condensates.
(A) CRISPR-Cas9-mediated G3BP1/2 knockout in HeLa cells. (B) G3BP1/2 dKO HeLa cells fail to form SGs under AS-induced stress. HeLa cells with or without G3BP1/2 dKO were treated with AS for 45 min to induce SG formation, followed by immunostaining for the endogenous G3BP1 (GFP) and endogenous TIA1 (red). Scale bar: 20 μm. (C) Quantification of SGs, expressed as the percentage of cells containing SGs in fixed HeLa cells with or without G3BP1/2 dKO. Data are shown as means ± SEM (n = 10 independent images). Statistical analysis was performed with a two-tailed unpaired t-test. ****P < 0.0001. (D) Depletion of G3BP1/2 abolishes the localization of ADAR1/2 in SGs under stress. HeLa cells with or without G3BP1/2 dKO were treated with AS for 45 min to induce SG formation, followed by immunostaining for endogenous G3BP1 and endogenous ADAR1 or ADAR2. Scale bar: 20 μm. Source data are available online for this figure.
Figure EV4
Figure EV4. Functional characteristics of coronavirus N protein.
(A) Interaction assay between N protein and ADAR2. HeLa cells were co-transfected with plasmids encoding GFP-tagged N proteins of MERS-CoV, SARS-CoV-2, bat-CoV, civet-CoV, pangolin-CoV and SARS-CoV or GFP control, and HA-tagged ADAR2. Cell lysates were immunoprecipitated with an anti-GFP antibody, and the expressed proteins were analyzed by western blotting. (B) N proteins from MERS-CoV, SARS-CoV-2, bat-CoV, civet-CoV, pangolin-CoV and SARS-CoV exhibit the ability to co-localize with ADAR1 in SGs in HeLa cells. HeLa cells transfected with various N proteins were treated with AS for 45 min to induce SG formation, followed by immunostaining for N protein, ADAD1 and G3BP1. Scale bar: 20 μm. (C) N proteins from MERS-CoV, SARS-CoV-2, bat-CoV, civet-CoV, pangolin-CoV and SARS-CoV exhibit the ability to co-localize with ADAR2 in SGs in HeLa cells. HeLa cells transfected with various N proteins were treated with AS for 45 min to induce SG formation, followed by immunostaining for N protein, ADAD2 and G3BP1. Scale bar: 20 μm. (D) Quantification of condensates with co-localization of N protein and deaminase in fixed HeLa cells. Data are shown as mean ± SEM (n = 10 independent images). Statistical analysis was performed with a one-way ANOVA test. ns > 0.05, ns, not significant.

Similar articles

Cited by

References

    1. Aizawa H, Sawada J, Hideyama T, Yamashita T, Katayama T, Hasebe N, Kimura T, Yahara O, Kwak S (2010) TDP-43 pathology in sporadic ALS occurs in motor neurons lacking the RNA editing enzyme ADAR2. Acta Neuropathol 120:75–84 - PubMed
    1. Alberti S (2017) Phase separation in biology. Curr Biol 27:R1097–R1102 - PubMed
    1. Antoniou D, Schwartz SD (2016) Phase space bottlenecks in enzymatic reactions. J Phys Chem B 120:433–439 - PMC - PubMed
    1. Banani SF, Lee HO, Hyman AA, Rosen MK (2017) Biomolecular condensates: organizers of cellular biochemistry. Nat Rev Mol Cell Biol 18:285–298 - PMC - PubMed
    1. Bass BL (2002) RNA editing by adenosine deaminases that act on RNA. Annu Rev Biochem 71:817–846 - PMC - PubMed

MeSH terms