. 2025 Jan;44(1):30-53.
doi: 10.1038/s44318-024-00285-0. Epub 2024 Nov 20.

FNDC1 is a myokine that promotes myogenesis and muscle regeneration

Affiliations

FNDC1 is a myokine that promotes myogenesis and muscle regeneration

Rui Xin Zhang et al. EMBO J. 2025 Jan.

Abstract

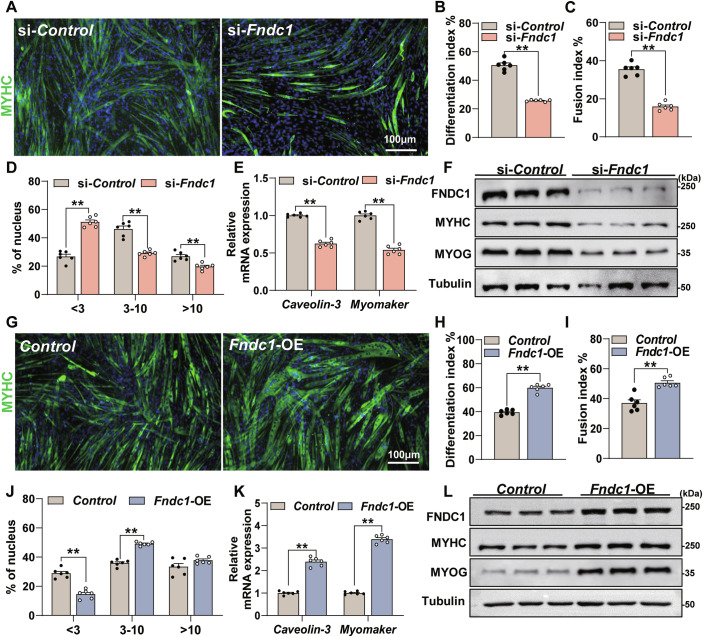
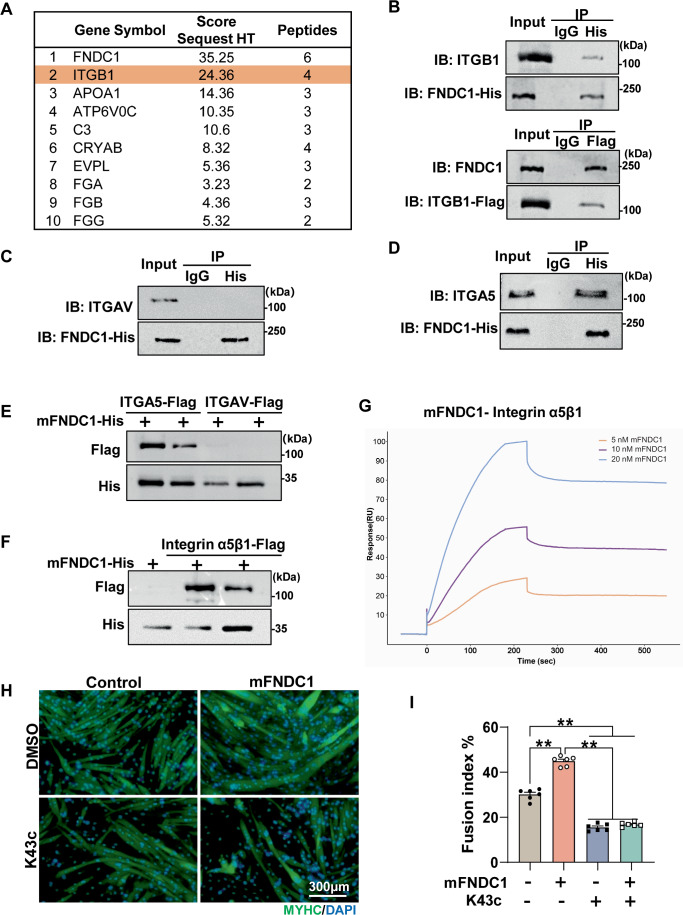
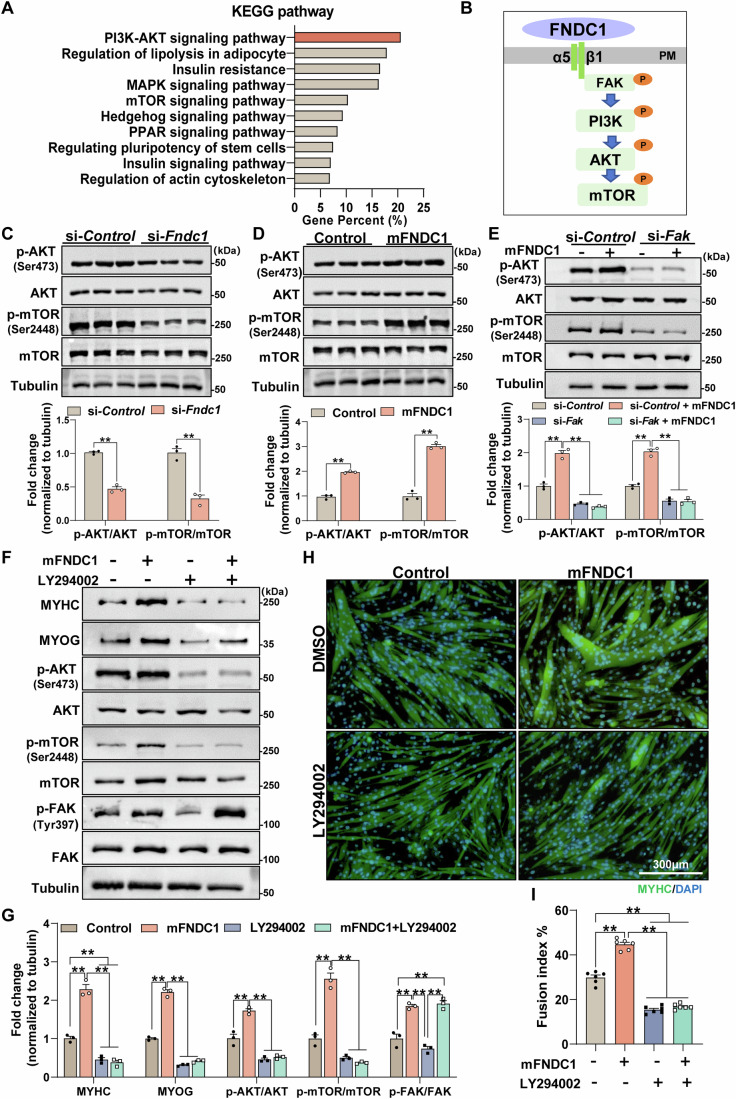
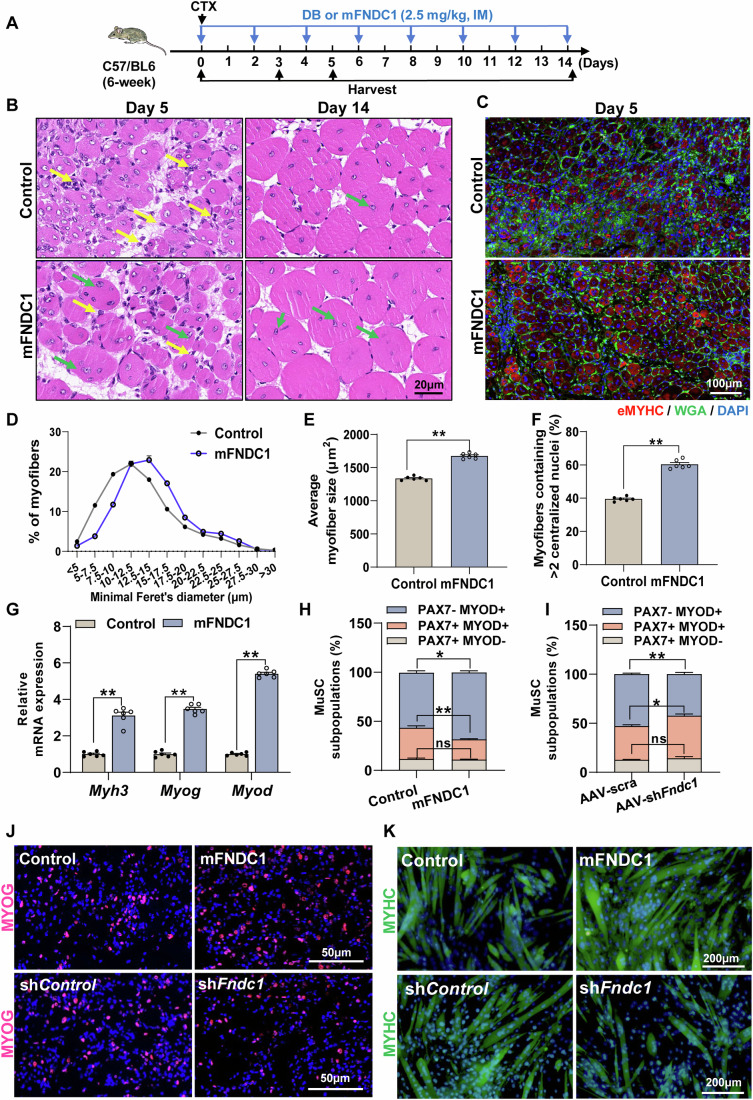
Myogenesis is essential for skeletal muscle formation and regeneration after injury, yet its regulators are largely unknown. Here we identified fibronectin type III domain containing 1 (FNDC1) as a previously uncharacterized myokine. In vitro studies showed that knockdown of Fndc1 in myoblasts reduces myotube formation, while overexpression of Fndc1 promotes myogenic differentiation. We further generated recombinant truncated mouse FNDC1 (mFNDC1), which retains reliable activity in promoting myoblast differentiation in vitro. Gain- and loss-of-function studies collectively showed that FNDC1 promotes cardiotoxin (CTX)-induced muscle regeneration in adult mice. Furthermore, recombinant FNDC1 treatment ameliorated pathological muscle phenotypes in the mdx mouse model of Duchenne muscular dystrophy. Mechanistically, FNDC1 bound to the integrin α5β1 and activated the downstream FAK/PI3K/AKT/mTOR pathway to promote myogenic differentiation. Pharmacological inhibition of integrin α5β1 or of the downstream FAK/PI3K/AKT/mTOR pathway abolished the pro-myogenic effect of FNDC1. Collectively, these results suggested that myokine FNDC1 might be used as a therapeutic agent to regulate myogenic differentiation and muscle regeneration for the treatment of acute and chronic muscle disease.

Keywords: FNDC1; Integrin α5β1; Muscle Regeneration; Myogenic Differentiation.


Conflict of interest statement

Disclosure and competing interests statement. The authors declare no competing interests.

Figures

Figure 1
Figure 1. FNDC1 is closely associated with myogenesis.
(A) Venn diagram showing fifteen overlapping differentially expressed genes among four independent microarray datasets related to myogenesis. (B) mRNA expression of Myh3, Fndc1, Gng2, Pltp, Ctsc, and Rgs2 in primary myoblasts during myogenic differentiation (n = 5 independent experiments). Two-tailed t-test, P = 6.5 × 10−8, P = 1.23 × 10−7, P = 5.95 × 10−5, P = 1.54 × 10−6, P = 5.97 × 10−3, and P = 0.0477 for Myh3, Fndc1, Gng2, Pltp, Ctsc, and Rgs2, respectively. (C) mRNA expression of Myh3, Fndc1, Gng2, Pltp, Ctsc, and Rgs2 in C2C12 cells during myogenic differentiation (n = 3 independent experiments). One-way ANOVA, 0 d vs. 2 d, P = 6.63 × 10−4, 0 d vs. 4 d, P = 4.80 × 10−8, 0 d vs. 6 d and P = 1.12 × 10−8 for Myh3; 0 d vs. 2 d, P = 8.19 × 10−6, 0 d vs. 4 d, P = 3.59 × 10−6, 0 d vs. 6 d, P = 1.05 × 10−6 for Fndc1; 0 d vs. 2 d, P = 0.2487, 0 d vs. 4 d, P = 7.03 × 10−4 and 0 d vs. 6 d and P = 3.34 × 10−5 for Gng2; 0 d vs. 2 d, P = 0.8222, 0 d vs. 4 d, P = 5.06 × 10−5 and 0 d vs. 6 d, P = 7.90 × 10−6 for Pltp; 0 d vs. 2 d, P = 0.5834, 0 d vs. 4 d, P = 3.78 × 10−5 and 0 d vs. 6 d, P = 3.20 × 10−5 for Ctsc; and 0 d vs. 2 d, P = 3.94 × 10−3, 0 d vs. 4 d, P = 0.1819 and 0 d vs. 6 d, P = 0.1222 for Rgs2. (D, E) Representative immunoblotting of MYOD, MYOG, MYHC, and FNDC1 in primary myoblasts or C2C12 cells during myogenic differentiation. (F) mRNA expression of Fndc1 and Myog in the tibialis anterior (TA) muscle of cardiotoxin (CTX) injured WT mice (n = 6 mice). One-way ANOVA, 0 d vs. 3 d, P = 1.69 × 10−8, 0 d vs. 5 d, P = 6.04 × 10−12 and 0 d vs. 14 d, P = 0.0204 for Fndc1; 0 d vs. 3 d, P = 2.70 × 10−14, 0 d vs. 5 d, P = 2.3 × 10−14 and 0 d vs. 14 d, P = 0.0454 for Myog. (G) Representative immunofluorescence staining of FNDC1+ fibers (in red) in untreated or CTX-treated TA muscle at day 5 post-injury. Cell membrane was stained with WGA (in green) and nuclei were counterstained with DAPI (in blue) (n = 6 mice). Scale bar = 20 μm. (H) mRNA expression of Fndc1 and Myog in TA muscle of WT or mdx mice (n = 6 mice). Two-tailed t-test, P = 3.27 × 10−9 and P = 2.16 × 10−7 for Fndc1 and Myog, respectively. (I) Representative immunofluorescence staining of FNDC1+ fibers (in red) in TA muscle of WT or mdx mice. Cell membrane was stained with WGA (in green) and nuclei were counterstained with DAPI (in blue) (n = 6 mice). Scale bar = 20 μm. Data are represented as mean ± SEM. *p < 0.05, **p < 0.01, and ***p < 0.001. Source data are available online for this figure.
Figure 2
Figure 2. FNDC1 promotes myoblast differentiation-mediated myogenesis in vitro.
(A) Representative immunofluorescence staining of MYHC in si-Control or si-Fndc1 (Fndc1 knockdown) C2C12 cells at day 4 post-differentiation (n = 6 independent experiments). Staining for MYHC (in green) marks differentiated cells, and nuclei were counterstained with DAPI (in blue). C2C12 cells were transfected with si-Control or si-Fndc1 for 12 h before the initiation of differentiation. Scale bars = 100 μm. (B) Quantification of the differentiation index (n = 6 independent experiments). Two-tailed t-test, P = 2.99 × 10−8. (C, D) Quantification of fusion index (a MYHC+ cell with at least three nucleus) and the nucleus distribution per myotube (n = 6 independent experiments). (C) Two-tailed t-test, P = 1.70 × 10−7. (D) Two-tailed t-test, nucleus distribution per myotube <3, P = 1.70 × 10−7; nucleus distribution per myotube 3–10, P = 1.64 × 10−5 and nucleus distribution per myotube >10, P = 8.73 × 10−4. (E) mRNA expression of Caveolin-3 and Myomaker (n = 6 independent experiments). Two-tailed t-test, P = 5.71 × 10−9 and P = 4.12 × 10−8 for Caveolin-3 and Myomaker, respectively. (F) Representative immunoblot analysis of FNDC1, MYHC, and MYOG (n = 3 independent experiments). Cells were collected at day 4 post-differentiation. (G) Representative immunofluorescence staining of MYHC (in green) in Control (empty vector) or Fndc1-overexpressing (Fndc1-OE) C2C12 cells at day 4 post-differentiation. Scale bars = 100 μm. (H) Quantification of differentiation index (n = 6 independent experiments). Two-tailed t-test, P = 1.11 × 10−7. (I, J) Quantification of fusion index and the nucleus distribution per myotube (n = 6 independent experiments). (I) Two-tailed t-test, P = 3.20 × 10−4. (J) Two-tailed t-test, nucleus distribution per myotube <3, P = 1.41 × 10−5; nucleus distribution per myotube 3–10, P = 1.41 × 10−7 and nucleus distribution per myotube >10, P = 0.0992; (K) mRNA expression of Caveolin-3 and Myomaker (n = 6 independent experiments). Two-tailed t-test, P = 1.64 × 10−8 and P = 1.98 × 10−11 for Caveolin-3 and Myomaker, respectively. (L) Representative immunoblot analysis of FNDC1, MYHC, and MYOG in Control or Fndc1-OE C2C12 cells (n = 3 independent experiments). Cells were collected at day 4 post-differentiation. Data are represented as mean ± SEM. **p < 0.01. Source data are available online for this figure.
Figure 3
Figure 3. FNDC1 is a novel myokine.
(A) Representative immunoblot analysis of medium FNDC1 in C2C12 cells at days 0, 3, or 6 post-differentiations. For determination of released FNDC1, equal volumes of conditioned media were subjected to western blot analysis; Ponceau S staining was used as a loading control. (B) Medium FNDC1 levels in C2C12 cells at days 0, 3, or 6 post-differentiation (n = 6 independent experiments). One-way ANOVA, 0 d vs. 3 d, P = 1.53 × 10−8 and 0 d vs. 6 d, P = 6.48 × 10−12. (C, D) Serum levels of FNDC1 in CTX-injured mice (C) and mdx mice (D) (n = 6 mice). (C) One-way ANOVA, Uninjured vs. 3 d, P = 1.14 × 10−3; Uninjured vs. 5 d, P = 1.79 × 10−10 and Uninjured vs. 14 d, P = 0.2061. (D) Two-tailed t-test, P = 1.01 × 10−5. (E) Representative immunofluorescence staining of MYHC (in green) in C2C12 cells differentiated for 4 days after transfection with Control (empty vector), FNDC1-FL, FNDC1-FN3, or FNDC1-PHA. Scale bar = 300 μm. (F, G) Quantification of the fusion index (a MYHC+ cell with at least three nucleus) and the nucleus distribution per myotube (n = 6 independent experiments). (F) One-way ANOVA, Control vs. FNDC1-FL, P = 1.56 × 10−13; Control vs. FNDC1-FN3, P = 1.49 × 10−12; FNDC1-FL vs. FNDC1-PHA, P = 8.75 × 10−13 and FNDC1-PHA vs. FNDC1-FN3, P = 1.06 × 10−11. (G) One-way ANOVA, Control vs. FNDC1-FL, P = 1.04 × 10−6; Control vs. FNDC1-FN3, P = 3.76 × 10−7; FNDC1-FL vs. FNDC1-PHA, P = 9.10 × 10−6; FNDC1-PHA vs. FNDC1-FN3, P = 3.06 × 10−6 for nucleus distribution per myotube <3; Control vs. FNDC1-FL, P = 0.0132; Control vs. FNDC1-FN3, P = 0.0295; FNDC1-FL vs. FNDC1-PHA, P = 0.0010; FNDC1-PHA vs. FNDC1-FN3, P = 0.0024 for nucleus distribution per myotube 3–10; Control vs. FNDC1-FL, P = 4.65 × 10−6; Control vs. FNDC1-FN3, P = 0.0021; FNDC1-FL vs. FNDC1-PHA, P = 5.28 × 10−5; FNDC1-PHA vs. FNDC1-FN3, P = 0.0024 for nucleus distribution per myotube >10. (H) Representative immunoblotting of MYHC and MYOG in cells transfected with Control (empty vector), FNDC1-FL, FNDC1-FN3 or FNDC1-PHA (n = 3 independent experiments). Cells were collected at day 4 post-differentiation. (I) mRNA expression of Caveolin-3 and Myomaker (n = 6 independent experiments). One-way ANOVA, Control vs. FNDC1-FL, P = 2.04 × 10−12; Control vs. FNDC1-FN3, P = 1.26 × 10−10; FNDC1-FL vs. FNDC1-PHA, P = 3.36 × 10−12; FNDC1-PHA vs. FNDC1-FN3, P = 2.29 × 10−10 for Caveolin-3. Control vs. FNDC1-FL, P = 3.72 × 10−12; Control vs. FNDC1-FN3, P = 1.83 × 10−12; FNDC1-FL vs. FNDC1-PHA, P = 4.48 × 10−13; FNDC1-PHA vs. FNDC1-FN3, P = 2.39 × 10−13 for Myomaker. (J) Coomassie-stained SDS-PAGE of protein fractions. M represents protein marker. (K) Reverse-phase high-performance liquid chromatography with absorption at 280 nm with visible single peak pattern. (L) Representative MS analysis of the recombinant mFNDC1 protein showing high purity by sum PEP score and number of unique peptides. (M) Representative immunofluorescence staining of MYHC (in green) in C2C12 cells treated with different concentrations mFNDC1 at day 4 post differentiation. Nuclei were counterstained with DAPI (in blue). Scale bars = 50 μm. (N) Quantification of differentiation index (n = 6 independent experiments). One-way ANOVA, 0 vs. 0.01, P = 2.55 × 10−7; 0 vs. 0.1, P = 9.68 × 10−9; 0 vs. 1, P = 1.21 × 10−13. (O) Quantification of the fusion index (a MYHC+ cell with at least three nucleus) (n = 6 independent experiments). One-way ANOVA, 0 vs. 0.01, P = 1.34 × 10−7; 0 vs. 0.1, P = 5.30 × 10−12; 0 vs. 1, P = 2.3 × 10−14. Data are represented as mean ± SEM. *p < 0.05 and **p < 0.01. Source data are available online for this figure.
Figure 4
Figure 4. Integrin α5β1 is the receptor for FNDC1 in myoblast.
(A) The top 10 proteins enriched with FNDC1 by cross-linking/Co-IP/MS analysis. (B) Co-IP of FNDC1 and Integrin β1 (ITGB1) in C2C12 cells. (C, D) Immunoprecipitation of FNDC1 and Integrin αv (ITGAV) or Integrin α5 (ITGA5) in C2C12 cells. (E, F) Pull-down assays. 100 nM His-tagged FNDC1 (truncated recombinant FNDC1 protein) was incubated with the indicated Flag-tagged integrin (5 nM) and then affinity adsorbed through a nickel column. Immunoblotting was performed to analyze protein interactions between integrins (α5 or αv) and mFNDC1 (E) or to analyze protein interaction between integrin α5β1 and mFNDC1 (F). (G) Surface plasmon resonance analysis of the FNDC1-Intergrin α5β1 interaction. Numbers above curves indicate the analyte concentration tested. All experiments were performed in triplicate with a mobile phase of HBS-EP. (H) Representative immunofluorescence staining of MYHC (in green) in C2C12 cells treated with Control or mFNDC1 4 days post-differentiation in the presence or absence of K43c. Scale bars = 300 μm. (I) Quantification of fusion index (a MYHC+ cell with at least three nucleus) (n = 6 independent experiments). One-way ANOVA, Control vs. mFNDC1, P = 8.87 × 10−11; Control vs. K43c, P = 1.15 × 10−10; Control vs. mFNDC1 + K43c, P = 6.10 × 10−10; mFNDC1 vs. K43c, P = 2.30 × 10−14; mFNDC1 vs. mFNDC1 + K43c, P = 2.30 × 10−14. Data are represented as mean ± SEM. **p < 0.01. Source data are available online for this figure.
Figure 5
Figure 5. FNDC1 improves myogenesis through activating the Integrin/FAK/AKT/mTOR pathway.
(A) The KEGG signaling pathways in Fndc1 knockdown and control C2C12 cells after 4 days of differentiation. (B) Model of typical integrin signaling. Ligand FNDC1 binds to integrin, resulting in the phosphorylation of FAK (Tyr397) followed by phosphorylation of PI3K, AKT, and mTOR. PM, plasma membrane. (C, D) Representative immunoblotting and quantification of total and phosphorylated AKT (Ser473) and mTOR (Ser2448) in si-Fndc1 or mFNDC1-treated C2C12 cells (n = 3 independent experiments). (C) Two-tailed t-test, P = 1.07 × 10−4 and P = 1.05 × 10−3 for p-AKT/AKT and p-mTOR/mTOR, respectively. (D) Two-tailed t-test, P = 8.40 × 10−5 and P = 1.02 × 10−4 for p-AKT/AKT and p-mTOR/mTOR, respectively. (E) Representative immunoblotting and quantification of total and phosphorylated AKT (Ser473) and mTOR (Ser2448) in si-control or si-Fak C2C12 cells treated with Control or mFNDC1 (n = 3 independent experiments). One-way ANOVA, si-Control vs. si-Control+mFNDC1, P = 5.67 × 10−6; si-Control+mFNDC1 vs. si-Fak, P = 1.65 × 10−7; si-Control+mFNDC1 vs. si-Fak + mFNDC1, P = 9.54 × 10−8 for p-AKT/AKT; si-Control vs. si-Control+mFNDC1, P = 5.46 × 10−6; si-Control+mFNDC1 vs. si-Fak, P = 3.08 × 10−7; si-Control+mFNDC1 vs. si-Fak + mFNDC1, P = 2.81 × 10−7 for p-mTOR/mTOR. (F, G) Representative immunoblotting analysis and quantification of indicated proteins in control (DMSO) or LY294002 (PI3Ks inhibitor) treated C2C12 cells receiving control or mFNDC1 (n = 3 independent experiments). One-way ANOVA, Control vs. mFNDC1, P = 1.10 × 10−5; Control vs. LY294002, P = 0.0039; Control vs. mFNDC1 + LY294002, P = 0.0018, mFNDC1 vs. LY294002, P = 6.88 × 10−7, mFNDC1 vs. mFNDC1 + LY294002, P = 4.95 × 10−7 for MYHC; Control vs. mFNDC1, P = 4.68 × 10−8, mFNDC1 vs. LY294002, P = 3.60 × 10−9, mFNDC1 vs. mFNDC1 + LY294002, P = 5.28 × 10−9 for MYOG; Control vs. mFNDC1, P = 1.93 × 10−4, mFNDC1 vs. LY294002, P = 2.81 × 10−6, mFNDC1 vs. mFNDC1 + LY294002, P = 4.11 × 10−6 for p-AKT/AKT; Control vs. mFNDC1, P = 1.03 × 10−5, mFNDC1 vs. LY294002, P = 1.25 × 10−6, mFNDC1 vs. mFNDC1 + LY294002, P = 7.72 × 10−7 for p-mTOR/mTOR; Control vs. mFNDC1, P = 3.23 × 10−4, Control vs. mFNDC1 + LY294002, P = 1.92 × 10−4, mFNDC1 vs. LY294002, P = 4.62 × 10−5, LY294002 vs. mFNDC1 + LY294002, P = 3.03 × 10−5 for p-FAK/FAK. (H) Representative immunofluorescence staining of MYHC (in green) in control (DMSO) or LY294002 treated C2C12 cells receiving Control or mFNDC1 for 4 days post differentiation. Nuclei are counterstained with DAPI (in blue). Scale bars = 300 μm. (I) Quantification of fusion index (a MYHC+ cell with at least three nucleus) (n = 6 independent experiments). One-way ANOVA, Control vs. mFNDC1, P = 4.87 × 10−10; Control vs. LY294002, P = 7.98 × 10−10; Control vs. mFNDC1 + LY294002, P = 4.73 × 10−9, mFNDC1 vs. LY294002, P = 2.5 × 10−14 and mFNDC1 vs. mFNDC1 + LY294002, P = 2.7 × 10−14. Data are represented as mean ± SEM. **p < 0.01. Source data are available online for this figure.
Figure 6
Figure 6. FNDC1 promotes skeletal muscle regeneration in CTX-induced muscle injury in mice.
(A) Experimental procedures. CTX-treated mice (6-week-old C57BL/6J) were either given Control (dialysis buffer, DB) or mFNDC1 (2.5 mg/kg body weight) every 2 days via intramuscular injection (IM) for two weeks starting with the treatment of CTX. (B) Representative H&E staining of TA muscle sections at days 5 and 14 post-injury in Control or mFNDC1-treated mice (n = 6 mice). Yellow arrows indicate inflammatory infiltrates and green arrows indicate newborn muscle fibers. Scale bar = 20 μm. (C) Representative immunofluorescence staining of eMYHC+ fibers in Control or mFNDC1-treated TA muscle at day 5 post-injury (n = 6 mice). Staining for eMYHC (in red) marks the newborn myofibrils. Cell membrane was stained with WGA (in green) and nuclei were counterstained with DAPI (in blue). Scale bar = 100 μm. (D, E) Frequency distribution of minimal Feret’s diameter and average CSA of eMYHC+ myofiber in TA muscle from CTX-injured mice treated with Control or mFNDC1 at day 5 post-injury (n = 6 mice). (E) Two-tailed t-test, P = 1.58 × 10−8. (F) Percentage of newly formed myofibers containing two or more central nuclei in muscle fibers from CTX-injured mice at day 5 (n = 6 mice). Two-tailed t-test, P = 8.40 × 10−9. (G) mRNA expression of Myh3, Myog, and Myod (n = 6 mice). Two-tailed t-test, P = 6.12 × 10−7, P = 1.01 × 10−9, and P = 2.30 × 10−13 for Myh3, Myog, and Myod, respectively. (H, I) Quantification of different states of satellite cell (MuSC) in TA muscle from CTX-injured mice receiving mFNDC1 or AAV-shFndc1 at day 5 post-injury (n = 6 mice). (H) Two-tailed t-test, P = 0.5802, P = 0.0060, and P = 0.0128 for PAX7+MYOD-, PAX7+MYOD+, and PAX7-MYOD+, respectively. (I) Two-tailed t-test, P = 0.4170, P = 0.0137, and P = 0.0077 for PAX7+MYOD-, PAX7+MYOD+, and PAX7-MYOD+, respectively. (J) Immunofluorescence staining for MYOG (in red) in satellite cell-derived primary myoblasts after differentiation for 36 h. Isolated satellite cell from WT mice treated with recombinant proteins (Control or mFNDC1) or lentivirus (shControl or shFndc1) were induced to differentiate for 36 h. Scale bars = 50 μm. (K) Representative immunofluorescence staining of MYHC (in green) in satellite cell-derived primary myoblasts treated with mFNDC1 or shFndc1 at day 3 post-differentiation (n = 6 independent experiments). Scale bars = 200 μm. Data are represented as mean ± SEM. *p < 0.05 and **p < 0.01. Source data are available online for this figure.
Figure 7
Figure 7. ITGB1 is essential for FNDC1-promoted skeletal muscle regeneration in CTX-induced muscle injury in mice.
(A) Representative H&E staining of TA muscle from AAV-Scra or AAV-shItgb1 mice at days 5 and 14 post-injury (n = 6 mice). TA muscle from AAV-Scra or AAV-shItgb1 mice were either given Control or mFNDC1 (2.5 mg/kg body weight) every 2 days via intramuscular injection starting with treatment with CTX. Scale bars = 20 μm. (B) Representative immunofluorescence staining of eMYHC+ fibers in TA muscle at day 5 post-injury (n = 6 mice). Staining for eMYHC (in red) marks the newborn myofibrils. Cell membrane was stained with WGA (in green) and nuclei were counterstained with DAPI (in blue). Scale bars = 100 μm. (C, D) Average CSA and frequency distribution of eMYHC+ myofiber minimal Feret’s diameter in TA muscle from Itgb1 knockdown mice treated with Control or mFNDC1 at day 5 post-injury (n = 6 mice). One-way ANOVA, AAV-scra+Control vs. AAV-scra+mFNDC1, P = 1.03 × 10−12; AAV-scra+mFNDC1 vs. AAV-shItgb1+Control, P = 2.6 × 10−14 and AAV-scra+mFNDC1 vs. AAV-shItgb1 + mFNDC1, P = 2.6 × 10−14. (E, F) Representative immunoblotting (E) and quantification (F) of indicated proteins in TA muscle at day 5 post-injury (n = 3 mice). One-way ANOVA, AAV-scra+Control vs. AAV-scra+mFNDC1, P = 4.30 × 10−8; AAV-scra+mFNDC1 vs. AAV-shItgb1+Control, P = 1.04 × 10−8 and AAV-scra+mFNDC1 vs. AAV-shItgb1 + mFNDC1, P = 9.06 × 10−9 for eMYHC. AAV-scra+Control vs. AAV-scra+mFNDC1, P = 2.27 × 10−5; AAV-scra+mFNDC1 vs. AAV-shItgb1+Control, P = 4.64 × 10−7 and AAV-scra+mFNDC1 vs. AAV-shItgb1 + mFNDC1, P = 3.13 × 10−7 for ITGB1; AAV-scra+Control vs. AAV-scra+mFNDC1, P = 1.42 × 10−6; AAV-scra+mFNDC1 vs. AAV-shItgb1+Control, P = 2.13 × 10−8 and AAV-scra+mFNDC1 vs. AAV-shItgb1 + mFNDC1, P = 1.55 × 10−8 for p-FAK/FAK; AAV-scra+Control vs. AAV-scra+mFNDC1, P = 1.58 × 10−5; AAV-scra+mFNDC1 vs. AAV-shItgb1+Control, P = 7.10 × 10−8 and AAV-scra+mFNDC1 vs. AAV-shItgb1 + mFNDC1, P = 6.80 × 10−8 for p-AKT/AKT; AAV-scra+Control vs. AAV-scra+mFNDC1, P = 1.89 × 10−4; AAV-scra+mFNDC1 vs. AAV-shItgb1+Control, P = 8.23 × 10−7 and AAV-scra+mFNDC1 vs. AAV-shItgb1 + mFNDC1, P = 6.54 × 10−7 for p-mTOR/mTOR. Data are represented as mean ± SEM. **p < 0.01. Source data are available online for this figure.
Figure 8
Figure 8. FNDC1 ameliorates the pathological phenotype in mdx mice.
(A) Experimental procedures. Four-week-old mdx mice were intraperitoneally injected with either control (dialysis buffer, DB) or mFNDC1 (2.5 mg/kg body weight) every 2 days for 4 weeks. Samples were collected 6 h after mFNDC1 treatment. (B) Representative images of H&E staining and quantify of TA (top), QUA (middle), and DIA (bottom) muscles from mdx mice treated with Control or mFNDC1 for 4 weeks (n = 6 mice). Scale bar = 40 μm. Two-tailed t-test, P = 2.64 × 10−4, P = 1.44 × 10−6, and P = 6.28 × 10−4 for TA, QUA, and DIA, respectively. (C) mRNA expression of myogenic marker genes Myog and Myh3 (n = 6 mice). One-way ANOVA, WT+Control vs. mdx+Control, P < 1 × 10−15; WT+Control vs. mdx + mFNDC1, P < 1 × 10−15 and mdx+Control vs. mdx + mFNDC1, P < 1 × 10−15 for Myog; WT+Control vs. mdx+Control, P = 3.84 × 10−12; WT+Control vs. mdx + mFNDC1, P < 1 × 10−15 and mdx+Control vs. mdx + mFNDC1, P < 1 × 10−15 for Myh3. (DG) Serum concentrations of CK, TNFα, IL1β, and IL6 in WT and mdx mice treated with mFNDC1 or control for 4 weeks (n = 6 mice). Serum was taken 4 weeks after mFNDC1 treatment from the indicated mouse models. (D) One-way ANOVA, WT+Control vs. mdx+Control, P < 1 × 10−15 and mdx+Control vs. mdx + mFNDC1, P = 1.55 × 10−12 for CK. (E) WT+Control vs. mdx+Control, P < 1 × 10−15, WT+Control vs.mdx + mFNDC1, P = 7.44 × 10−10, and mdx+Control vs. mdx + mFNDC1, P = 4.86 × 10−8 for TNFα. (F) WT+Control vs. mdx+Control, P = 1.31 × 10−10 and mdx+Control vs. mdx + mFNDC1, P = 8.73 × 10−9 for IL1β. (G) WT+Control vs. mdx+Control, P < 1 × 10−15 and mdx+Control vs. mdx + mFNDC1, P = 8.87 × 10−10 for IL6. (H) Representative images of Sirius Red staining of TA (top), QUA (middle), and DIA (bottom) muscles from mdx mice treated with Control or mFNDC1 for 4 weeks (n = 6 mice). Scale bar = 50 μm. (I) mRNA expression of myofiber marker genes (Col1a1, Col3a1, Col5a3, and Fn1) (n = 6 mice). One-way ANOVA, WT+Control vs. mdx+Control, P = 5.37 × 10−11 and mdx+Control vs. mdx + mFNDC1, P = 4.68 × 10−5 for Col1a1; WT+Control vs. mdx+Control, P = 1.10 × 10−8 and mdx+Control vs. mdx + mFNDC1, P = 4.30 × 10−5 for Col3a1; WT+Control vs. mdx+Control, P = 5.74 × 10−7 and mdx+Control vs. mdx + mFNDC1, P = 5.80 × 10−5 for Col5a3; WT+Control vs. mdx+Control, P = 1.05 × 10−6 and mdx+Control vs. mdx + mFNDC1, P = 4.25 × 10−4 for Fn1. Data are represented as mean ± SEM. **p < 0.01. Source data are available online for this figure.
Figure 9
Figure 9. FNDC1 improves muscle performance in mdx mice.
(A, B) Quantification of stride width of hindlimbs (A) and stride length (B) in WT (WT+Control), mdx (mdx+Control), and mFNDC1-treated mdx (mdx + mFNDC1) mice (n = 6 mice). (A) One-way ANOVA, WT+Control vs. mdx+Control, P = 1.81 × 10−8 and mdx+Control vs. mdx + mFNDC1, P = 2.67 × 10−7; (B) One-way ANOVA, WT+Control vs. mdx+Control, P = 5.88 × 10−9, WT+Control vs. mdx + mFNDC1, P = 0.0091 and mdx+Control vs. mdx + mFNDC1, P = 4.17 × 10−7. (C, D) Physical performance was evaluated in age-matched mdx mice by treadmill exhaustion test (n = 6 mice). Time to exhaustion and running distance were measured. (C) One-way ANOVA, WT+Control vs. mdx+Control, P < 1 × 10−15 and mdx+Control vs. mdx + mFNDC1, P = 5.20 × 10−8; (D) One-way ANOVA, WT+Control vs. mdx+Control, P < 1 × 10−15, WT+Control vs. mdx + mFNDC1, P = 2.20 × 10−8 and mdx+Control vs. mdx + mFNDC1, P = 2.93 × 10−9. (E) Fatigability was evaluated by an inverted-grid test, the latency to fall represents an average of two sessions of evaluation normalized to total body weight (n = 6 mice). One-way ANOVA, WT+Control vs. mdx+Control, P = 6.78 × 10−8, WT+Control vs. mdx + mFNDC1, P = 8.04 × 10−4 and mdx+Control vs. mdx + mFNDC1, P = 8.26 × 10−5. (F) Grip strength test in WT and mdx mice treated with Control or mFNDC1 for 4 weeks (n = 12 mice). One-way ANOVA, WT+Control vs. mdx+Control, P = 6.20 × 10−14, WT+Control vs. mdx + mFNDC1, P = 7.70 × 10−14 and mdx+Control vs. mdx + mFNDC1, P = 1.12 × 10−11. (G, H) Quantification of TA muscle twitch and tetanic force (n = 12 mice). Twitch force was produced by the TA muscle under 50 Hz stimulation. Tetanic force was produced by the TA muscle induced by 500 ms at 100 Hz stimulation. (G) One-way ANOVA, WT+Control vs. mdx+Control, P = 6.20 × 10−14, WT+Control vs. mdx + mFNDC1, P = 1.29 × 10−9 and mdx+Control vs. mdx + mFNDC1, P = 6.20 × 10−14. (H) One-way ANOVA, WT+Control vs. mdx+Control, P = 6.20 × 10−14, WT+Control vs. mdx + mFNDC1, P = 6.20 × 10−14 and mdx+Control vs. mdx + mFNDC1, P = 6.80 × 10−14. (I, J) Specific twitch force and tetanic force for TA muscle in WT and mdx mice treated with mFNDC1 or control (n = 12 mice). (I) One-way ANOVA, WT+Control vs. mdx+Control, P = 6.30 × 10−14, WT+Control vs. mdx + mFNDC1, P = 1.34 × 10−8 and mdx+Control vs. mdx + mFNDC1, P = 1.01 × 10−8. (J) One-way ANOVA, WT+Control vs. mdx+Control, P = 6.20 × 10−14, WT+Control vs. mdx + mFNDC1, P = 9.4 × 10−14 and mdx+Control vs. mdx + mFNDC1, P = 6.20 × 10−14. Data are represented as mean ± SEM. **p < 0.01. Source data are available online for this figure.

Similar articles

Cited by

References

    1. Arnold L, Perrin H, de Chanville CB, Saclier M, Hermand P, Poupel L, Guyon E, Licata F, Carpentier W, Vilar J et al (2015) CX3CR1 deficiency promotes muscle repair and regeneration by enhancing macrophage ApoE production. Nat Commun 6:8972 - PMC - PubMed
    1. Barrientos S, Brem H, Stojadinovic O, Tomic-Canic M (2014) Clinical application of growth factors and cytokines in wound healing. Wound Repair Regen 22:569–578 - PMC - PubMed
    1. Boppart MD, Burkin DJ, Kaufman SJ (2006) Alpha7beta1-integrin regulates mechanotransduction and prevents skeletal muscle injury. Am J Physiol Cell Physiol 290:C1660–C1665 - PubMed
    1. Bosma M, Gerling M, Pasto J, Georgiadi A, Graham E, Shilkova O, Iwata Y, Almer S, Soderman J, Toftgard R et al (2016) FNDC4 acts as an anti-inflammatory factor on macrophages and improves colitis in mice. Nat Commun 7:11314 - PMC - PubMed
    1. Burkin DJ, Wallace GQ, Nicol KJ, Kaufman DJ, Kaufman SJ (2001) Enhanced expression of the alpha 7 beta 1 integrin reduces muscular dystrophy and restores viability in dystrophic mice. J Cell Biol 152:1207–1218 - PMC - PubMed

MeSH terms