. 2025 Jan;17(1):169-192.
doi: 10.1038/s44321-024-00167-2. Epub 2024 Nov 20.

Melanin-like nanoparticles slow cyst growth in ADPKD by dual inhibition of oxidative stress and CREB

Affiliations

Melanin-like nanoparticles slow cyst growth in ADPKD by dual inhibition of oxidative stress and CREB

Yongzhan Sun et al. EMBO Mol Med. 2025 Jan.

Abstract

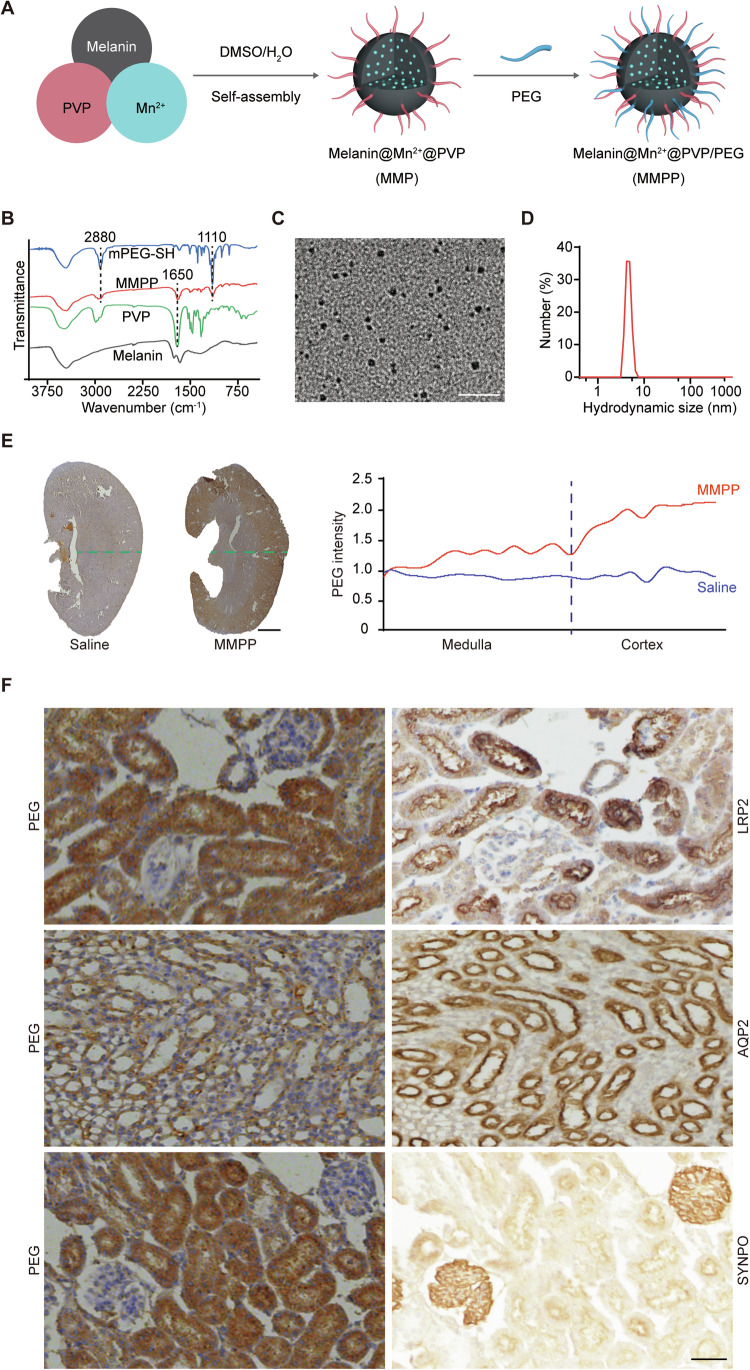
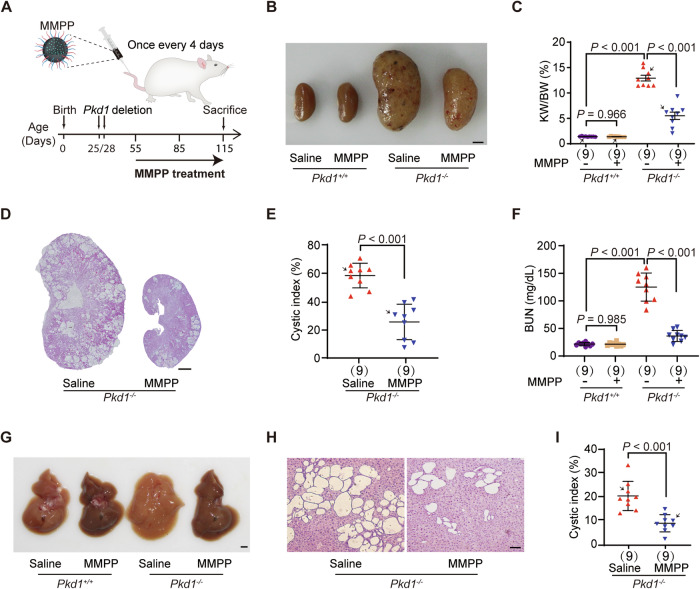
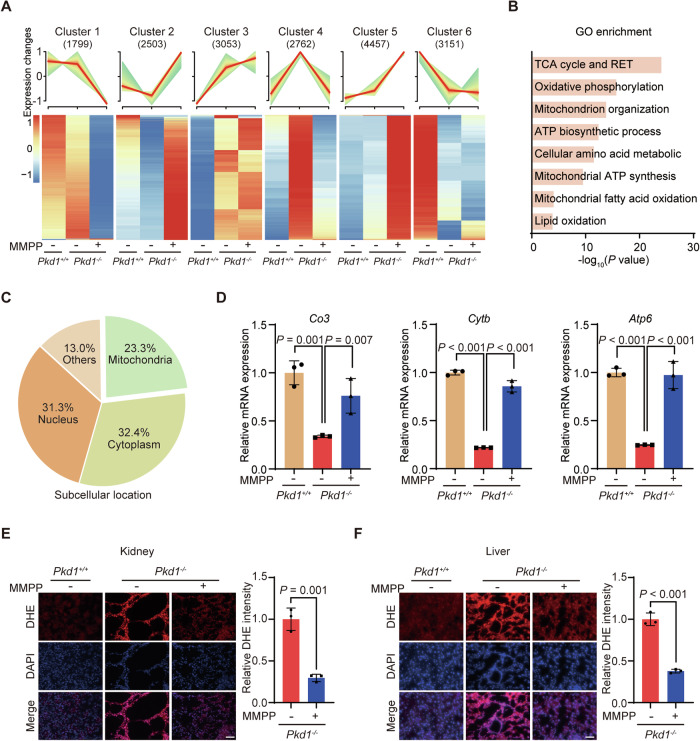
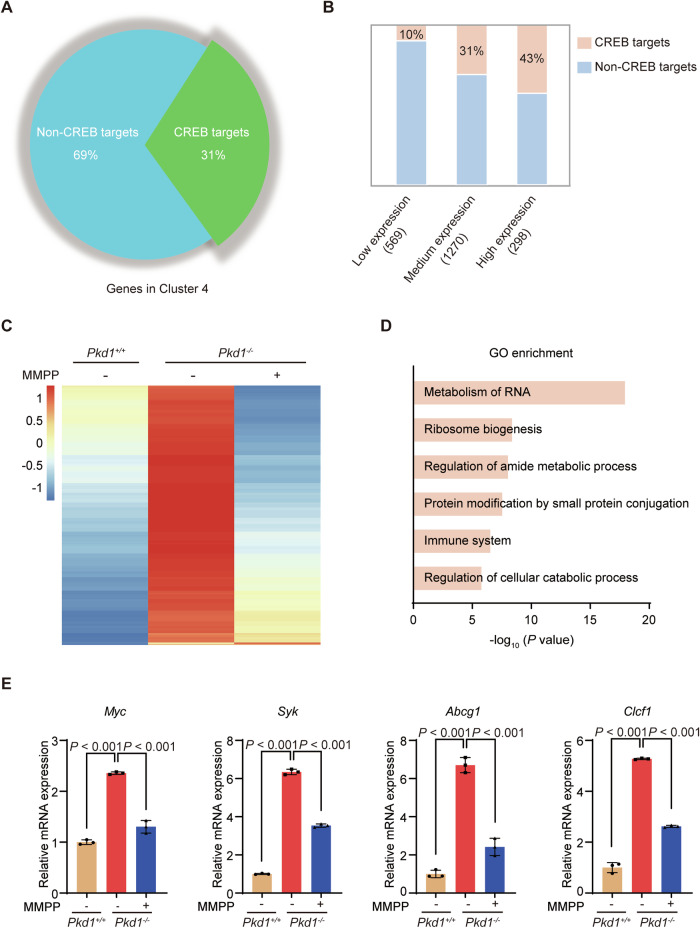
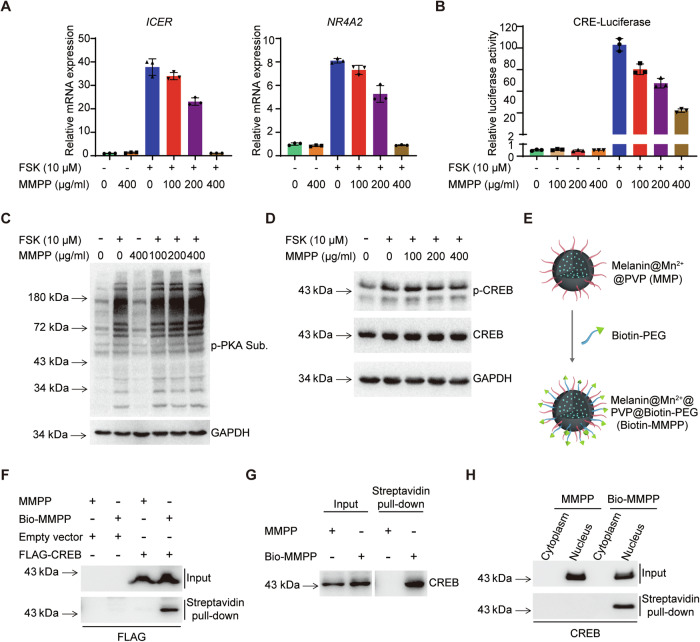
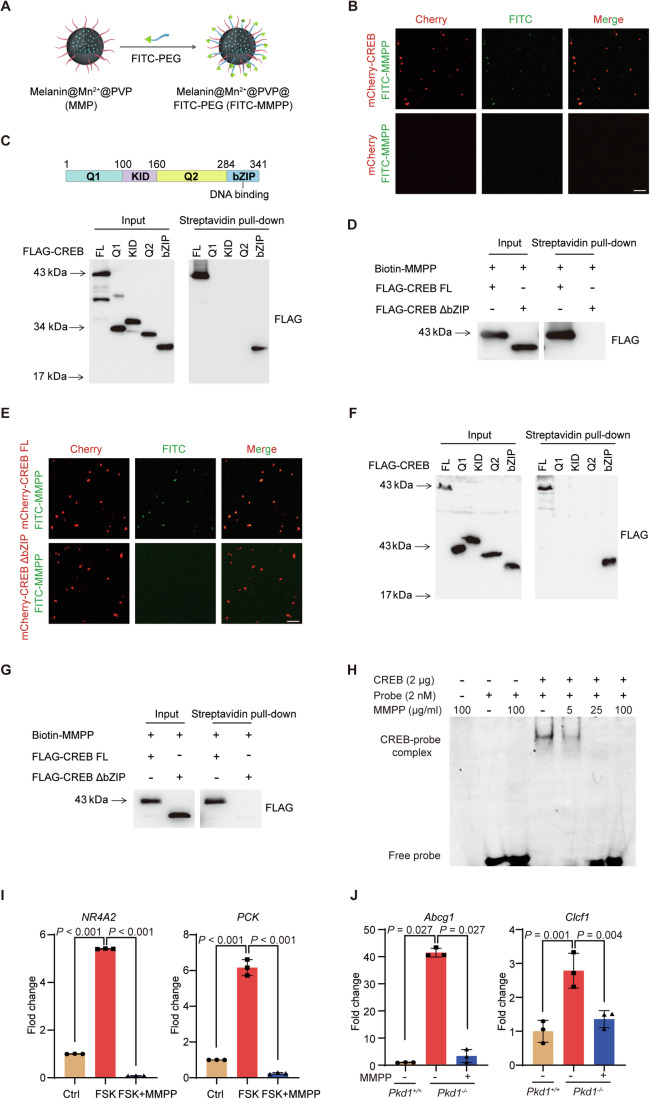
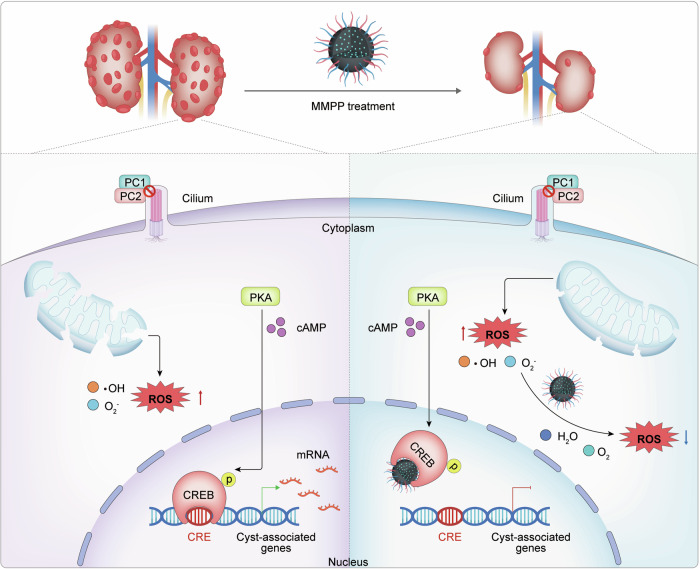
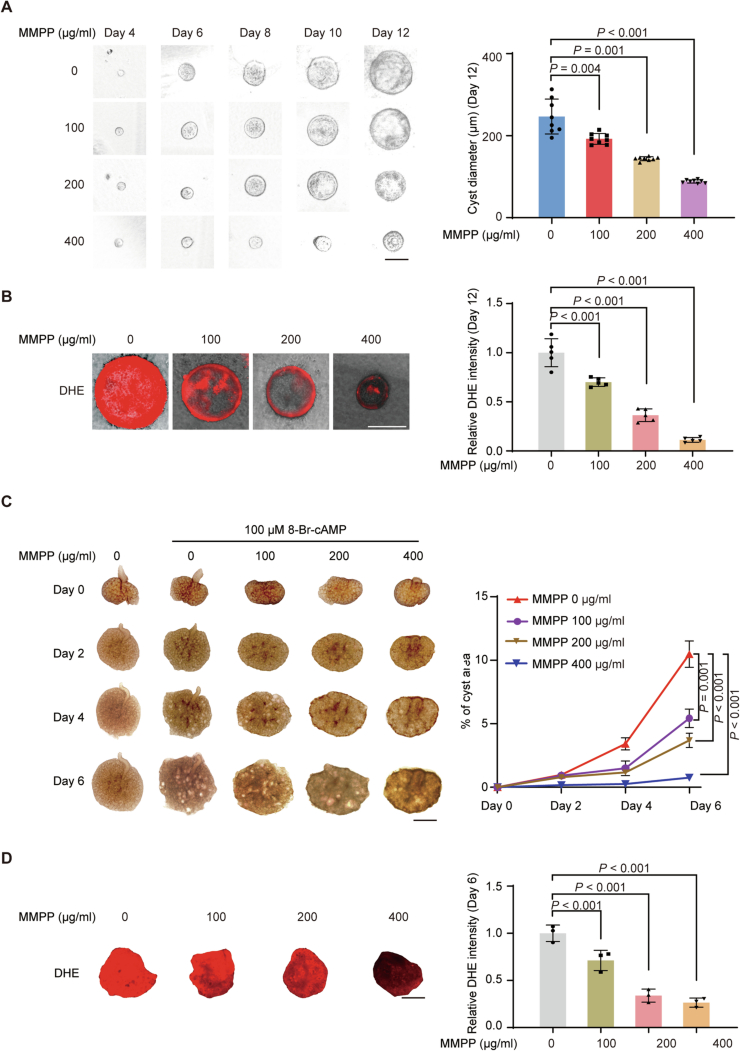
Melanin-like nanoparticles (MNPs) have recently emerged as valuable agents in antioxidant therapy due to their excellent biocompatibility and potent capacity to scavenge various reactive oxygen species (ROS). However, previous studies have mainly focused on acute ROS-related diseases, leaving a knowledge gap regarding their potential in chronic conditions. Furthermore, apart from their well-established antioxidant effects, it remains unclear whether MNPs target other intracellular molecular pathways. In this study, we synthesized ultra-small polyethylene glycol-incorporated Mn2+-chelated MNP (MMPP). We found that MMPP traversed the glomerular filtration barrier and specifically accumulated in renal tubules. Autosomal dominant polycystic kidney disease (ADPKD) is a chronic genetic disorder closely associated with increased oxidative stress and featured by the progressive enlargement of cysts originating from various segments of the renal tubules. Treatment with MMPP markedly attenuated oxidative stress levels, inhibited cyst growth, thereby improving renal function. Interestingly, we found that MMPP effectively inhibits a cyst-promoting gene program downstream of the cAMP-CREB pathway, a crucial signaling pathway implicated in ADPKD progression. Mechanistically, we observed that MMPP directly binds to the bZIP DNA-binding domain of CREB, leading to competitive inhibition of CREB's DNA binding ability and subsequent reduction in CREB target gene expression. In summary, our findings identify an intracellular target of MMPP and demonstrate its potential for treating ADPKD by simultaneously targeting oxidative stress and CREB transcriptional activity.

Keywords: ADPKD Therapy; Melanin-like Nanoparticle; Reactive Oxygen Species; cAMP-CREB Pathway.


Conflict of interest statement

Disclosure and competing interests statement. The authors declare no competing interests.

Figures

Figure 1
Figure 1. The biodistribution of MMPP in mouse kidneys.
(A) Schematic illustration of MMPP nanoparticles synthesis. (B) FTIR spectra of MMPP nanoparticles, HS-PEG molecule, PVP molecule and melanin granules. (C) TEM images of MMPP nanoparticles. (D) Hydrodynamic size of MMPP nanoparticles measured by DLS. (E) PEG staining (left) and signal intensity quantification (right) in whole kidneys with or without MMPP treatment. (F) PEG, LRP2, AQP2, and SYNPO staining in MMPP treated mouse kidney sections. Scale bars, 20 nm (C), 500 µm (E), and 100 µm (F). Source data are available online for this figure.
Figure 2
Figure 2. MMPP attenuates cyst growth in ADPKD mice.
(A) Schematic diagram of experimental design in ADPKD mouse model. (B) Representative images of kidneys from WT and Pkd1−/− mice treated with saline or MMPP. The representative images are from the data marked by black arrows in (C). (C) Ratios of kidney-weight to body-weight (KW/BW) in the indicated groups of mice (n = 9). (D) Hematoxylin and eosin (H&E) staining of kidney sections in saline- or MMPP-treated Pkd1−/− mice. The representative images are from the data marked by black arrows in (E). (E) Cystic index (cyst area to total area) calculated from H&E staining sections in (D) (n = 9). (F) Plasma BUN levels in mice from the indicated groups (n = 9). (G) Representative images of livers from WT and Pkd1−/− mice treated with saline or MMPP. (H) H&E staining of liver sections in saline- or MMPP-treated Pkd1−/− mice. The representative images are from the data marked by black arrows in (I). (I) Cystic index calculated from H&E staining sections in (H) (n = 9). Scale bars, 2 mm (B, D and G) and 100 µm (H). Data presented as means ± SD. Two-tailed unpaired Student’s t test was used for statistical analysis in (E) and (I), two-way ANOVA with LSD test was used for statistical analysis in (C) and (F). Source data are available online for this figure.
Figure 3
Figure 3. MMPP inhibits oxidative stress by scavenging ROS in ADPKD mice.
(A) Gene expression and clustering analysis of differentially expressed genes in cystic cells isolated from WT and Pkd1−/− mice treated with saline or MMPP. (B) Gene Ontology (GO) term enrichment analysis of Cluster 2 genes in (A). (C) Subcellular localization of the genes in Cluster 2. (D) RT-PCR analysis of the representative mitochondrial genes (Co3, Cytb and Atp6) in primary renal epithelia cells isolated from the indicated groups of mice (n = 3). (E) DHE staining (left) and quantification (right) of frozen sections of mouse kidneys (n = 3). (F) DHE staining (left) and quantification (right) of frozen sections of mouse livers (n = 3). Scale bars, 50 µm (E, F). Data presented as means ± SD. Hypergeometric test was used for statistical analysis in (B), one-way ANOVA with LSD test was used for statistical analysis in (D), two-tailed unpaired Student’s t test was used for statistical analysis in (E) and (F). Source data are available online for this figure.
Figure 4
Figure 4. MMPP inhibits the expression of CREB target genes in ADPKD mice.
(A) Venn diagram illustrating the proportion of CREB target genes within Cluster 4 genes. (B) The proportions of CREB targets in genes with low, medium, or high expression level in ADPKD renal epithelial cells. (C) Heatmap displaying the expression levels of CREB targets within Cluster 4 genes. (D) GO term enrichment analysis of CREB target genes in (A). (E) RT-PCR analysis of representative CREB target genes (Myc, Syk, Abcg1, and Clcf1) in primary renal epithelia cells isolated from the indicated groups of mice (n = 3). Data presented as means ± SD. Hypergeometric test was used for statistical analysis in (D), one-way ANOVA with LSD test or Dunnett’s T3 test was used for statistical analysis. Source data are available online for this figure.
Figure 5
Figure 5. MMPP inhibits CREB target gene expression through interacting with CREB.
(A) RT-PCR analysis of representative CREB target genes (ICER and NR4A2) in 293T cells treated with the indicated doses of FSK and MMPP for 24 h (representative of three independent experiments; n = 3 biological replicates). (B) Quantification of CRE-luciferase activity in 293T cells treated with the indicated doses of FSK and MMPP for 24 h (representative of three independent experiments; n = 3 biological replicates). (C) Western blot analysis of PKA activity in 293T cells treated with the indicated doses of MMPP for 24 h, followed by 1-h FSK treatment. (D) Western blot analysis of p-CREB in 293 T cells treated as in (C). (E) Schematic illustration of Biotin-MMPP nanoparticle synthesis. (F) Streptavidin pull-down assays examining the interactions between Bio-MMPP (400 µg/mL) and FLAG-CREB in 293T cells. (G) Streptavidin pull-down assays examining the interactions between Bio-MMPP (400 µg/mL) and endogenous CREB in 293T cells. (H) Streptavidin pull-down assays examining the interactions between Bio-MMPP (400 µg/mL) and endogenous CREB in the cytosol and nuclear fractions of 293T cells. Data presented as means ± SD. Source data are available online for this figure.
Figure 6
Figure 6. MMPP directly interacts with CREB through the bZIP domain.
(A) Schematic illustration of FITC-MMPP nanoparticle synthesis. (B) Representative images of in vitro colocalization analysis of purified Cherry/Cherry-CREB (40 µM) and FITC-MMPP nanoparticles (100 µg/mL). (C) Schematic diagram illustrating the functional domains of CREB (top) and Streptavidin pull-down assay (bottom) examining the interactions between Bio-MMPP (400 µg/mL) and purified CREB proteins containing full-length (FL) CREB, Q1 domain, KID domain, Q2 domain, or bZIP domain. (D) Streptavidin pull-down assay examining the interactions between Bio-MMPP (400 µg/mL) and purified full-length CREB or CREB▵bZIP truncated proteins. (E) Representative images of in vitro colocalization analysis of purified Cherry-CREB (40 µM)/Cherry-CREB▵bZIP (40 µM) and FITC-MMPP nanoparticles (100 µg/mL). (F) Streptavidin pull-down assays examining the interactions between Bio-MMPP (400 µg/mL) and full-length CREB, Q1 domain, KID domain, Q2 domain, or bZIP domain in 293T cells. (G) Streptavidin pull-down assays examining the interactions between Bio-MMPP (400 µg/mL) and full-length CREB or CREB▵bZIP overexpressed in 293T cells. (H) EMSA assays analyzing CREB binding to the CRE DNA probes with the indicated doses of MMPP treatment. (I) ChIP-qPCR analysis of p-CREB occupancy on NR4A2 and PCK genes in 293T cells with indicated treatments (representative of three independent experiments; n = 3 biological replicates). (J) ChIP-qPCR analysis of p-CREB occupancy on Abcg1 and Clcf1 genes in primary renal epithelial cells isolated from WT and Pkd1−/− mice treated with saline or MMPP (representative of three independent experiments; n = 3 biological replicates). Scale bars, 10 µm (B and E). Data presented as means ± SD. One-way ANOVA with LSD test was used for statistical analysis. Source data are available online for this figure.
Figure 7
Figure 7. Schematic illustration of the mechanism by which MMPP ameliorates ADPKD progression through dual inhibition.
The left part shows that ROS accumulation and CREB hyperactivation accelerate ADPKD progression. The right part illustrates that MMPP treatment reduces ROS levels in the cytoplasm and inhibits CREB transactivation in the nucleus, thereby improving ADPKD progression. ROS reactive oxygen species, CRE cAMP response element, ·OH hydroxyl radical, O2 superoxide anion radical.
Figure EV1
Figure EV1. MMPP inhibits cyst growth and scavenges ROS in in vitro and ex vivo ADPKD models.
(A) Representative images (left) and cyst diameter (right) of MDCK cysts treated with the indicated doses of MMPP (representative of eight independent experiments; n = 8 biological replicates). (B) DHE staining (left) and quantification (right) of cysts in each of the indicated groups (representative of five independent experiments; n = 5 biological replicates). (C) Representative images (left) of mouse embryonic kidneys treated with the indicated doses of MMPP and quantification (right) of the percentage of cyst area relative to total kidney area (representative of three independent experiments; n = 3 biological replicates). (D) DHE staining (left) and quantification (right) of embryonic kidneys on day 6 of MMPP treatment (representative of three independent experiments; n = 3 biological replicates). Scale bars, 100 µm (A and B) and 1 mm (C and D). Data presented as means ± SD. One-way ANOVA with LDS test or Dunnett’s T3 test was used for statistical analysis in (A), (B) and (D), repeated measures ANOVA with LSD test was used for statistical analysis in (C).
Figure EV2
Figure EV2. MR imaging of MMPP distribution in kidneys and liver.
(A) MR images of MMPP in Pkd1+/+ and Pkd1−/− mice (Dosage: 100 mg/kg). (B) Quantification of MMPP T1 signal in kidneys. (C) Quantification of MMPP T1 signal in livers.
Figure EV3
Figure EV3. Safety assessment of MMPP in vivo.
(A) Growth curve of mouse body weight of Pkd1+/+ and Pkd1−/− mice treated with saline or MMPP (n ≥ 3) (B) H&E staining of organs from mice treated with Saline or MMPP. (C) Hematology analysis of whole blood in MMPP-treated mice (n = 4). (D, E) AST (D) and ALT (E) levels in MMPP-treated mice from the indicated groups (n = 9). Scale bar, 50 µm. Data presented as means ± SD. Two-way ANOVA with LSD test was used for statistical analysis.
Figure EV4
Figure EV4. MMPP treatment improves mitochondria morphology and metabolic function in ADPKD kidneys.
(A) TEM images of mitochondria from kidney tissues of the indicated groups. (B) Measurement of the mitochondrial OCR of renal primary tubule cells isolated from the indicated groups (representative of three independent experiments; n = 3 biological replicates). (C) Basal respiration of mitochondria from the indicated groups (representative of three independent experiments; n = 3 biological replicates). (D) Maximal respiration of mitochondria from the indicated groups (representative of three independent experiments; n = 3 biological replicates). Scale bars, 1 µm. Data presented as means ± SD. One-way ANOVA with LSD test was used for statistical analysis in (C) and (D).

Similar articles

Cited by

References

    1. Acin-Perez R, Bayona-Bafaluy MP, Fernandez-Silva P, Moreno-Loshuertos R, Perez-Martos A, Bruno C, Moraes CT, Enriquez JA (2004) Respiratory complex III is required to maintain complex I in mammalian mitochondria. Mol Cell 13:805–815 - PMC - PubMed
    1. Augustine R, Hasan A, Primavera R, Wilson RJ, Thakor AS, Kevadiya BD (2020) Cellular uptake and retention of nanoparticles: Insights on particle properties and interaction with cellular components. Mater Today Commun 25:101692
    1. Bako J, Toth F, Gall J, Kovacs R, Csik A, Varga I, Sculean A, Zelko R, Hegedus C (2022) Combined release of antiseptic and antibiotic drugs from visible light polymerized biodegradable nanocomposite hydrogels for periodontitis treatment. Pharmaceutics 14:957 - PMC - PubMed
    1. Bao X, Zhao J, Sun J, Hu M, Yang X (2018) Polydopamine nanoparticles as efficient scavengers for reactive oxygen species in periodontal disease. ACS Nano 12:8882–8892 - PubMed
    1. Bergmann C, Guay-Woodford LM, Harris PC, Horie S, Peters DJM, Torres VE (2018) Polycystic kidney disease. Nat Rev Dis Prim 4:50 - PMC - PubMed

MeSH terms