Genome-wide identification of heterotrimeric G protein genes in castor (Ricinus communis L.) and expression patterns under salt stress
- PMID: 39567878
- PMCID: PMC11577925
- DOI: 10.1186/s12864-024-11027-1
Genome-wide identification of heterotrimeric G protein genes in castor (Ricinus communis L.) and expression patterns under salt stress
Abstract
Background: Heterotrimeric G proteins are crucial signaling molecules involved in cell signaling, plant development, and stress response. However, the genome-wide identification and analysis of G proteins in castor (Ricinus communis L.) have not been researched.
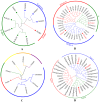
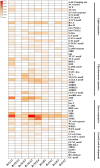
Results: In this study, RcG-protein genes were identified using a sequence alignment method and analyzed by bioinformatics and expression analysis in response to salt stress. The results showed that a total of 9 G-protein family members were identified in the castor genome, which were classified into three subgroups, with the majority of RcG-proteins showing homology to soybean G-protein members. The promoter regions of all RcG-protein genes contained antioxidant response elements and ABA-responsive elements. Go enrichment analysis displayed that RcG-protein genes were involved in the G protein-coupled receptor signaling pathway, regulation of root development, and response to the bacterium. Real-time PCR showed varying responses of all RcG-protein genes to salt stress. RcGB1 was notably expressed in both roots and leaves under salt treatment, suggesting that it may be an essential gene associated with salt tolerance in the castor.
Conclusions: This study offers a theoretical framework for exploring G-protein function and presents potential genetic assets for improving crop resilience through genetic enhancement.
Keywords: Ricinus communis; Bioinformatics; Gene expression analysis; Heterotrimeric G protein; Salt stress.
© 2024. The Author(s).
Conflict of interest statement
Declarations. Ethics approval and consent to participate: Not applicable. Consent for publication: Not applicable. Competing interests: The authors declare no competing interests.
Figures


Similar articles
-
Genome-wide identification of core components of ABA signaling and transcriptome analysis reveals gene circuits involved in castor bean (Ricinus communis L.) response to drought.Gene. 2023 Oct 20;883:147668. doi: 10.1016/j.gene.2023.147668. Epub 2023 Jul 25. Gene. 2023. PMID: 37500024
-
Genome-Wide Identification, Evolutionary Analysis, and Stress Responses of the GRAS Gene Family in Castor Beans.Int J Mol Sci. 2016 Jun 24;17(7):1004. doi: 10.3390/ijms17071004. Int J Mol Sci. 2016. PMID: 27347937 Free PMC article.
-
Transcriptome analysis of salt stress responsiveness in the seedlings of wild and cultivated Ricinus communis L.J Biotechnol. 2021 Feb 10;327:106-116. doi: 10.1016/j.jbiotec.2020.12.020. Epub 2021 Jan 6. J Biotechnol. 2021. PMID: 33421510
-
Identification and characterization of the RcTCP gene family and its expression in response to abiotic stresses in castor bean.BMC Genomics. 2024 Jul 4;25(1):670. doi: 10.1186/s12864-024-10347-6. BMC Genomics. 2024. PMID: 38965476 Free PMC article.
-
[Identification and expression pattern analysis of RcACA gene family in castor under abiotic stresses].Sheng Wu Gong Cheng Xue Bao. 2023 Jul 25;39(7):2861-2873. doi: 10.13345/j.cjb.220820. Sheng Wu Gong Cheng Xue Bao. 2023. PMID: 37584136 Chinese.
Cited by
-
Genome-wide identification of castor bean class III peroxidase genes and analysis of expression patterns under abiotic stresses.BMC Plant Biol. 2025 Jul 11;25(1):900. doi: 10.1186/s12870-025-06945-5. BMC Plant Biol. 2025. PMID: 40646456 Free PMC article.
References
-
- Zhong CL, Zhang C, Liu JZ. Heterotrimeric G protein signaling in plant immunity. J Exp Bot. 2019;70(4):1109–18. 10.1093/jxb/ery426. - PubMed
-
- Ullah H, Chen JG, Young JC, Im KH, Sussman MR, Jones AM. Modulation of cell proliferation by heterotrimeric G protein in Arabidopsis. Science. 2001;292(5524):2066–9. 10.1126/science.1059040. - PubMed
-
- Bommert P, Je BI, Goldshmidt A, Jackson D. The maize Gα gene COMPACT PLANT2 functions in CLAVATA signalling to control shoot meristem size. Nature. 2013;502(7472):555–8. 10.1038/nature12583. - PubMed
MeSH terms
Substances
Grants and funding
LinkOut - more resources
Full Text Sources

