. 2024 Nov 20;22(1):546.
doi: 10.1186/s12916-024-03737-w.

Retrospective epidemiologic and genomic surveillance of arboviruses in 2023 in Brazil reveals high co-circulation of chikungunya and dengue viruses

Affiliations

Retrospective epidemiologic and genomic surveillance of arboviruses in 2023 in Brazil reveals high co-circulation of chikungunya and dengue viruses

Augusto César Parreiras de Jesus et al. BMC Med. .

Abstract

Background: The rapid spread and increase of chikungunya (CHIKV) and dengue (DENV) cases in Brazilian regions in 2023 has raised concerns about the impact of arboviruses on public health. Epidemiological and genomic surveillance was performed to estimate the introduction and spread of CHIKV and DENV in Brazil.

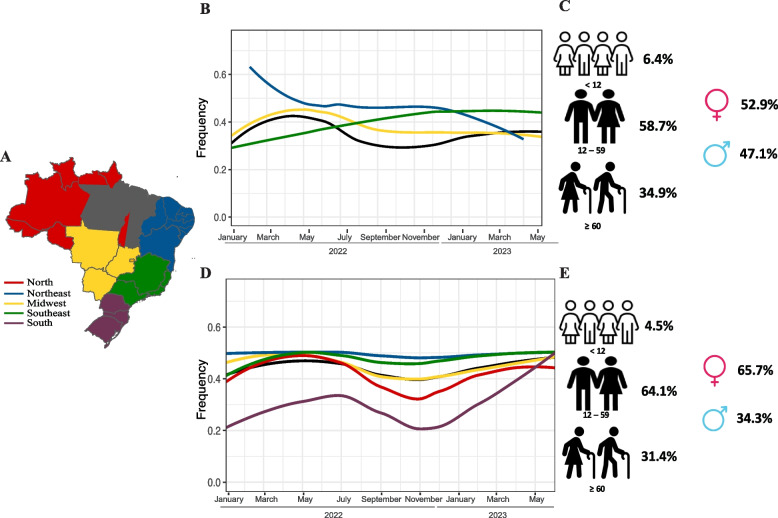
Methods: This study obtained results from the Hermes Pardini (HP), a private medical laboratory, and the Health Department of Minas Gerais state (SES-MG). We investigated the positivity rates of CHIKV and DENV by analyzing the results of 139,457 samples tested for CHIKV (44,029 in 2022 and 95,428 in 2023) and 491,528 samples tested for DENV (163,674 in 2022 and 327,854 in 2023) across the five representative geographical regions of Brazil. Genome sequencing was performed on 80 CHIKV and 153 DENV samples that had been positive for RT-PCR tests.

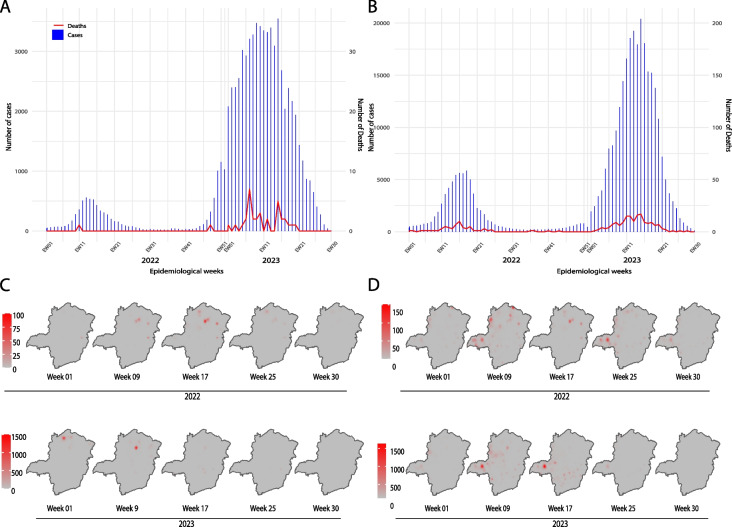
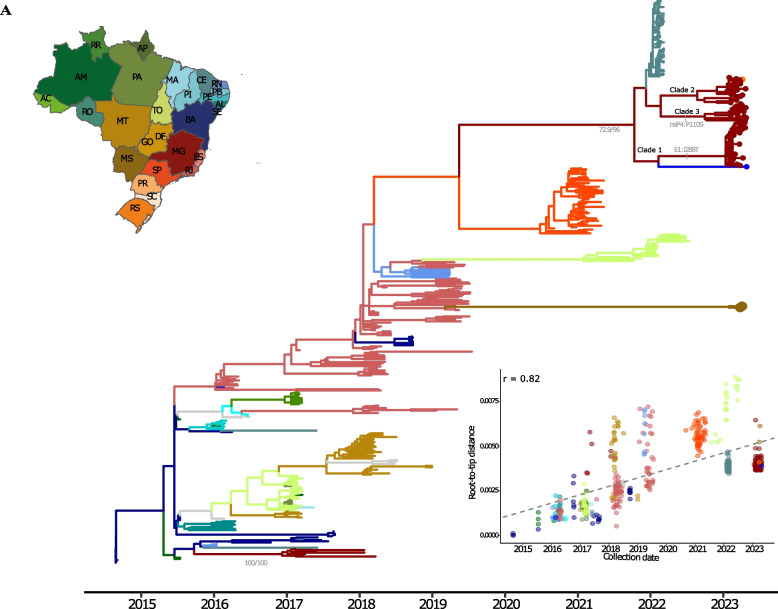
Results: In our sampling, the data from CHIKV tests indicated that the Northeast region had the highest regional positivity rate in 2022 (58.1%). However, in 2023, the Southeast region recorded the highest positivity rate (40.5%). With regard to DENV, the South region exhibited the highest regional positivity rate in both 2022 (40.8%) and 2023 (22.7%), followed by the Southeast region in both years (34.8% in 2022; 21.4% in 2023). During the first 30 epidemiological weeks of 2023 in the state of Minas Gerais (MG), there was a 5.8-fold increase in CHIKV cases and a 3.5-fold increase in DENV compared to the same period in 2022. Analysis of 151 new DENV-1 and 80 CHIKV genomes revealed the presence of three main clusters of CHIKV and circulation of several DENV lineages in MG. All CHIKV clades are closely related to genomes from previous Brazilian outbreaks in the Northeast, suggesting importation events from this region to MG. We detected the RNA of both viruses in approximately 12.75% of the confirmed positive cases, suggesting an increase of co-infection with DENV and CHIKV during the period of analysis.

Conclusions: These high rates of re-emergence and co-infection with both arboviruses provide useful data for implementing control measures of Aedes vectors and the urgent implementation of public health politics to reduce the numbers of CHIKV and DENV cases in the country.

Keywords: Arboviruses; Chikungunya; Co-infection; Dengue; Genomic and epidemiological surveillance.


Conflict of interest statement

Declarations. Ethics approval and consent to participate: The study was approved by the Research Ethics Committee (CAAE- 33202820.7.1001.5348). Consent for publication: There is no consent for publication for this paper. Competing interests: The authors declare no competing interests.

Figures

Fig. 1
Fig. 1
Positivity frequencies and social data for CHIKV diagnostic conducted in Brazil from 1 January 2022 to 30 June 2023. A Brazilian geographic regions. B CHIKV RT-qPCR positivity frequency following the period for each Brazilian geographical region. Each color line corresponds to the geographical region on the Brazil map, and the total frequency is presented as a black curve (Brazil). The North and South regions did not present a statistically significant number of cases that were well distributed throughout the study period. As a result, these regions are not included in the graph. C Age and sex distribution of CHIKV RT-qPCR positivity in Brazil over the 18-month study period. D Serological prevalence (IgM) for CHIKV in Brazil during 2022 and 2023. Each color line corresponds to the geographical region on the Brazil map, and the total frequency is presented as a black curve. E Age and sex distribution for IgM anti-CHIKV serological positive data in the whole period. The graphs were constructed using the ggplot2 package in R software
Fig. 2
Fig. 2
Positivity frequencies and social data for DENV diagnostic conducted in Brazil from 1 January 2022 to 30 June 2023. A Brazilian geographic regions. B DENV RT-qPCR and NS1 positivity frequency following the period for each Brazilian geographical region. Each color line corresponds to the geographical region on the Brazil map, and the total frequency is presented as a black curve (Brazil). C Age and sex distribution of DENV RT-qPCR and NS1 positivity in Brazil over the 18-month study period. D Serological prevalence (IgM) for DENV in Brazil during 2022 and 2023. Each color line corresponds to the geographical region on the Brazil map, and the total frequency is presented as a black curve. E Age and sex distribution for IgM anti-DENV serological positive data in the whole period. The graphs were constructed using the ggplot2 package in R software
Fig. 3
Fig. 3
Epidemiological scenario of arboviruses in Minas Gerais state. A, B Chikungunya and dengue number of cases and deaths during the years of 2022 and 2023 in MG, respectively. C Spatiotemporal cases distribution of CHIKV and D DENV in MG. The data was obtained by the Health Department of MG State (SES-MG). Cases of arboviruses were confirmed using serological (IgM/IgG detection) or molecular methods (RT-qPCR). In 2022, SES-MG reported 10,765 cases of CHIKV with only two deaths confirmed, while 62,542 cases and 33 deaths were confirmed in 2023. 73,648 DENV cases and 65 deaths were reported in 2022, while 260,316 cases and 165 deaths were confirmed in 2023
Fig. 4
Fig. 4
Timetree phylogeographic reconstruction for the CHIKV ECSA clade in Brazil. A Timetree molecular clock phylogeny annotated according to the probable ancestral location. Each color represents a different Brazilian state, as described in the Brazilian map. Tip shapes indicate genomes generated in our study. Two mutations in non-structural and structural proteins are shown in the main MG clades. Clade 2 is represented by the presence of the non-structural mutation nsP4: P110S, while clade 3 is represented by the mutation in the polyprotein E1: I288T. In total, 1711 public genomes and 80 new genomes were used in our phylogeny. Number of genomes used in our phylogeny classified by state: Alagoas (AL—9), Amazonas (AM—5), Bahia (BA—27), Ceará (CE—64), Maranhão (MA—1), Mato Grosso do Sul (MS—2), Mato Grosso (MT—35), Minas Gerais (MG—86), Pará (PA—5), Paraíba (PR—2). Pernambuco (PE—7), Rio de Janeiro (RJ—91), Rio Grande do Norte (RN—11), Rio Grande do Sul (RS—1), Roraima (RR—11), São Paulo (SP—51), Sergipe (SE—2), Tocantins (TO—43). B Root-to-tip distance plot, showing a clock-like signal (r = 0.82)
Fig. 5
Fig. 5
Timetree phylogeographic reconstruction for the DENV-1 genotype V with Brazilian genomes. A Timetree molecular clock phylogeny annotated according to the probable ancestral location. Each color represents a different Brazilian state, as described in the Brazilian map. Tip shapes indicate genomes generated in our study. The clades are showed in the figure. In total, 1328 publicly available genomes and 151 new genomes were used to construct the phylogeny. Number of genomes used in our phylogeny classified by state: Alagoas (AL—3), Amazonas (AM—10), Amapá (AP—12), Bahia (BA—19), Distrito Federal (DF—16), Espírito Santo (ES—2), Goiás (GO—36), Minas Gerais (MG—161), Mato Grosso (MT—47), Mato Grosso do Sul (MS—32), Pará (PA—2), Paraiba (PB—39), Pernambuco (PE—26), Rio de Janeiro (RJ—27), Rondônia (RO—11). Santa Catarina (SC—7), Sergipe (SE—1), São Paulo (SP—316). B Root-to-tip distance plot, showing a clock-like signal (r = 0.94)

References

    1. Miller BR. Arboviruses. In Encyclopedia of Virology (Third Edition). Academic Press; 2008;170–6.
    1. Zardini A, Menegale F, Gobbi A, Manica M, Guzzetta G, d’Andrea V, et al. Estimating the potential risk of transmission of arboviruses in the Americas and Europe: a modelling study. Lancet Planet Health. 2024;8:e30–40. - PubMed
    1. BRASIL. Ministério da Saúde. Boletim Epidemiológico. Monitoramento das arboviroses urbanas: semanas epidemiológicas 1 a 35 de 2023. Available online: https://www.gov.br/saude/pt-br/centrais-de-conteudo/publicacoes/boletins.... Accessed 10 July 2024.
    1. Powers AM, Brault AC, Tesh RB, Weaver SC. Re-emergence of chikungunya and o’nyong-nyong viruses: evidence for distinct geographical lineages and distant evolutionary relationships. Microbiology (N Y). 2000;81:471–9. - PubMed
    1. de Bruycker-Nogueira F, Mir D, dos Santos FB, Bello G. Evolutionary history and spatiotemporal dynamics of DENV-1 genotype V in the Americas. Infect Genet Evol. 2016;45:454–60. - PubMed

Publication types