. 2024 Nov 20;22(1):723.
doi: 10.1186/s12951-024-03009-y.

Mechanism of cold exposure delaying wound healing in mice

Affiliations

Mechanism of cold exposure delaying wound healing in mice

Fu-Xing-Zi Li et al. J Nanobiotechnology. .

Erratum in

  • Correction: Mechanism of cold exposure delaying wound healing in mice.
    Li FX, Liu JJ, Lei LM, Li YH, Xu F, Lin X, Cui RR, Zheng MH, Guo B, Shan SK, Tang KX, Li CC, Wu YY, Duan JY, Cao YC, Wu YL, He SY, Chen X, Wu F, Yuan LQ. Li FX, et al. J Nanobiotechnology. 2024 Dec 12;22(1):752. doi: 10.1186/s12951-024-03039-6. J Nanobiotechnology. 2024. PMID: 39663528 Free PMC article. No abstract available.

Abstract

Cold temperatures have been shown to slow skin wound healing. However, the specific mechanisms underlying cold-induced impairment of wound healing remain unclear. Here, we demonstrate that small extracellular vesicles derived from cold-exposed mouse plasma (CT-sEVs) decelerate re-epithelialization, increase scar width, and weaken angiogenesis. CT-sEVs are enriched with miRNAs involved in the regulation of wound healing-related biological processes. Functional assays revealed that miR-423-3p, enriched in CT-sEVs, acts as a critical mediator in cold-induced impairment of angiogenic responses and poor wound healing by inhibiting phosphatase and poly(A) binding protein cytoplasmic 1 (PABPC1). These findings indicate that cold delays wound healing via miR-423-3p in plasma-derived sEVs through the inhibition of the ERK or AKT phosphorylation pathways. Our results enhance understanding of the molecular mechanisms by which cold exposure delays soft tissue wound healing.

Keywords: Angiogenesis; Cold exposure; Extracelluar Vesicles; PABPC1; Wound healing; miR-423-3p.


Conflict of interest statement

Declarations. Consent for publication: All authors agree for publication. Competing interests: The authors declare no competing interests.

Figures

Fig. 1
Fig. 1
Delayed wound healing in the CT environment. (A) Gross view of wounds treated with RT or CT at day 3, 6, 9 and 12 post-wounding. (B) The rate of wound closure in wounds receiving different RT or CT treatments, with n = 6 per group. (C) Representative images of H&E-stained wound sections at day 12 post-wounding. Double-headed black arrows indicate the edges of the scars. Ep: epithelium. Scale bar: 500 μm. (D) Quantification of the scar widths, n = 4 per group. (E) Quantification of the rate of re-epithelialization, n = 4 per group. (F) CD31 immunofluorescence staining of wound sections at day 12 post-wounding. Scale bar: 100 μm. (G) Quantitative analysis of the density of blood vessels in (F), n = 4 per group. Two-group comparison was performed using unpaired, two tailed student’s t-test. *p < 0.05; **p < 0.01; ***p < 0.001
Fig. 2
Fig. 2
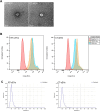
Identification of sEVs. (A) Morphology of RT-sEVs or CT-sEVs under transmission electron microscopy. Scale bar: 100 nm. (B) Flow cytometry analysis of the cell surface markers on RT-sEVs or CT-sEVs (n = 4). (C) Diameter distribution of RT-sEVs or CT-sEVs
Fig. 3
Fig. 3
CT-sEVs reduced cutaneous wound healing in mice. Representative images (A) and closure rate (B) of wounds treated with PBS, RT-sEVs and CT-sEVs were observed at days 3, 6, 9 and 12 post-wounding. n = 6 per group. (C) Representative images of H&E-stained wound sections at day 12 post-wounding. The double-headed black arrows indicate the edges of the scars. Ep: epithelium. Scale bar: 500 μm. (D) Quantification of the scar widths, n = 4 per group. (E) Quantification of the rate of re-epithelialization, n = 4 per group. (F) Gross view of wounds treated with PBS, RT-sEVs and CT-sEVs at day 12 post-wounding from the undersurface. Newly formed blood vessels were detected in the wound sites. Scale bar: 2 mm. (G) CD31 immunofluorescence staining of wound sections treated with PBS, RT-sEVs and CT-sEVs at day 12 post-wounding. Scale bar: 100 μm. (H) Quantitative analysis of the density of blood vessels in (G), n = 4 per group. (I) Ki67 immunofluorescence staining of wound sections treated with PBS, RT-sEVs and CT-sEVs at day 12 post-wounding. Scale bar: 100 μm. (J) Quantitative analysis of the density of blood vessels in (I), n = 4 per group. One-way ANOVA combined with Bonferroni post hoc test. *p < 0.05; **p < 0.01; ***p < 0.001; ****p < 0.0001. (*) Significant difference CT-sEVs group vs. RT-sEVs group, (#) Significant difference RT-sEVs group vs. PBS (control) group
Fig. 4
Fig. 4
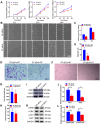
CT-sEVs inhibited the proliferation and migration and angiogenic activities in vitro. (A) HaCaT, HSFs and HMEC-1 exhibited a much weaker proliferative ability when exposed to CT-sEVs, as tested by CCK-8 analysis, n = 4 per group. (B) CT-sEVs inhibited HMEC-1 migration as analyzed by scratch wound assay. Scale bar: 250 μm. (C) Quantitative analysis of the migration rates in (B), n = 4 per group. (D) The migratory ability of HMEC-1 receiving different treatments was further confirmed by the transwell assay. Scale bar: 50 μm. (E) Quantitative analysis of the migrated cells in (D), n = 4 per group. (F) Representative images of HMEC-1 tube formation. Scale bar: 100 μm. (G and H) Quantification of the total tube length and total branching points, n = 4 per group. (I and J) CT-sEVs incubation reduced the protein levels of CD31, VEGF, p-ERK and p-AKT in HEMC-1. (K and L) Densitometric quantification of the relative band intensity in (J and L), n = 4 per group. Two-group comparison was performed using unpaired, two tailed student’s t-test. *p < 0.05; **p < 0.01; ***p < 0.001
Fig. 5
Fig. 5
miR-423-3p mediated the anti-angiogenic effect of CT-sEVs by targeting PABPC1. (A) qRT-PCR analysis of miR-423-3p expression in sEVs from the plasma of the RT or CT mice (n = 6). (B-C) qRT-PCR analysis of miR-423-3p expression in HMEC-1 (B) and HSFs (C) from RT-sEVs or CT-sEVs (n = 6). (D) qRT-PCR was performed to evaluate the expression of miR-423-3p in HMEC-1 transfected with specific miR-423-3p mimics or inhibitor (n = 4). (E) Western blotting was performed to determine the protein expression levels of CD31 and VEGF in HMEC-1 cells transfected with specific miR-423-3p mimics or inhibitors (n = 4). (F) The data are presented as densitometric ratios, normalised to GAPDH. (G) A Venn diagram showing bioinformatics analysis of miR-423-3p target genes. (H) Schematic representation of miR-423-3p putative target sites in the PABPC1 3′-UTR and the alignment of miR-423-3p with wild type and mutant PABPC1 3′-UTR showing pairing. (I) Luciferase reporter assays were performed using luciferase constructs carrying a wild type or mutant PABPC1 3′-UTR co-transfected into HMEC-1 with miR-423-3p mimics compared with empty vector control. Firefly luciferase activity was normalised to Renilla luciferase activity. (J and K) PABPC1 protein expression in HMEC-1 transfected with miR-423-3p mimics or miR-423-3p inhibitor was determined by Western blotting (n = 4). (L and M) The efficiency of PABPC1 knockdown in HMEC-1 by siRNA was measured by Western blotting (n = 4). (N and O) p-ERK, p-AKT and VEGF expression was measured in the HMEC-1 cells treated with siPABPC1#3 or a siRNA control (n = 4). Two-group comparison was performed using unpaired, two tailed student’s t-test. One-way ANOVA combined with Bonferroni post hoc test. *p < 0.05; **p < 0.01; ***p < 0.001; ****p < 0.0001
Fig. 6
Fig. 6
Genetically engineered CT-sEVs + antagomiR-423-3p facilitated the proliferation, migration and angiogenic effects. (A- B) CCK-8 assay showed that CT-sEVs + antagomiR-NC inhibited HSFs, HaCaT and HMEC-1 proliferation, whereas this effect was attenuated by miR-423-3p inhibition, n = 4 per group. (D) CT-sEVs + antagomiR-NC suppressed HMEC-1 migration as analyzed by scratch wound assay, but this effect was reduced by miR-423-3p inhibitor. Scale bar: 250 μm. (E) Quantitative analysis of the migration rates in (D), n = 4 per group. (F) The migratory ability of HMEC-1 receiving different treatments was further confirmed by the transwell assay. Scale bar: 50 μm. (G) Quantitative analysis of the migrated cells in (F), n = 4 per group. (H) Representative images of the tube formation assay on Matrigel in HMEC-1 treated with PBS, CT-sEVs + antagomiR-NC or CT-sEVs + antagomiR-423-3p. Scale bar: 100 μm. (I -J) Quantitative analyses of the total tube length and total branching points in (B), n = 4 per group. Two-group comparison was performed using unpaired, two tailed student’s t-test. One-way ANOVA combined with Bonferroni post hoc test. *p < 0.05; **p < 0.01; ***p < 0.001; ****p < 0.0001. (*) Significant difference CT-sEVs + antagomiR-423-3p group vs. CT-sEVs + antagomiR-NC group, (#) Significant difference CT-sEVs + antagomiR-NC group vs. PBS (control) group
Fig. 7
Fig. 7
Exosomal miR-423-3p decelerated cutaneous wound healing in mice. (A) Gross view of wounds treated with PBS, CT-sEVs + antagomiR-NC and CT-sEVs + antagomiR-423-3p at days 3, 6, 9 and 12 post-wounding. (B) The rate of wound-closure in wounds receiving different treatments at the indicated times, n = 6 per group. (C) H&E staining of wound sections treated with PBS, CT-sEVs + antagomiR-NC and CT-sEVs + antagomiR-423-3p at 12 days after operation. Scale bar: 500 μm. (D- E) Quantitative analysis of scar widths and the extent of re-epithelialization in (C), n = 6 per group. (F) Gross view of wounds treated with PBS, CT-sEVs + antagomiR-NC and CT-sEVs + antagomiR-423-3p at day 12 post-wounding from the undersurface. Newly formed blood vessels were detected in the wound sites. Scale bar: 2 mm. (G) Representative images of CD31 staining of wound sections. Scale bar: 100 μm. (H) Quantification of the number of ki67-positive cells in (G), n = 4 per group. One-way ANOVA combined with Bonferroni post hoc test. *p < 0.05; **p < 0.01; ***p < 0.001; ****p < 0.0001. (*) Significant difference CT-sEVs + antagomiR-423-3p group vs. CT-sEVs + antagomiR-NC group, (#) Significant difference CT-sEVs + antagomiR-NC group vs. PBS (control) group
Fig. 8
Fig. 8
CT-sEVs enrichment of miR-423-3p under CT exposure can delay wound healing through the ERK or AKT pathway. PABPC1 was found to be a potential target of miR-423-3p (Created by Figdraw)

Similar articles

References

    1. Bukowiecki LJ. Energy balance and diabetes. The effects of cold exposure, exercise training, and diet composition on glucose tolerance and glucose metabolism in rat peripheral tissues. Can J Physiol Pharmacol. 1989;67(4):382–93. - PubMed
    1. Dong M, Yang X, Lim S, et al. Cold exposure promotes atherosclerotic plaque growth and instability via UCP1-dependent lipolysis. Cell Metab. 2013;18(1):118–29. - PMC - PubMed
    1. Li FX, Liu JJ, Xu F, et al. Cold exposure protects against medial arterial calcification development via autophagy. J Nanobiotechnol. 2023;21(1):226. - PMC - PubMed
    1. Gostimirovic M, Novakovic R, Rajkovic J, et al. The influence of climate change on human cardiovascular function. Arch Environ Occup Health. 2020;75(7):406–14. - PubMed
    1. Urbański A, Czarniewska E, Baraniak E, et al. Impact of cold on the immune system of burying beetle, Nicrophorus vespilloides (Coleoptera: Silphidae). Insect Sci. 2017;24(3):443–54. - PubMed

LinkOut - more resources