

A latent transfer learning method for estimating hospital-specific post-acute healthcare demands following SARS-CoV-2 infection
- PMID: 39568467
- PMCID: PMC11573960
- DOI: 10.1016/j.patter.2024.101079
A latent transfer learning method for estimating hospital-specific post-acute healthcare demands following SARS-CoV-2 infection
Erratum in
-
Erratum: A latent transfer learning method for estimating hospital-specific post-acute healthcare demands following SARS-CoV-2 infection.Patterns (N Y). 2025 Jan 23;6(2):101179. doi: 10.1016/j.patter.2025.101179. eCollection 2025 Feb 14. Patterns (N Y). 2025. PMID: 40041852 Free PMC article.
Abstract
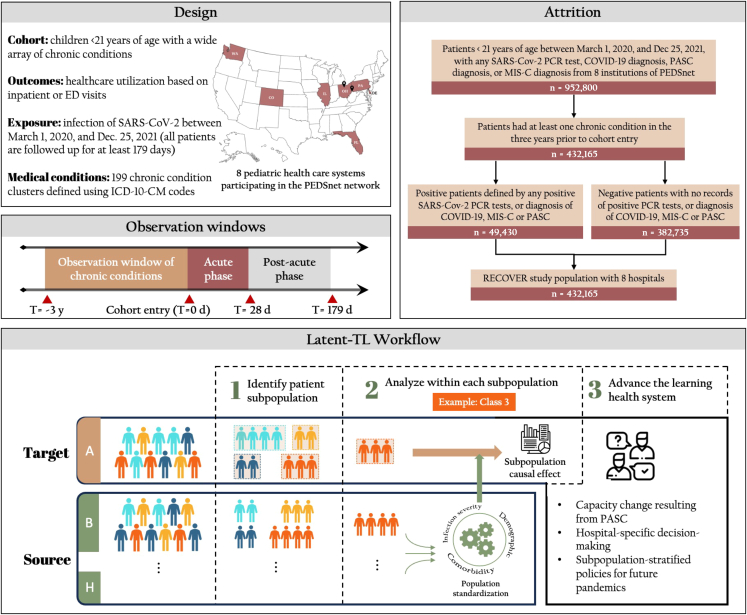
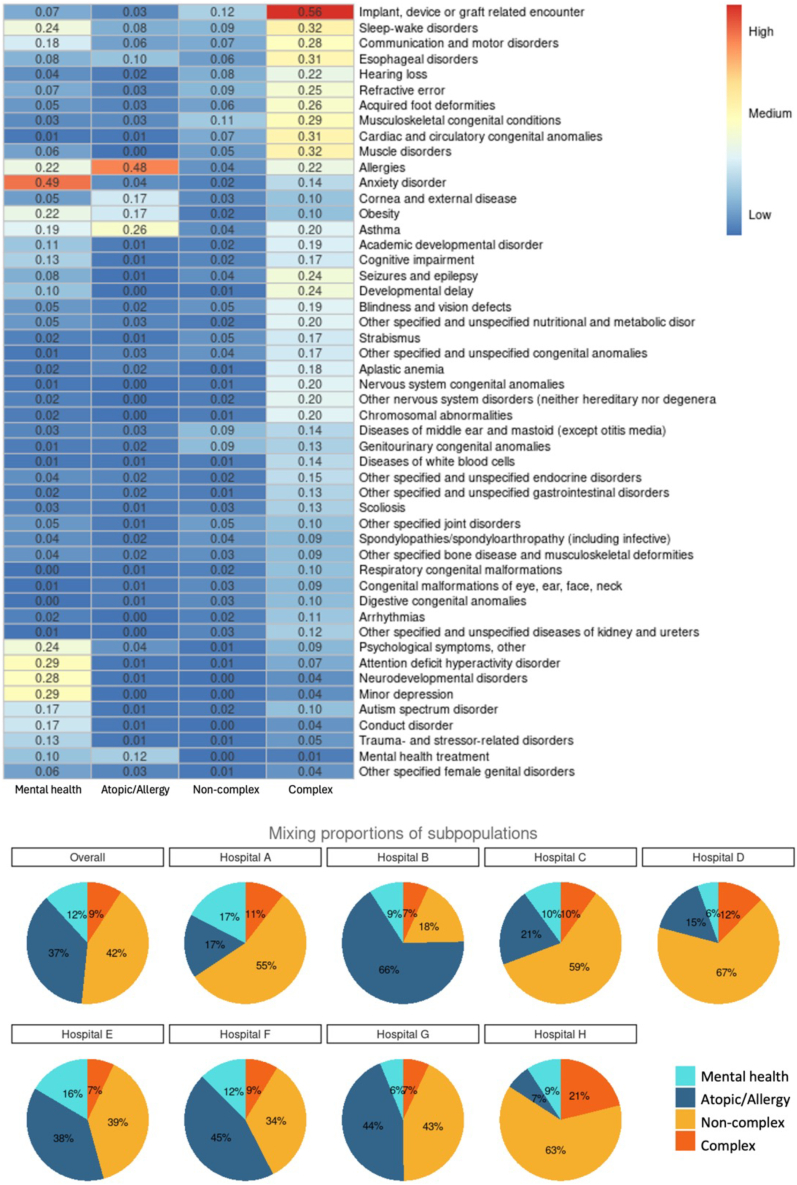
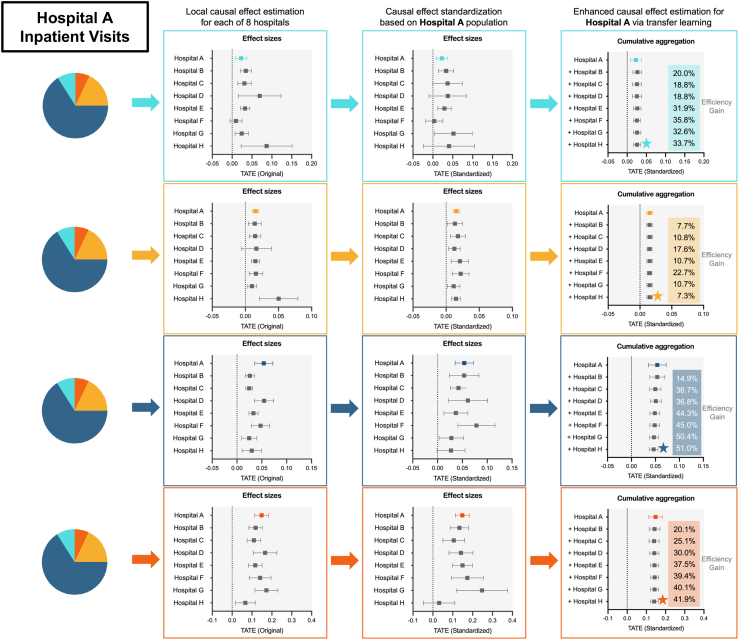
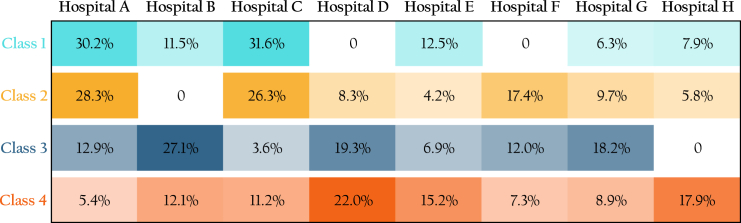
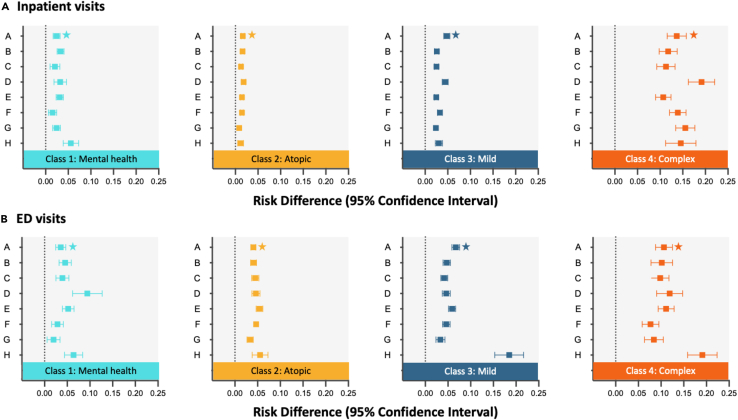
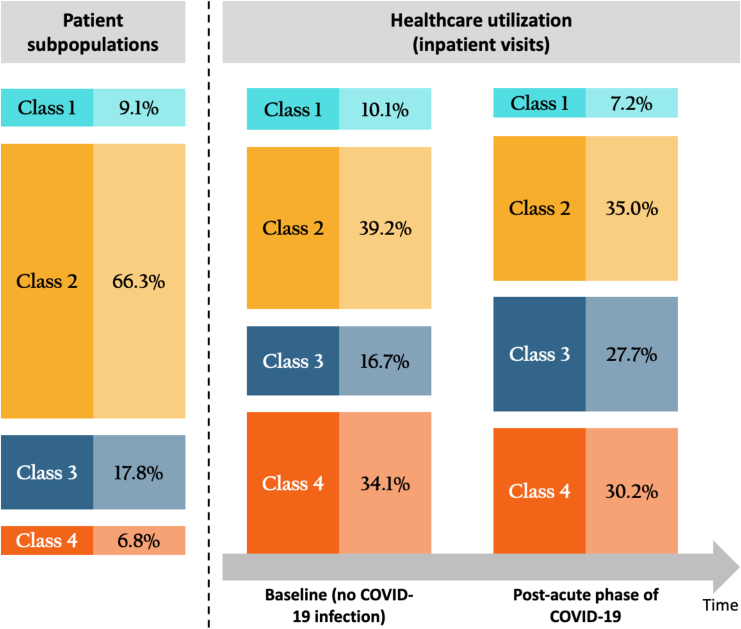
The long-term complications of COVID-19, known as the post-acute sequelae of SARS-CoV-2 infection (PASC), significantly burden healthcare resources. Quantifying the demand for post-acute healthcare is essential for understanding patients' needs and optimizing the allocation of valuable medical resources for disease management. Driven by this need, we developed a heterogeneous latent transfer learning framework (Latent-TL) to generate critical insights for individual health systems in a distributed research network. Latent-TL enhances learning in a specific health system by borrowing information from all other health systems in the network in a data-driven fashion. By identifying subpopulations with varying healthcare needs, our Latent-TL framework can provide more effective guidance for decision-making. Applying Latent-TL to electronic health record (EHR) data from eight health systems in PEDSnet, a national learning health system in the US, revealed four distinct patient subpopulations with heterogeneous post-acute healthcare demands following COVID-19 infections, varying across subpopulations and hospitals.
Keywords: COVID-19; Long COVID; electronic health records; healthcare utilization; learning health system; real-world data; transfer learning.
© 2024 The Author(s).
Conflict of interest statement
The authors declare no competing interests.
Figures
Similar articles
-
Characterization of long COVID temporal sub-phenotypes by distributed representation learning from electronic health record data: a cohort study.EClinicalMedicine. 2023 Sep 14;64:102210. doi: 10.1016/j.eclinm.2023.102210. eCollection 2023 Oct. EClinicalMedicine. 2023. PMID: 37745021 Free PMC article.
-
Machine Learning for Identifying Data-Driven Subphenotypes of Incident Post-Acute SARS-CoV-2 Infection Conditions with Large Scale Electronic Health Records: Findings from the RECOVER Initiative.medRxiv [Preprint]. 2022 Jun 8:2022.05.21.22275412. doi: 10.1101/2022.05.21.22275412. medRxiv. 2022. PMID: 35665007 Free PMC article. Preprint.
-
Risk of post-acute sequelae of SARS-CoV-2 infection associated with pre-coronavirus disease obstructive sleep apnea diagnoses: an electronic health record-based analysis from the RECOVER initiative.Sleep. 2023 Sep 8;46(9):zsad126. doi: 10.1093/sleep/zsad126. Sleep. 2023. PMID: 37166330 Free PMC article.
-
Pathogenic mechanisms of post-acute sequelae of SARS-CoV-2 infection (PASC).Elife. 2023 Mar 22;12:e86002. doi: 10.7554/eLife.86002. Elife. 2023. PMID: 36947108 Free PMC article. Review.
-
Navigating the Spectrum of Two Pediatric COVID-19 Complications: Multi-System Inflammatory Syndrome in Children and Post-Acute Sequelae of SARS-CoV-2 Infection.J Clin Med. 2024 Feb 18;13(4):1147. doi: 10.3390/jcm13041147. J Clin Med. 2024. PMID: 38398460 Free PMC article. Review.
References
-
- Dickerman B.A., Gerlovin H., Madenci A.L., Kurgansky K.E., Ferolito B.R., Figueroa Muñiz M.J., Gagnon D.R., Gaziano J.M., Cho K., Casas J.P., Hernán M.A. Comparative Effectiveness of BNT162b2 and mRNA-1273 Vaccines in U.S. Veterans. N. Engl. J. Med. 2022;386:105–115. doi: 10.1056/NEJMoa2115463. - DOI - PMC - PubMed
-
- Lauring A.S., Tenforde M.W., Chappell J.D., Gaglani M., Ginde A.A., McNeal T., Ghamande S., Douin D.J., Talbot H.K., Casey J.D., et al. Clinical severity of, and effectiveness of mRNA vaccines against, covid-19 from omicron, delta, and alpha SARS-CoV-2 variants in the United States: prospective observational study. BMJ. 2022;376 doi: 10.1136/bmj-2021-069761. - DOI - PMC - PubMed
-
- Smith J.C., Williamson B.D., Cronkite D.J., Park D., Whitaker J.M., McLemore M.F., Osmanski J.T., Winter R., Ramaprasan A., Kelley A., et al. Data-driven automated classification algorithms for acute health conditions: applying PheNorm to COVID-19 disease. J. Am. Med. Inf. Assoc. 2024;31:574–582. doi: 10.1093/jamia/ocad241. - DOI - PMC - PubMed
-
- Zhao J., Grabowska M.E., Kerchberger V.E., Smith J.C., Eken H.N., Feng Q., Peterson J.F., Trent Rosenbloom S., Johnson K.B., Wei W.-Q. ConceptWAS: A high-throughput method for early identification of COVID-19 presenting symptoms and characteristics from clinical notes. J. Biomed. Inf. 2021;117 doi: 10.1016/j.jbi.2021.103748. - DOI - PMC - PubMed
LinkOut - more resources
Full Text Sources
Miscellaneous
