. 2024 Aug 12:75:102731.
doi: 10.1016/j.eclinm.2024.102731. eCollection 2024 Sep.

Exploring the genetics of airflow limitation in lung function across the lifespan - a polygenic risk score study

Natalia Hernandez-Pacheco  1 Anna Kilanowski  2   3 Ashish Kumar  1 John A Curtin  4 Núria Olvera  5   6 Sara Kress  7 Xander Bertels  8   9 Lies Lahousse  8   9 Laxmi Bhatta  10   11   12 Raquel Granell  13 Sergi Marí  14 Jose Ramon Bilbao  14   15 Yidan Sun  16 Casper-Emil Tingskov Pedersen  17 Tarik Karramass  18   19 Elisabeth Thiering  2   3 Christina Dardani  13 Simon Kebede Merid  1 Gang Wang  1   20 Jenny Hallberg  1   21 Sarah Koch  22   23   24 Judith Garcia-Aymerich  22   23   24 Ana Esplugues  24   25   26 Maties Torrent  27 Jesus Ibarluzea  15   28   29   30 Lesley Lowe  4 Angela Simpson  4 Ulrike Gehring  31 Roel C H Vermeulen  31 Graham Roberts  32   33   34 Anna Bergström  35   36 Judith M Vonk  37   38 Janine F Felix  18   39 Liesbeth Duijts  18   19 Klaus Bønnelykke  17 Nic Timpson  13 Guy Brusselle  40   41 Ben M Brumpton  10   11 Arnulf Langhammer  42 Stephen Turner  43 John W Holloway  33   34 Syed Hasan Arshad  32   33   44 Anhar Ullah  45 Adnan Custovic  45 Paul Cullinan  45 Clare S Murray  4 Maarten van den Berge  16   38 Inger Kull  1 Tamara Schikowski  7 Jadwiga A Wedzicha  45 Gerard Koppelman  16   38 Rosa Faner  5   6 Àlvar Agustí  5   6   46   47 Marie Standl  2   48 Erik Melén  1   21 CADSET Clinical Research Collaboration of the European Respiratory Society
Affiliations

Exploring the genetics of airflow limitation in lung function across the lifespan - a polygenic risk score study

Natalia Hernandez-Pacheco et al. EClinicalMedicine. .

Abstract

Background: Chronic obstructive pulmonary disease (COPD) is caused by interactions between many factors across the life course, including genetics. A proportion of COPD may be due to reduced lung growth in childhood. We hypothesized that a polygenic risk score (PRS) for COPD is associated with lower lung function already in childhood and up to adulthood.

Methods: A weighted PRS was calculated based on the 82 association signals (p ≤ 5 × 10⁻⁸) revealed by the largest GWAS of airflow limitation (defined as COPD) to date. This PRS was tested in association with lung function measures (FEV1, FVC, and FEV1/FVC) in subjects aged 4-50 years from 16 independent cohorts participating in the Chronic Airway Diseases Early Stratification (CADSET) Clinical Research Collaboration. Age-stratified meta-analyses were conducted combining the results from each cohort (n = 45,406). These findings were validated in subjects >50 years old.

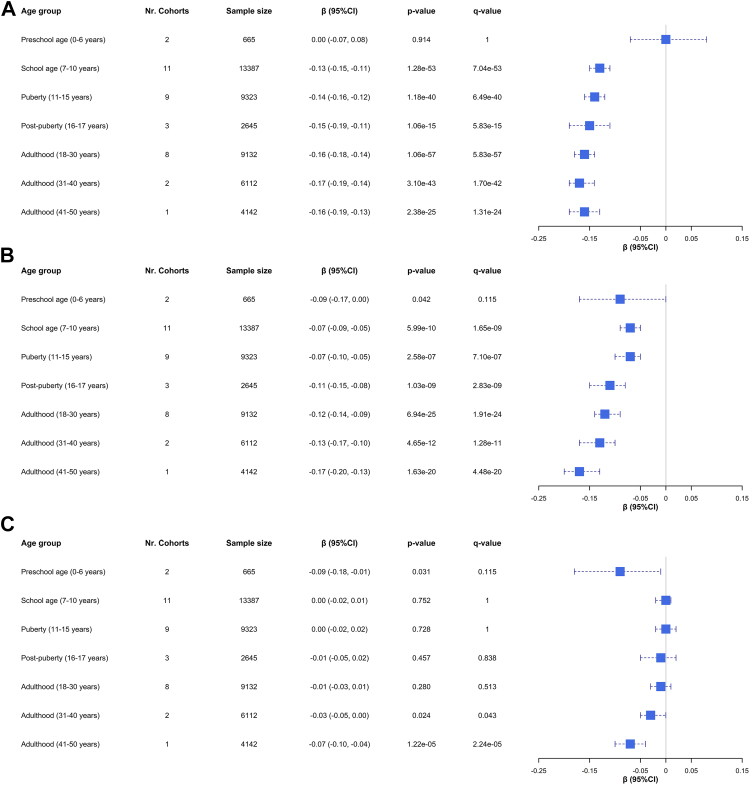
Findings: We found significant associations between the PRS for airflow limitation and: (1) lower pre-bronchodilator FEV1/FVC from school age (7-10 years; β: -0.13 z-scores per one PRS z-score increase [-0.15, -0.11], q-value = 7.04 × 10-53) to adulthood (41-50 years; β: -0.16 [-0.19, -0.13], q-value = 1.31 × 10⁻²⁴); and (2) lower FEV1 (from school age: 7-10 years; β: -0.07 [-0.09, -0.05], q-value = 1.65 × 10⁻⁹, to adulthood: 41-50 years; β: -0.17 [-0.20, -0.13], q-value = 4.48 x 10⁻²⁰). No effect modification by smoking, sex, or a diagnosis of asthma was observed.

Interpretation: We provide evidence that a higher genetic risk for COPD is linked to lower lung function from childhood onwards.

Funding: This study was supported by CADSET, a Clinical Research Collaboration of the European Respiratory Society.

Keywords: Chronic obstructive pulmonary disease; Genetics; Lung function; Polygenic risk score.


Conflict of interest statement

NH-P was supported with a Medium-Term Research Fellowship by the European Academy of Allergy and Clinical Immunology (EAACI) and a Long-Term Research Fellowship by the European Respiratory Society (ERS) (LTRF202101-00861), and lecture honoraria from OMNIPREX, S.L (outside of the submitted work). LLa was supported by the Fund for Scientific Research Flanders (Grant 3G037618), lecture honoraria from IPSA vzw, a non-profit organization facilitating lifelong learning for health care providers, and Chiesi; and consulting fees from AstraZeneca, all paid to the institution. LLa also declares unpaid membership of faculty board and faculty committees of the European Respiratory Society and Belgian Respiratory Society. LB received support from the K.G. Jebsen Center for Genetic Epidemiology funded by Stiftelsen Kristian Gerhard Jebsen; Faculty of Medicine and Health Sciences, NTNU; The Liaison Committee for Education, Research and Innovation in Central Norway; and the Joint Research Committee between St Olavs Hospital and the Faculty of Medicine and Health Sciences, NTNU. YS was supported by a grant from the China Scholarship Council. AL declares consulting fees regarding presentation of spirometry from Diagnostica Ltb and lecture honoraria from AstraZeneca, Boehringer Ingelheim, and GlaxoSmithKline. AC reports research grants funded by MRC, EPSRC, and Wellcome Trust; consulting fees from Worg Pharmaceuticals; lecture honoraria from GlaxoSmithKline, AstraZeneca, Stallergens-Greer, and Sanofi; and unpaid membership of a board of officers of the World Allergy Organization. GK was supported by grants from ZON-MW, Lung Foundation of the Netherlands, UBBO EMMIUS Foundation, GSK, Vertex, European Union (H2020 program), TEVA the Netherlands; consulting fees from AstraZeneca and PURE IMS; lecture fees from AstraZeneca, Boehringer Ingelheim and Sanofi; and participation as a chair at the exquAIro foundation (AI education for medicine and pharma). RF received funding from the European Research Council (ERC) under the European Union's Horizon 2020 research and innovation program (grant agreement No. 101044387), Instituto de Salud Carlos III (PI18/00018, PI21/00735), SEPAR and Serra Hunter Program. AA reports research grants, consulting fees, and lecture honoraria by GlaxoSmithKline, AstraZeneca, Menarini, Chiesi, and Sanofi; and unpaid roles as Chair Board of Directors of GOLD and Co-chair of CADSET. MS received funding from ERC under the European Union's Horizon 2020 research and innovation program (grant agreement No. 949906). EM is supported by grants from the EU (ERC, TRIBAL No 757919). EM also declares advisory board and lecture fees from ALK, AstraZeneca, and Chiesi outside the submitted work. The rest of the authors declare no conflicts of interest that might be perceived to influence the interpretation of this article.

Figures

Fig. 1
Fig. 1
Flowchart of the methodology used for the calculation of the PRS for airflow limitation and its evaluation with spirometry measurements across the lifespan. A total of 82 SNPs associated at the genome-wide significance level (p-value 5 × 10−8) by the largest GWAS of COPD susceptibility published to date were initially selected for the PRS estimation in the current study. Several QC procedures were conducted in the base dataset and each of the cohorts that were part of the target dataset. The association between transformed PRS estimates (z-scores) and GLI z-scores of pre-bronchodilator spirometry measurements was assessed through linear regressions at the different available time points per cohort. The association results from each cohort were combined in an age-stratified meta-analysis by age groups from preschool age to adulthood (up to 50 years of age). Validation of these results was conducted in subjects older than 50 years. Moreover, the potential effect of active smoking, sex, and asthma was evaluated through sensitivity analyses. The proportion of lung function variance explained by the PRS was estimated in large sample-sized cohorts across different age groups. 1KGP: 1000 Genomes Project reference panel; CADSET: Chronic Airway Diseases Early Stratification; COPD: chronic obstructive pulmonary disease; GLI: Global Lung Function Initiative; FEV1: forced respiratory volume in 1 s; FVC: forced vital capacity; GWAS: genome-wide association study; HWE: Hardy–Weinberg equilibrium; INDELs: insertions/deletions; MAF: minor allele frequency; PC: Principal Component of genetic ancestry; PRS: polygenic risk score; QC: quality control; Rsq: imputation quality score; SNP: single nucleotide polymorphism.
Fig. 2
Fig. 2
Forest plot of the effect size of the association between the PRS for airflow limitation and spirometry measurements from preschool age to 50-year-old adulthood. Blue boxes show the association effects in terms of β estimates after meta-analyzing the results from the cohorts included in each age group. The corresponding 95% Confidence Intervals (95% CI) are represented by blue dash lines. The number of cohorts, sample size, effect size, and p-value of the association are also indicated per age group. The q-value represents the adjusted p-value accounting for the false discovery rate. The results shown for the adulthood group including subjects aged between 41 and 50 years correspond to the association results obtained only in HUNT given the absence of more cohorts with available spirometry data within that age range. Results for the age-stratified meta-analysis (random-effects model) are independently shown for each spirometry measurement in terms of z-scores: A) FEV1/FVC; B) FEV1; C) FVC. FEV1: forced expiratory volume in 1 s; FVC: forced vital capacity; PRS: polygenic risk score.
Fig. 3
Fig. 3
Box plot of variance in FEV1/FVC explained by the PRS for airflow limitation across the lifespan. The proportion of the total variance in FEV1/FVC explained by the PRS is shown in the y-axis in terms of R2. The time points from large cohorts from each age group are represented in the x-axis. Boxes are color-coded based on the age group from preschool age to adulthood (>50 years). The median of the R2 is displayed by the thick horizontal line at each box, whereas whiskers extending vertically indicate the minimum and maximum values. The variance explained by the PRS for airflow limitation was estimated including the same sample size and covariates of the basic association model (Principal Components of genetic ancestry and any cohort-specific covariates). FEV1: forced expiratory volume in 1 s; FVC: forced vital capacity; PRS: polygenic risk score; W1: Genotyping Wave 1; W2: Genotyping Wave 2.
Supplementary Figure S1
Supplementary Figure S2A
Supplementary Figure S2B
Supplementary Figure S2C
Supplementary Figure S2D
Supplementary Figure S2E
Supplementary Figure S2F
Supplementary Figure S2G
Supplementary Figure S2H
Supplementary Figure S2I
Supplementary Figure S2J
Supplementary Figure S2K
Supplementary Figure S2L
Supplementary Figure S2M
Supplementary Figure S2N
Supplementary Figure S2O
Supplementary Figure S2P
Supplementary Figure S3
Supplementary Figure S4A
Supplementary Figure S4B
Supplementary Figure S5A
Supplementary Figure S5B
Supplementary Figure S5C
Supplementary Figure S5D
Supplementary Figure S5E
Supplementary Figure S5F
Supplementary Figure S5G
Supplementary Figure S6
Supplementary Figure S7
Supplementary Figure S8
Supplementary Figure S9
Supplementary Figure S10
Supplementary Figure S11A
Supplementary Figure S11B
Supplementary Figure S12A
Supplementary Figure S12B

References

    1. Melén E., Faner R., Allinson J.P., et al. Lung-function trajectories: relevance and implementation in clinical practice. Lancet. 2024;403(10435):1494–1503. - PubMed
    1. Agusti A., Faner R. Lung function trajectories in health and disease. Lancet Respir Med. 2019;7(4):358–364. - PubMed
    1. Dharmage S.C., Bui D.S., Walters E.H., et al. Lifetime spirometry patterns of obstruction and restriction, and their risk factors and outcomes: a prospective cohort study. Lancet Respir Med. 2023;11(3) - PubMed
    1. Bui D.S., Lodge C.J., Burgess J.A., et al. Childhood predictors of lung function trajectories and future COPD risk: a prospective cohort study from the first to the sixth decade of life. Lancet Respir Med. 2018;6(7):535–544. - PubMed
    1. Belgrave D.C.M., Granell R., Turner S.W., et al. Lung function trajectories from pre-school age to adulthood and their associations with early life factors: a retrospective analysis of three population-based birth cohort studies. Lancet Respir Med. 2018;6(7):526–534. - PubMed

LinkOut - more resources