. 2024 Nov 13;15(47):19820-19833.
doi: 10.1039/d4sc04962d. eCollection 2024 Dec 4.

A multifunctional "three-in-one" fluorescent theranostic system for hepatic ischemia-reperfusion injury

Affiliations

A multifunctional "three-in-one" fluorescent theranostic system for hepatic ischemia-reperfusion injury

Jihong Liu et al. Chem Sci. .

Abstract

Hepatic ischemia-reperfusion injury (HIRI) is the main cause of postoperative liver dysfunction and liver failure. Traditional separation of HIRI diagnosis and therapy confers several disadvantages, including the inability to visualize the therapeutic and asynchronous action. However, developing a versatile material with integrated diagnosis and treatment for HIRI remains a great challenge. Given that hypochlorous acid (HOCl) plays a crucial oxidative role in HIRI, we developed a single-component multifunctional fluorescent theranostic platform (MB-Gly) with a "three-in-one" molecular design incorporating a near-infrared fluorophore methylene blue, glycine and a HOCl-response unit, which could not only provide real-time visualization of HIRI but also boost targeted drug delivery. Using MB-Gly, we were able to achieve real-time and dynamic monitoring of HOCl during HIRI in hepatocytes and mouse livers and reduce the liver damage in hepatocytes and mice. RNA sequencing illustrated the therapeutic role of MB-Gly associated with changes in gene expression related to apoptosis, oxidative stress, metabolism and inflammation. To the best of our knowledge, this is the first multifunctional fluorescent theranostic system for HIRI reported to date. Our smart "three-in-one" approach shines light on the etiology and pathogenesis of HIRI, providing profound insights into the development of potential therapeutic targets.


Conflict of interest statement

There are no conflicts to declare.

Figures

Scheme 1
Scheme 1. Schematic diagram of the fluorescence regulation mechanism and the action of MB-Gly during HIRI. (A) Luminescence mechanism of MB-Gly and the release of MB and glycine. (B) “Three-in-one” strategy of MB-Gly integrated with NIR fluorescence signaling, drug delivery and HOCl activation. (C) Multifunctional fluorescent theranostic material (MB-Gly) for monitoring and alleviation of HIRI mice.
Fig. 1
Fig. 1. Spectral response of MB-Gly toward HOCl. (A) Schematic diagram of MB and glycine released by MB-Gly in response to HOCl. (B) Absorption spectra of MB-Gly (25 μM) after reaction with HOCl (0–38 μM). (C) Fluorescence spectra of MB-Gly after reaction with HOCl (0–38 μM). λex = 620 nm. (D) Linear relationship of the fluorescence intensity of MB-Gly at 687 nm with HOCl. (E) and (F) Fluorescence response of MB-Gly to ROS, RNS, amino acids and metal ions. λex/em = 620/687 nm. (G) Fluorescence intensity changes of MB-Gly before and after reaction with HOCl in different pH environments. (H) Absorption spectra of MB, MB-Gly before and after the reaction with HOCl (38 μM). (I) Release efficiency of MB from MB-Gly in the presence of HOCl. (J) HPLC analysis of MB, MB-Gly and MB-Gly after reaction with HOCl.
Fig. 2
Fig. 2. Fluorescence imaging analysis of endogenous HOCl in hepatocytes. (A) Fluorescence images of endogenous HOCl in hepatocytes treated with LPS (1 μg mL−1), LPS (1 μg mL−1) & PMA (1 μg mL−1), ABH (500 μM), and NAC (500 μM) by MB-Gly (50 μM, λex = 638 nm, λem = 643–775 nm) and Hoechst 33342 (1 μg mL−1, λex = 405 nm, λem = 420–535 nm). (B) and (C) Relative red fluorescence intensity output of (A) and (D), respectively. The red fluorescence intensity of the control group was defined as 1. (D) Fluorescence images of endogenous HOCl in the control group hepatocytes, HIRI group hepatocytes, and HIRI group pretreated with As-IV (500 μM), TMP (500 μM), ATRA (500 μM), edaravone (500 μM), NAC (500 μM), and melatonin (500 μM) by MB-Gly (50 μM, λex = 638 nm, λem = 643–775 nm). The data are expressed as the mean ± SD. ***P < 0.001.
Fig. 3
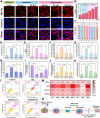
Fig. 3. Fluorescence imaging analysis and therapeutic effect of MB-Gly on HIRI hepatocytes. (A) Fluorescence imaging of endogenous HOCl in hepatocytes during HIRI by MB-Gly (50 μM, λex = 638 nm, λem = 643–775 nm) and Hoechst 33342 (1 μg mL−1, λex = 405 nm, λem = 420–535 nm). (B) Relative red fluorescence intensity output of (A). The red fluorescence intensity of the control group was defined as 1. (C) Cytotoxicity assessment of MB-Gly, MB and glycine. (D) LDH release. (E) TNF-α release. (F) AST activity. (G) ALT activity. (H) Ca2+ content. (I) ATP content. (J) MDA content. (K) ROS levels. (L) Flow cytometry of hepatocytes. (M) Integration of multiple biomarkers in the control group, HIRI group, glycine-treated HIRI group and MB-Gly-treated HIRI group. The concentrations of all biomarkers in the control group were defined as 1. (N) Schematic diagram of assessment of the therapeutic effect of MB-Gly and glycine on HIRI hepatocytes.
Fig. 4
Fig. 4. Fluorescence imaging and the therapeutic effect of MB-Gly on HIRI mice. (A) Schematic diagram of the procedure of using MB-Gly for the imaging and treatment of HIRI mice. (B) Dynamic fluorescence imaging of HOCl in vivo during the HIRI process. λex = 620 nm, λem = 670 nm. (C) Relative fluorescence intensity of livers in the control group and HIRI group mice. (D) Fluorescence imaging of major organs in vitro. λex = 620 nm, λem = 670 nm. (E) 3D fluorescence imaging of HOCl in liver sections of mice. λex = 638 nm, λem = 643–775 nm. (F) Relative fluorescence intensity of liver sections. (G) Serum ALT content. (H) Serum AST content. (I) Serum TNF-α content. (J) MDA concentrations in liver tissues. (K) H&E staining of liver tissues.
Fig. 5
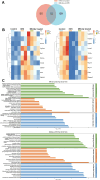
Fig. 5. Differential analysis of RNA expression in mouse livers. (A) Venn diagram showing DEGs in the HIRI group vs. control group and the HIRI group vs. MB-Gly-treated HIRI group. (B) Cluster analysis of DEGs between the control group, HIRI group and MB-Gly-treated HIRI group. (C) GO terms of DEGs in the control group, HIRI group and MB-Gly-treated HIRI group. Green: biological process; orange: cellular component; blue: molecular function.

Similar articles

References

    1. Serracino-Inglott F. Habib N. A. Mathie R. T. Hepatic ischemia-reperfusion injury. Am. J. Surg. 2001;181:160–166. doi: 10.1016/S0002-9610(00)00573-0. - DOI - PubMed
    1. Kupiec-Weglinski J. W. Busuttil R. W. Ischemia and Reperfusion Injury in Liver Transplantation. Transplant. Proc. 2005;37:1653–1656. doi: 10.1016/j.transproceed.2005.03.134. - DOI - PubMed
    1. Nastos C. Kalimeris K. Papoutsidakis N. Tasoulis M.-K. Lykoudis P. M. Theodoraki K. Nastou D. Smyrniotis V. Arkadopoulos N. Global Consequences of Liver Ischemia/Reperfusion Injury. Oxid. Med. Cell. Longevity. 2014;2014:906965. - PMC - PubMed
    1. Song D. Li C. Zhu M. Chi S. Liu Z. Tracking Hepatic Ischemia-Reperfusion Injury in Real Time with a Reversible NIR-IIb Fluorescent Redox Probe. Angew. Chem., Int. Ed. 2022;61:e202212721. doi: 10.1002/anie.202212721. - DOI - PubMed
    1. Qiu C. Yin T. Zhang Y. Lian Y. You Y. Wang K. Zheng R. Shuai X. Ultrasound Imaging Based on Molecular Targeting for Quantitative Evaluation of Hepatic Ischemia–Reperfusion Injury. Am. J. Transplant. 2017;17:3087–3097. doi: 10.1111/ajt.14345. - DOI - PubMed

LinkOut - more resources