. 2024 Nov 8;15(47):19745-19751.
doi: 10.1039/d4sc04833d. eCollection 2024 Dec 4.

Wiring proton gradients for energy conversion

Affiliations

Wiring proton gradients for energy conversion

Xinchen Dai et al. Chem Sci. .

Abstract

Light-switchable buffer solutions based on merocyanine photoacids can be used as efficient photoenergy harvesting systems. Varying the solvation environment of merocyanine photoacids in water-methanol mixtures allows one to carefully tune their photoacidity, relaxation kinetics, and solubility, opening up the possibility to install persistent pH gradients of approximately 4 pH units under 500 nm light. When interfaced between two electrodes and exposed to asymmetric light irradiation, these solutions can be photoactivated precisely both in space and time, generating open circuit voltages as high as 240 mV that can last hours under steady-state irradiation - an outcome that is akin the peak performance of biological transmembrane proton pumps.


Conflict of interest statement

There are no conflicts to declare.

Figures

Fig. 1
Fig. 1. (a) Simplified view of bR photocycle highlighting the coupling of retinal Schiff base isomerization with proton transfer reactions. (b) Illustration of the vectorial proton translocation mediated by bR in Halobacteria and corresponding peak performance.
Fig. 2
Fig. 2. (a) Four-state model describing MCHs' operation in aqueous environments: visible light-triggered isomerization (upper-right path) contrasts with thermal relaxation (bottom-left path), where the SP ring-opening is the rate-determining step. Substituents are omitted for the sake of clarity. (b) Working principle of the energy harvesting device employed in this study: asymmetric light irradiation of a tube-shaped cell filled with a solution of compound 1 triggers the formation of a persistent proton concentration gradient (ΔpH) across the cell corresponding to an open circuit voltage, VOC (mV) = 0.2·T·ΔpH (see below).
Fig. 3
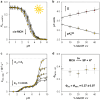
Fig. 3. The ground state acid–base properties as a function of the solvent composition. Shades of colour represent the effective% MeOH v/v at which each experiment was carried out, as summarized in plot (d). Absorbance profiles of MCH (a) and MC (b) at equilibrium obtained as a function; each solid black line represents the best fit to eqn (S1). (c) Kinetic profiles of MC equilibration at high pH; solid black lines represent the best fits to a first-order decay model (eqn (S2), see ESI for more details†). (d) Obtained trends of pKGSa, pKa, and pKc as a function of % MeOH v/v. Experimental conditions: [1] = 29 ± 1 μM, [phosphate buffers] = 20 mM, T = 25 °C.
Fig. 4
Fig. 4. The metastable-state acid–base properties as a function of the solvent composition. Shades of colour represent the effective % MeOH v/v at which each experiment was carried out, as summarized in plots (c) and (d). (a) Absorbance profiles of cis-MCH under continuous light irradiation (500 nm, 90 mW) obtained as a function of the pH; each solid black line represents the best fit to eqn (S1). (b) Obtained trends for pKMSa and Π as a function of % MeOH v/v. (c) Kinetic profiles of relaxation as a function of the pH; each solid black line represents the best fit to eqn (S3). (d) Quantum yield of the MCH-to-SP reaction. Experimental conditions: [1] = 29 ± 1 μM, [phosphate buffers] = 20 mM or standard HCl solutions, T = 25 °C.
Fig. 5
Fig. 5. The light-switchable buffer characteristics in 40% MeOH v/v. pH (a) and total concentration (b) of the resulting buffer solutions under dark conditions as a function of α, the solid black line represents the best fit to the corresponding model equation. (c) Values of ΔpH obtained under intense light irradiation as a function of α. (d) Tuning of ΔpH by modulation of the light intensity. Experimental conditions: T = 25 °C, 500 nm LED-light irradiance, (c) 55.6; (d) 55.6, 22.0, 21.4, 20.1, 18.8, 17.8, 17.2 mW cm−2 from left to right, respectively (see ESI for more details about the photochemical setup); the time intervals under light irradiation are highlighted by cyan-coloured areas.
Fig. 6
Fig. 6. Validation of the photoenergy harvesting mechanism. (a) Representative pictures of our cylindrically-shaped electrochemical cell filled with the light-switchable buffer before (i), during (ii), and after (iii) asymmetric 500 nm LED light irradiation. (b) Proposed working mechanism highlighting the correlation of the pH gradient (ΔpH = pH − pH+) with the open-circuit voltage (VOC) and the short-circuit current (ISC). (c) Chronopotentiometry experiment over four light/dark cycles (i → ii → iii) at different irradiances; dotted red lines represent the initial rate change of voltage. (d) Observed rate constant of proton release as a function of the photon flux normalized by the total number of molecules in solution (Nλ/N). Experimental conditions: [1] = 7.6 ± 0.4 mM in 40% MeOH v/v, α = 1.2, T = 22 °C, 500 nm LED-light irradiance: 14.0, 8.7, 5.4, and 4.7 mW cm−2 from left to right, respectively; the time intervals under light irradiation are highlighted by cyan-coloured areas.
Fig. 7
Fig. 7. Sunlight-to-protonic energy conversion. (a) Proton concentration gradient (ΔpH) as a function of the inverse of irradiance obtained with (i) the photochemical apparatus for pH jumps studies (blue circles) and (ii) the electrochemical cell under asymmetric light irradiation (green circles). Chronopotentiometry (b and d) and chronoamperometry (c) experiments over one cycle (i → ii → iii) at 75 mW cm−2. Experimental conditions: [1] = 7.6 ± 0.4 mM in 40% MeOH v/v, α = 1.2, T = 22 °C; the time intervals under light irradiation are highlighted by cyan-coloured areas.

References

    1. Lane N. BioEssays. 2017;39:1600217. doi: 10.1002/bies.201600217. - DOI - PubMed
    1. Mitchell P. Nature. 1961;191:144–148. doi: 10.1038/191144a0. - DOI - PubMed
    2. Hahn A. Vonck J. Mills D. J. Meier T. Kühlbrandt W. Science. 2018;360:eaat4318. doi: 10.1126/science.aat4318. - DOI - PMC - PubMed
    1. Mitchell P. Bioenergetics. 1972;3:5–24. doi: 10.1007/BF01515993. - DOI - PubMed
    1. Oesterhelt D. Angew Chem. Int. Ed. Engl. 1976;15:17–24. doi: 10.1002/anie.197600171. - DOI - PubMed
    1. Lanyi J. P. Annu. Rev. Physiol. 2004;66:665–688. doi: 10.1146/annurev.physiol.66.032102.150049. - DOI - PubMed

LinkOut - more resources