. 2024 Nov 2:29:101325.
doi: 10.1016/j.mtbio.2024.101325. eCollection 2024 Dec.

Mechanical confinement matters: Unveiling the effect of two-photon polymerized 2.5D and 3D microarchitectures on neuronal YAP expression and neurite outgrowth

Affiliations

Mechanical confinement matters: Unveiling the effect of two-photon polymerized 2.5D and 3D microarchitectures on neuronal YAP expression and neurite outgrowth

Ahmed Sharaf et al. Mater Today Bio. .

Abstract

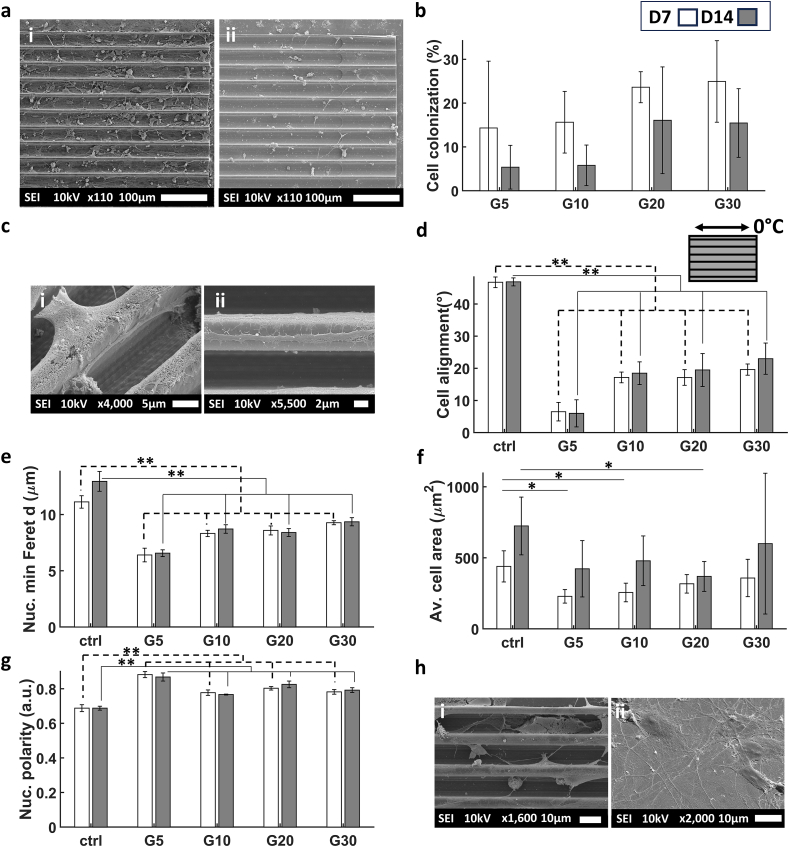
The effect of mechanical cues on cellular behaviour has been reported in multiple studies so far, and a specific aspect of interest is the role of mechanotransductive proteins in neuronal development. Among these, yes-associated protein (YAP) is responsible for multiple functions in neuronal development such as neuronal progenitor cells migration and differentiation while myocardin-related transcription factor A (MRTFA) facilitates neurite outgrowth and axonal pathfinding. Both proteins have indirectly intertwined fates via their signalling pathways. There is little literature investigating the roles of YAP and MRTFA in vitro concerning neurite outgrowth in mechanically confined microenvironments. Moreover, our understanding of their relationship in immature neurons cultured within engineered confined microenvironments is still lacking. In this study, we fabricated, via two-photon polymerization (2PP), 2.5D microgrooves and 3D polymeric microchannels, with a diameter range from 5 to 30 μm. We cultured SH-SY5Y cells and differentiated them into immature neuron-like cells on both 2.5D and 3D microstructures to investigate the effect of mechanical confinement on cell morphology and protein expression. In 2.5D microgrooves, both YAP and MRTFA nuclear/cytoplasmic (N/C) ratios exhibited maxima in the 10 μm grooves indicating a strong relation with mechanical-stress-inducing confinement. In 3D microchannels, both proteins' N/C ratio exhibited minima in presence of 5 or 10 μm channels, a behaviour that was opposite to the ones observed in the 2.5D microgrooves and that indicates how the geometry and mechanical confinement of 3D microenvironments are unique compared to 2.5D ones due to focal adhesion, actin, and nuclear polarization. Further, especially in presence of 2.5D microgrooves, cells featured an inversely proportional relationship between YAP N/C ratio and the average neurite length. Finally, we also cultured human induced pluripotent stem cells (hiPSCs) and differentiated them into cortical neurons on the microstructures for up to 2 weeks. Interestingly, YAP and MRTFA N/C ratios also showed a maximum around the 10 μm 2.5D microgrooves, indicating the physiological relevance of our study. Our results elucidate the possible differences induced by 2.5D and 3D confining microenvironments in neuronal development and paves the way for understanding the intricate interplay between mechanotransductive proteins and their effect on neural cell fate within engineered cell microenvironments.


Conflict of interest statement

The authors declare that they have no known competing financial interests or personal relationships that could have appeared to influence the work reported in this paper.

Figures

Image 1
Graphical abstract
Fig. 1
Fig. 1
Representative SEM images of (a) and (b) G30 arrays, (c) and (d) G10 arrays. SEM images taken at 90° tilt angle of (e) G5 arrays, (f) G10 arrays, (g) G20 arrays, and (h) G30 arrays. The dimensions of the arrays of microgrooves were 750 × 750 × 15 μm3.
Fig. 2
Fig. 2
Representative SEM images of (a) 250 × 250 μm2 arrays of 3D microchannels, (b) C30 microchannels, (c) C20 microchannels, (d) ADC10 microchannels. SEM images taken at 90° angle of (e) C5 microchannels (f) ADC5 microchannels (g) C10 microchannels (h) ADC10 microchannels (i) C20 microchannels and (j) C30 microchannels.
Fig. 3
Fig. 3
(a) Representative SEM images of (i) SH-SY5Y cells at D1 in G20, (ii) cells at D3 in G20. (b) The percentage of SH-SY5Y cell colonization in the 2.5D microgrooves calculated as the ratio between the total area of cell bodies with respect to the total area of the microgrooves. (c) SEM images showing the alignment of SH-SY5Y cells at D1 in (i) G20, and D3 in (ii) G5. (c.iii) Illustration of the major axis of the microgroove which represents the 0° angle. It also shows a schematic representation of nuclei at an angle of 45 °C with respect to the major axis of the microgrooves. (d) Degree of SH-SY5Y cell alignment on the microgrooves. (e) Average minimum Feret diameter of the cells nuclei. (f) Nuclear polarity of the SH-SY5Y cells (where 0 signifies a perfect circle and 1 a straight line). The white and grey bars represent D1 and D3 respectively. ∗ corresponds to a p-value <0.05 and ∗∗ corresponds to a p-value <0.01. P-values were obtained by two-tailed student's t-test. n = 6 samples for each timepoint.
Fig. 4
Fig. 4
(a) Average area of the SH-SY5Y cell body (calculated from actin staining of the cytoskeleton). SEM images of SH-SY5Y immature neuron-like cells at D3 in (b) G10, (c) G5, (d) G30, and (e) on the flat ITO-coated glass substrate (ctrl). The white and grey bars represent D1 and D3 respectively. ∗ corresponds to a p-value <0.05 and ∗∗ corresponds to a p-value <0.01. P-values were obtained by two-tailed student's t-test. n = 6 samples for each timepoint.
Fig. 5
Fig. 5
(a) Maximum Z-projection images obtained via confocal microscopy of the SH-SY5Y immature neuron-like cells at D3 of differentiation on ctrl and G10. (b) YAP N/C ratio. (c) Average total length of processes per cell. (d) MRTFA N/C ratio (e) MAP2 average intensity. The white and grey bars represent D1 and D3 respectively. ∗ corresponds to a p-value <0.05 and ∗∗ corresponds to a p-value <0.01. P-values were obtained by two-tailed student's t-test. For YAP and MRTFA N/C ratios and MAP2 intensity, n = 3 samples for each time point. For neurite average length, n = 6 samples for each time point. Scale bar = 50 μm.
Fig. 6
Fig. 6
(a) Confocal maximum Z-projection of SH-SY5Y immature neuron-like cells at D3. (b) SEM images of filopodia adhering to 2.5D microgrooves (i), (ii), (iii) and the flat ITO-coated glass ctrl (iv). (c) The average number of FAs per cell. (d) Average FA area per cell. (e) Average alignment of FAs. The white and grey bars represent D1 and D3 respectively. ∗ corresponds to a p-value <0.05 and ∗∗ corresponds to a p-value <0.01. P-values were obtained by two-tailed student's t-test. n = 3 samples for each time point. Scale bar = 20 μm.
Fig. 7
Fig. 7
(a) The percentage of SH-SY5Y cell colonization of in the 3D microchannels calculated as the ratio between the total area of cell bodies with respect to the total area of the 3D microchannels. (b) Representative SEM images of (i) and (ii) cells probing the entrance of the 3D microchannels via filopodia. (c) Degree of cell alignment on the microchannels. (d) Confocal maximum Z-projection images of the inner volume of the microchannels showing the alignment of cells at D3. Scale bar in the first row = 50 μm and the second row = 30 μm. (e) The average maximum Feret diameter of the cells. (f) The average minimum Feret diameter of the cells. (g) The average cell body area. (h) Confocal maximum Z-projection images of the inner volume of the channels exhibiting the substantial elongation of the cell nuclei in ADC5 compared to other channels and the flat substrate. The white and grey bars represent D1 and D3 respectively. Scale bars in the first, second, third, and fourth rows = 50, 10, 15 and 30 μm respectively. ∗ corresponds to a p-value <0.05 and ∗∗ corresponds to a p-value <0.01. P-values were obtained by two-tailed student's t-test. n = 6 samples for each time point.
Fig. 8
Fig. 8
(a) Maximum Z-projection images obtained via confocal microscopy of the SH-SY5Y immature neuron-like cells at D3 of differentiation. Scale bars in the first, second, third, and fifth rows = 50, 30, 30 and 15 μm respectively. (b) YAP N/C ratio. (c) Average total length of processes per cell. (d) MRTFA N/C ratio. (e) MAP2 average intensity. The white and grey bars represent D1 and D3 respectively. ∗ corresponds to a p-value <0.05 and ∗∗ corresponds to a p-value <0.01. P-values were obtained by two-tailed student's t-test. For YAP and MRTFA N/C ratios and MAP2 intensity, n = 3 samples for each time point. For neurite average length, n = 6 samples for each time point.
Fig. 9
Fig. 9
(a) Confocal maximum Z-projection of SH-SY5Y immature neuron-like cells at D3. Scale bars in the first, fourth and fifth rows = 20, 15 and 15 μm respectively. (b) The average number of FAs per cell. (c) Average FA area per cell. (d) Average alignment of FAs. The white and grey bars represent D1 and D3 respectively. ∗ corresponds to a p-value <0.05 and ∗∗ corresponds to a p-value <0.01. P-values were obtained by two-tailed student's t-test. n = 3 samples for each time point.
Fig. 10
Fig. 10
(a) Representative SEM images of hiPSC-neurons (i) at D7 in G20 and (ii) at D14 in G20. (b) The percentage of cell colonization of hiPSC-derived neurons in the 2.5D microgrooves calculated as the ratio between the total area of cell bodies with respect to the total area of the microgrooves. (c) SEM images showing the alignment and connectivity of cells at D7 in (i) G10 and (ii) G5. (d) Degree of cell alignment in the 2.5D microgrooves. (e) The average minimum Feret diameter of the cells. (f) The average area of the cell bodies. (g) The average nuclear polarity (where 0 signifies a perfect circle and 1 a straight line). The white and grey bars represent D7 and D14 respectively. (h) SEM images illustrating the polarity of the cells at D7 in (i) G10 vs. (ii) the flat substrate (ctrl). The white and grey bars represent D7 and D14 respectively. ∗ corresponds to a p-value <0.05 and ∗∗ corresponds to a p-value <0.01. P-values were obtained by two-tailed student's t-test. n = 3 samples for each time point.
Fig. 11
Fig. 11
(a) Maximum Z-projection images obtained via confocal microscopy of the hiPSC-neurons at D7 of differentiation. (b) YAP N/C ratio. (c) Average total length of processes per cell. (d) MRTFA N/C ratio. (e) MAP2 average intensity. The white and grey bars represent D7 and D14 respectively. For YAP N/C ratio, n = 3 samples for each time point. For neurite average length, n = 4 samples for each time point. For MRTFA N/C ratio and MAP2 intensity, n = 1 sample for each time point. Scale bar = 50 μm.
Fig. 12
Fig. 12
(a) Confocal maximum Z-projection of hiPSC-derived neurons at D7. (b) The average number of FAs per cell. (c) Average FA area per cell. (d) Average FA diameter per cell. The white and grey bars represent D7 and D14 respectively. n = 1 sample for each time point. Scale bar = 30 μm.

Similar articles

References

    1. Hippler M., Lemma E.D., Bertels S., Blasco E., Barner‐Kowollik C., Wegener M., Bastmeyer M. 3D scaffolds to study basic cell biology. Adv. Mater. 2019;31 doi: 10.1002/adma.201808110. - DOI - PubMed
    1. Leclech C., Villard C. Cellular and subcellular contact guidance on microfabricated substrates. Front. Bioeng. Biotechnol. 2020;8 doi: 10.3389/fbioe.2020.551505. - DOI - PMC - PubMed
    1. Zonderland J., Moroni L. Steering cell behavior through mechanobiology in 3D: a regenerative medicine perspective. Biomaterials. 2021;268 doi: 10.1016/j.biomaterials.2020.120572. - DOI - PubMed
    1. Motz C.T., Kabat V., Saxena T., Bellamkonda R.V., Zhu C. Neuromechanobiology: an expanding field driven by the force of greater focus. Adv. Healthcare Mater. 2021;10 doi: 10.1002/adhm.202100102. - DOI - PMC - PubMed
    1. Chighizola M., Dini T., Lenardi C., Milani P., Podestà A., Schulte C. Mechanotransduction in neuronal cell development and functioning. Biophys Rev. 2019;11:701–720. doi: 10.1007/s12551-019-00587-2. - DOI - PMC - PubMed

LinkOut - more resources