Comparative Study
. 2024 Nov 6:15:1427842.
doi: 10.3389/fimmu.2024.1427842. eCollection 2024.

NET-EN treatment leads to delayed HSV-2 infection, enhanced mucin and T cell functions in the female genital tract when compared to DMPA in a preclinical mouse model

Affiliations
Comparative Study

NET-EN treatment leads to delayed HSV-2 infection, enhanced mucin and T cell functions in the female genital tract when compared to DMPA in a preclinical mouse model

M Firoz Mian et al. Front Immunol. .

Abstract

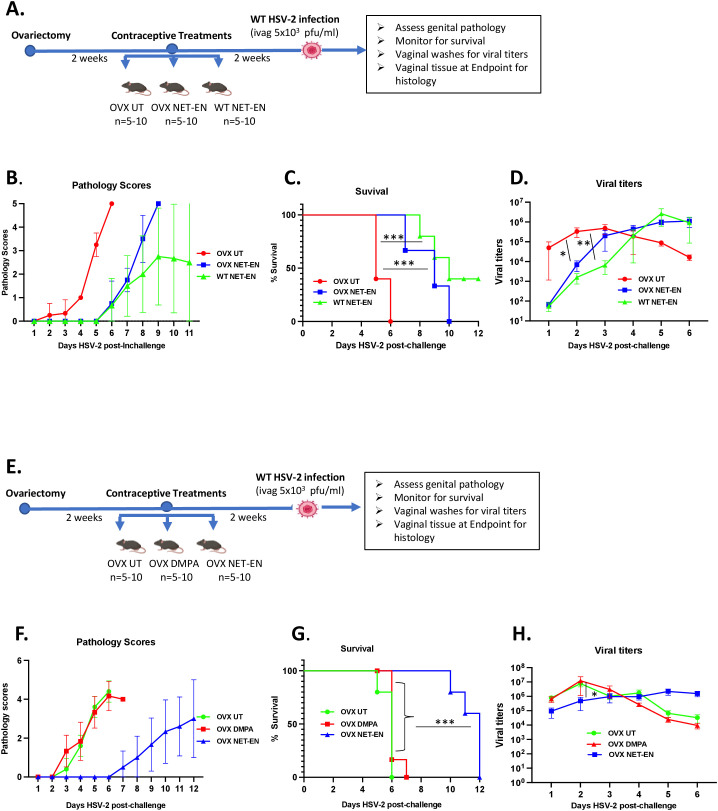
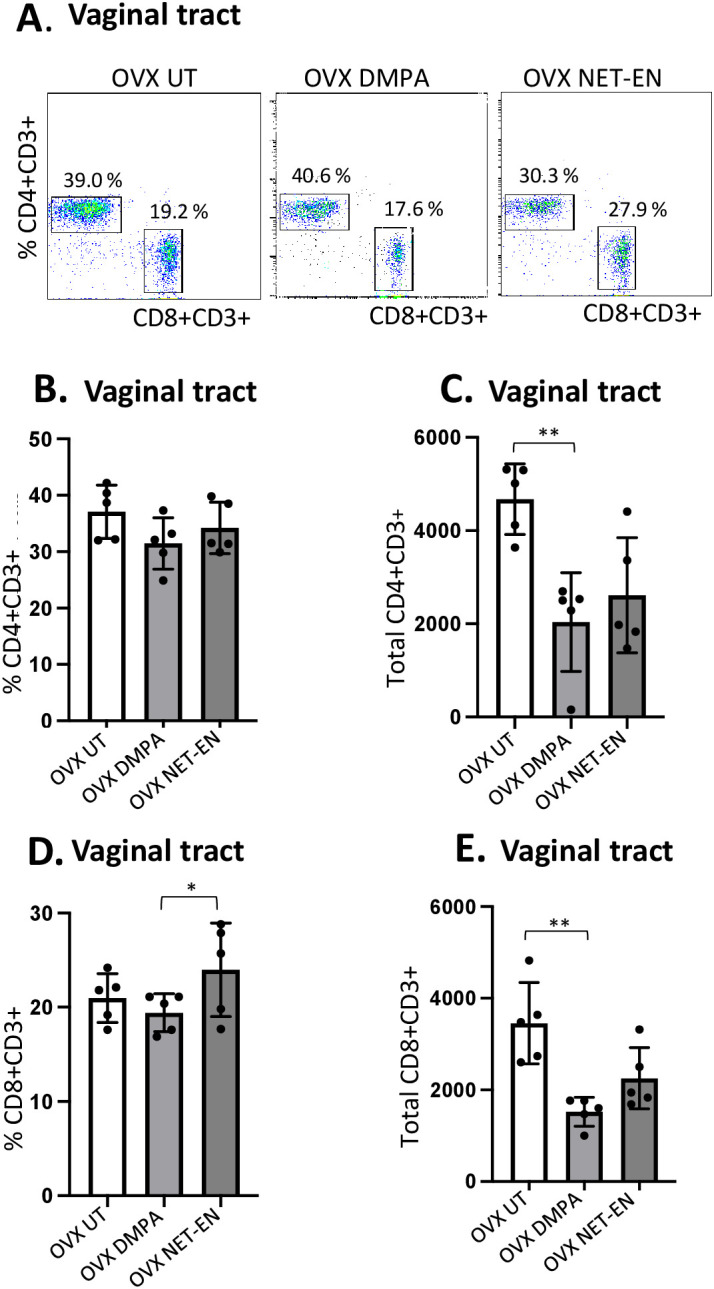
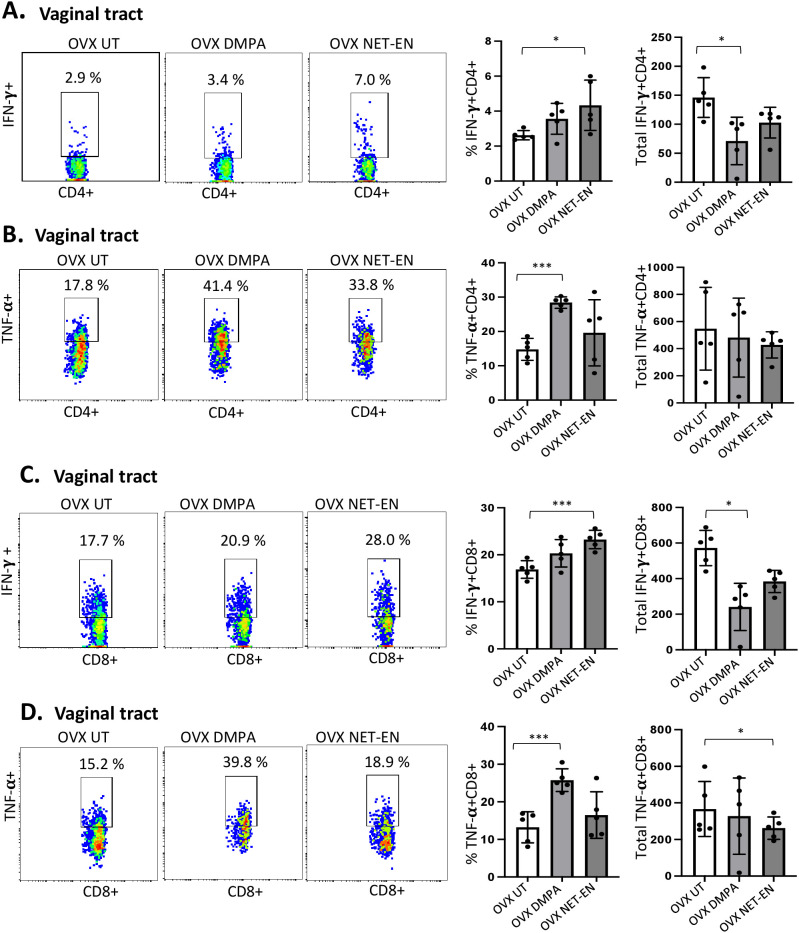
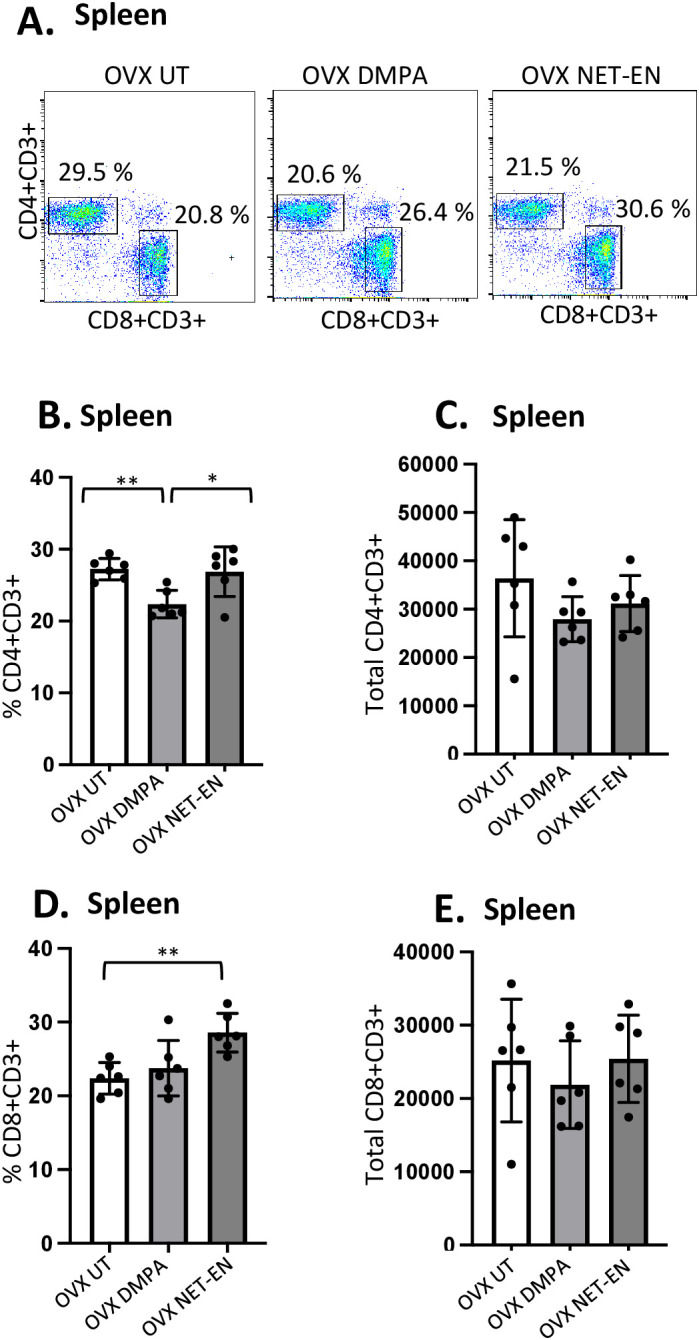
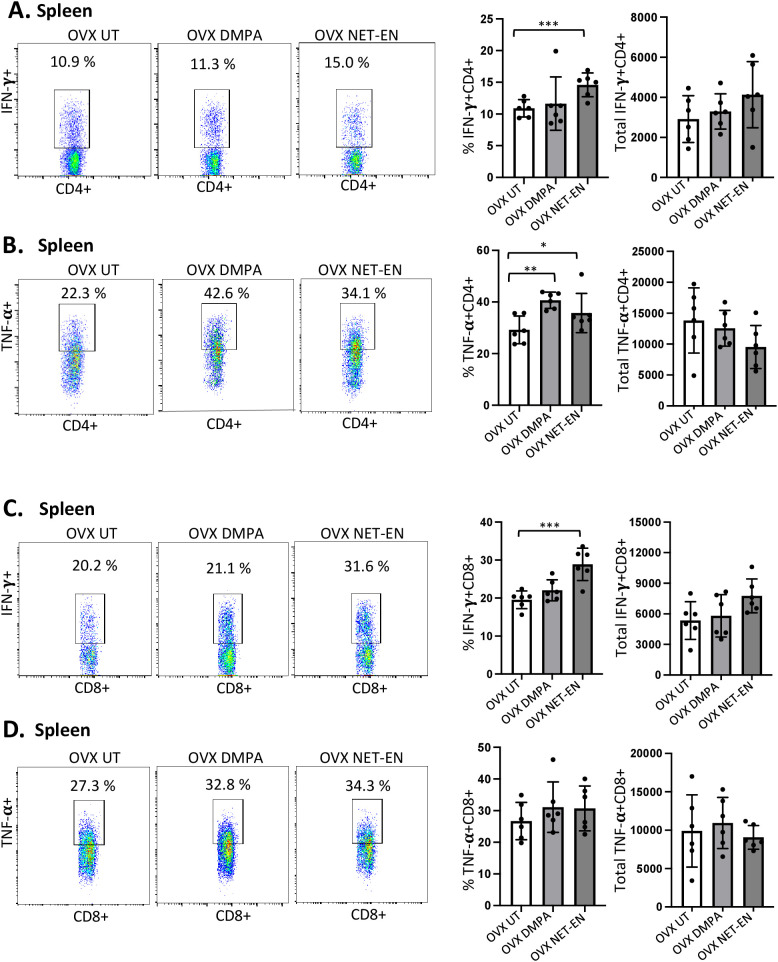
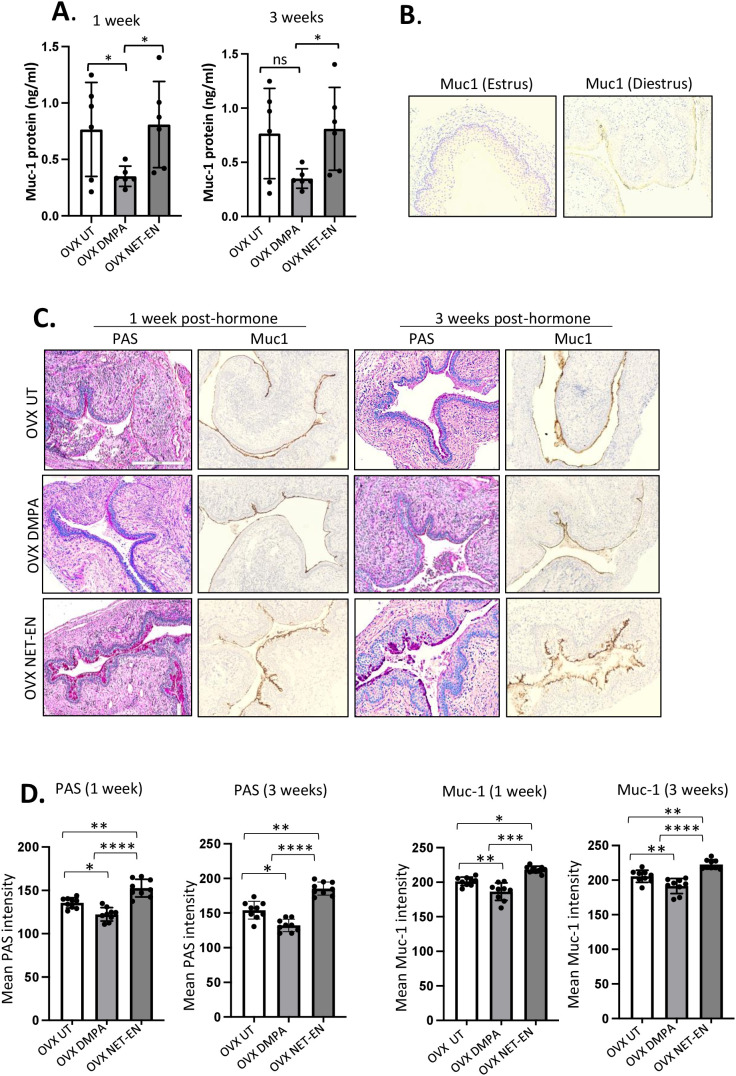
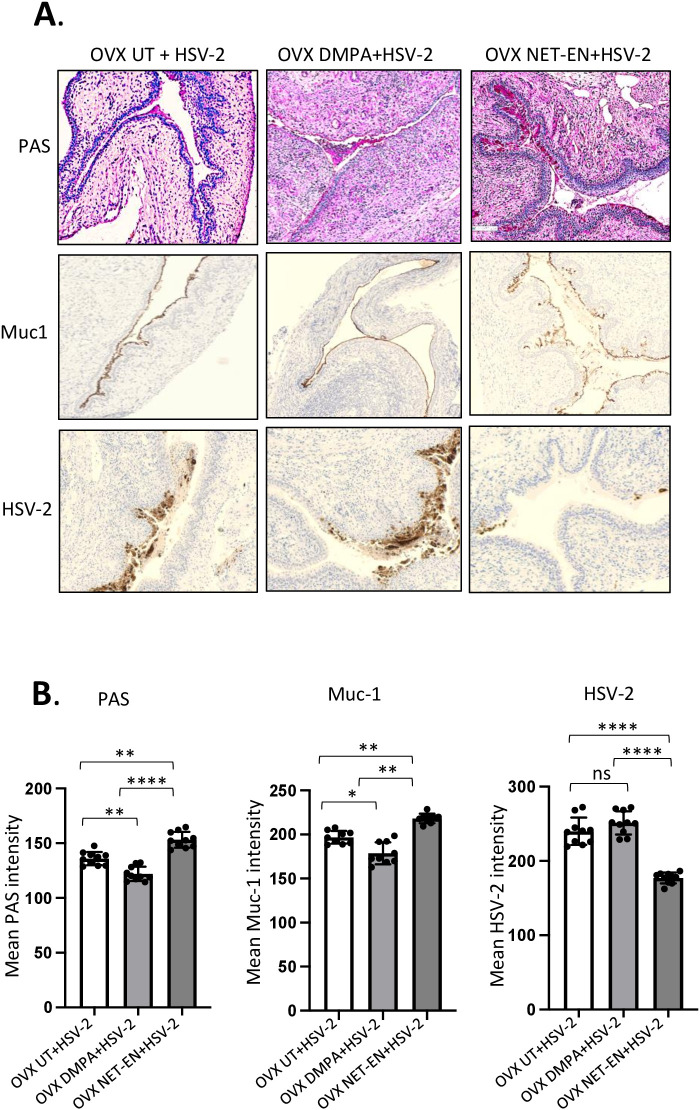
Depot-medroxyprogesterone acetate (DMPA) and Norethisterone Enanthate (NET-EN) are progestin-only injectable contraceptives widely used by women in sub-Sharan Africa, where incidence of HIV-1 and HSV-2 infection remains high. Studies indicate that DMPA usage can increase the risk of HSV-2 infection, but limited data indicate no increased risk with use of NET-EN. We therefore investigated the effects of NET-EN and DMPA on susceptibility to vaginal HSV-2 infection in ovariectomized (OVX) mice and effects on immune responses, particularly in the vaginal tract (VT). OVX mice, when treated with NET-EN and infected intravaginally, had delayed genital pathology, decreased viral shedding, and extended survival compared to DMPA- or untreated OVX mice. CD4+ T cells isolated from VT showed no significant change in frequency with either contraceptive. However, DMPA significantly decreased the total number of VT CD4+ and CD8+ T cells and the number of IFN-γ producing CD4 and CD8 T cells and increased the percentage of CD4 and CD8 T cells producing TNF-α compared to untreated mice. In contrast, NET-EN significantly enhanced percentages of CD8+ T cells compared to DMPA treated mice, and frequencies of IFN-γ+ CD4 and CD8 T cells in the VT compared to untreated mice. Comparative analysis of splenic lymphocytes indicated that DMPA treatment resulted in reduction of CD4+ T cell frequency, but enhanced TNF-α+ CD4 T cells compared to untreated mice. NET-EN enhanced the frequency of CD8 T cells, as well as IFN-γ+ and TNF-α+ CD4, and IFN-γ+ CD8 T cells in the spleen compared to untreated mice. Importantly, we found DMPA treatment that significantly reduced mucin production, whereas NET-EN enhanced expression of cell-associated mucin in VT. High levels of mucin in NET-EN mice were associated with lower levels of HSV-2 virus detected in the vaginal tract. This study provides the first evidence that NET-EN treatment can delay HSV-2 infection compared to DMPA.

Keywords: DMPA; IFN-γ; NET-EN; TNF-α; herpes simplex virus type 2; mucin; vaginal tract.


Conflict of interest statement

The authors declare that the research was conducted in the absence of any commercial or financial relationships that could be construed as a potential conflict of interest.

Figures

Figure 1
Figure 1
Analysis of survival rates, pathology and HSV-2 virus titers in the vaginal tract following NET-EN, DMPA, or no treatment of WT naïve and OVX mice. C57BL/6 wild-type or OVX mice (n=5/group) were treated with NET-EN, DMPA or were untreated (UT) for 2 weeks prior to intravaginal challenge with HSV-2 (5 x 10³ PFU/mouse). After challenge, vaginal washes were collected daily for up to 6 days to determine viral titers. Mice were also monitored for survival, and pathology scores recorded daily for up to 12 days. (A) Schematic depiction of experimental design. (B) Average pathology scores for OVX UT, OVX NET-EN and WT NET-EN treatment groups are depicted. (C) Survival of mice among the aforementioned treatment groups. (D) Data shown represent the average viral load per group (mean ± SEM) for each day. (E) Schematic demonstration of experimental design. (F) Average pathology scores for OVX UT, OVX DMPA and OVX NET-EN treatment groups are shown. (G) Survival of mice among OVX UT, OVX DMPA and OVX NET-EN treated groups. (H) Data shown represent the average viral load per group (mean ± SEM) for each day. Significance of difference in survival (C, G) was calculated using the log rank (Mantel-Cox) test (***, P < 0.001). Significance of differences in viral load (D, H) were analyzed using a one-way ANOVA with Tukey’s multiple-comparison test. *, P < 0.05, **, P<0.01.
Figure 2
Figure 2
Analysis of vaginal tract CD4 and CD8 T cell frequencies in NET-EN-treated, DMPA-treated and untreated OVX mice. OVX mice were treated with NET-EN (2.5 mg) or DMPA (2 mg) or left untreated (UT) for 3 weeks. Mice were then sacrificed, VT tissues were collected, and single cell suspensions were isolated. The cells were then stimulated with the T cell stimulation cocktail up to 16 h, followed by fluorescence antibody staining for extracellular markers including CD3, CD4 and CD8 prior to analysis by flow cytometry. A primary gating strategy ( Supplementary Figure S3 ) allowed analysis of viable, single CD3 positive lymphocytes. (A) Representative dot plots showing identified CD4+ and CD8+ T cells. (B) Bar graph shows the percentage of viable CD4+ T cells, mean ± SEM (n = 5). (C) Bar graphs displaying the total number of CD4+ T cells per vaginal tissue, mean ± SEM (n = 5). (D) Bar graphs showing the percentage of CD8+ T cells, mean ± SEM (n = 5) and (E) total number of CD8+ T cells, mean ± SEM (n = 5), for each vaginal tissue isolated from NET-EN, DMPA or untreated (UT) mice. Bars indicate mean ± SEM. All data were collected from 3 independent experiments. Data were analyzed utilizing the one-way ANOVA with Tukey’s multiple comparison test. *, P <0.05; **, P <0.01.
Figure 3
Figure 3
Analysis of vaginal tract CD4 and CD8 T cells for IFN-γ and TNF-α expression in NET-EN-treated, DMPA-treated and untreated OVX mice. OVX mice were treated with NET-EN (2.5 mg) or DMPA (2 mg) or left untreated (UT) for 3 weeks (n=5 per group). Mice were then euthanized, vaginal tracts tissues were collected, and single cell suspensions were isolated. The cells were then stimulated with the T cell stimulation cocktail up to 16 h, followed by fluorescence antibody staining for extracellular markers such as CD3, CD4 and CD8 and intracellular staining for cytokines IFN-γ and TNF-α prior to analysis by flow cytometry. A primary gating strategy ( Supplementary Figure S3 ) allowed analysis of viable, single CD3 positive lymphocytes, then gated for CD4+ and CD8+ cells. (A) Representative dot plots showing the gated CD4+ T cells and their IFN-γ fluorescence. Inset rectangle identifies IFN-γ+ CD4 T cells with % positive shown. Bar graphs on the right display the mean ± SEM (n = 5) for the percentage of IFN-γ+ CD4 T cells (left panel) and total number of CD4+ IFN-γ+ T cells (right panel). (B) Representative dot plots showing the gated CD4+ T cells and their TNF-α fluorescence. Inset rectangle identifies TNF-α+ CD4 T cells with % positive shown. Bar graphs display the mean ± SEM (n = 5) for the percentage of TNF-α+ CD4 T cells (left panel) and total number of TNF-α+ CD4 T cells (right panel). (C) Representative dot plots showing the gated CD8+ T cells expressing IFN-γ. Inset rectangle identifies CD8+IFN-γ+ cells with % positive shown. Bar graphs show the mean ± SEM (n = 5) for the percentage IFN-γ+ CD8 T cells (left panel) and total number of IFN-γ+ CD8 T cells (right panel). (D) Representative dot plots display the gated CD8+ T cells expressing TNF-α. Inset rectangle identifies TNF-α+ CD8 T cells with % positive shown. Bar graphs show the mean ± SEM (n = 5) for the percentage TNF-α+ CD8 T cells (left panel) and total number of TNF-α+ CD8 T cells (right panel). All data are drawn from 3 independent experiments. Data were analyzed utilizing the one-way ANOVA with Tukey’s multiple comparison test. *, P <0.05; ***, P <0.001.
Figure 4
Figure 4
Analysis of splenic CD4 and CD8 T cells populations in NET-EN-treated, DMPA-treated and untreated OVX mice. OVX mice were treated with NET-EN (2.5 mg), DMPA (2 mg) or left untreated (UT) for 3 weeks. Mice were then sacrificed, their spleens collected and single cell suspensions were isolated. Cells were then stimulated with the T cell stimulation cocktail up to 16 h, followed by fluorescence antibody staining for extracellular markers, such as CD3, CD4 and CD8 and analyzed by flow cytometry. A primary gating strategy ( Supplementary Figure S4 ) allowed analysis of viable, single CD3 positive lymphocytes. (A) Representative dot plots showing identified CD4+ and CD8+ T cells. (B) Bar graph shows the mean ± SEM (n = 5) for the percentage of viable CD4+ T cells, and (C) the number of viable CD4+T cells in spleen isolated from NET-EN, DMPA or untreated mice. (D) Bar graph showing the mean ± SEM (n = 5) for the percentage of CD8+ T cells, and (E) the total number of CD8+ T cells in the spleen. All data are drawn from 3 independent experiments. Data were analyzed utilizing the one-way ANOVA with Tukey’s multiple comparison test. *, P <0.05; **, P <0.01.
Figure 5
Figure 5
Analysis of splenic CD4 and CD8 T cells for IFN-γ and TNF-α expressions in NET-EN-treated, DMPA-treated and untreated OVX mice. OVX mice were treated with NET-EN (2.5 mg), DMPA (2 mg) or left untreated (UT) for 3 weeks. Mice were then euthanized, their spleens collected and single cell suspensions were isolated. Cells were then stimulated with the T cell stimulation cocktail up to 16 h, followed by fluorescence antibody staining of extracellular markers (CD3, CD4 and CD8) and then intracellular cytokine staining for IFN-γ and TNF-α before analyzed by flow cytometry. A primary gating strategy ( Supplementary Figure S4 ) allowed analysis of viable, single CD3 positive lymphocytes and further gated for CD4+ and CD8+ T cell subpopulations. (A) Representative dot plots showing the gated CD4+ T cells and their IFN-γ fluorescence. Inset rectangle identifies IFN-γ+ CD4 T cells with % positive shown. Bar graphs on the right display the mean ± SEM (n = 5) for the percentage of IFN-γ+ CD4 T cells (left panel) and total number of CD4+ IFN-γ+ T cells (right panel). (B) Representative dot plots showing the gated CD4+ T cells and their TNF-α fluorescence. Inset rectangle identifies TNF-α+ CD4 T cells with % positive shown. Bar graphs display the mean ± SEM (n = 5) for the percentage of TNF-α+ CD4 T cells (left panel) and total number of TNF-α+ CD4 T cells (right panel). (C) Representative dot plots showing the gated CD8+ T cells expressing IFN-γ. Inset rectangle identifies CD8+IFN-γ+ cells with % positive shown. Bar graphs show the mean ± SEM (n = 5) for the percentage IFN-γ+ CD8 T cells (left panel) and total number of IFN-γ+ CD8 T cells (right panel). (D) Representative dot plots display the gated CD8+ T cells expressing TNF-α. Inset rectangle identifies TNF-α+ CD8 T cells with % positive shown. Bar graphs show the mean ± SEM (n = 5) for the percentage TNF-α+ CD8 T cells (left panel) and total number of TNF-α+ CD8 T cells (right panel). All data are drawn from 3 independent experiments. Data were analyzed utilizing the one-way ANOVA with Tukey’s multiple comparison test. *, P <0.05; **, P <0.01; ***, P <0.001.
Figure 6
Figure 6
Analysis of mucin production in vaginal tract of OVX mice treated with NET-EN, DMPA or left untreated. OVX mice were treated with NET-EN or DMPA or left untreated (UT) and vaginal washes collected after 1 and 3 weeks of treatment. Some of the treated mice were euthanized and vaginal tissues collected and processed for histological staining with PAS and immunohistochemical staining for Muc1 to detect cell associated Mucin. (A) Vaginal washes taken at 1 and 3 weeks were assessed for secreted Muc1 protein levels by commercial mouse Muc1 ELISA kit. Bars indicate mean ± SEM for n = 6 samples. Statistical significance: *, P <0.05. (B) Vaginal tissues showing no Muc1 immunohistochemistry staining in vaginal sections taken from estrus stage serves as negative control and Muc1 staining was visible (dark brown) in diestrus used as a positive control. (C) Vaginal tissues showing different levels of cell associated mucins (multiple mucin types) as detected by intensity of PAS staining (dark pink) and Muc1 immunohistochemistry staining (dark brown) after 1 and 3 weeks of treatment. (D) PAS and Muc1 staining intensities for images of vaginal tissues for different treatments showed in panel (C) were quantified using Fiji ImageJ software as depicted in bar graphs. Bars indicate mean ± SEM for n=9 samples (3 images per mouse vaginal tissue, n=3 mice per treatment). All data are drawn from 2 independent experiments. Data were analyzed utilizing the one-way ANOVA with Tukey’s multiple comparison test. *, P <0.05; **, P <0.01; ***, P <0.001; ****, P<0.0001.
Figure 7
Figure 7
Immuno-histochemical analyses of mucin production and HSV-2 virus detection in the vaginal tract of OVX mice treated with NET-EN, DMPA or left untreated and subsequently infected with WT HSV-2. WT C57BL/6 OVX mice (n=5/group) were treated with NET-EN, DMPA or were left untreated (UT) for 2 weeks and then challenged intravaginally with WT HSV-2 333 (5 x 10³ PFU/mouse). Mice were monitored daily for pathology using the 0 to 5 scale (see Methods). Mice for all 3 groups were euthanized at day 5 post HSV-2 challenge when majority of the mice from DMPA and untreated groups reached stage 4/5 HSV-2 pathological score. Vaginal tissues were collected and processed for immuno-histological staining with Muc1 and HSV-2 antibodies. The experiments were repeated twice with similar results and representative slides for different treatment groups are displayed. (A) Vaginal tissues showing different levels of cell associated mucins (multiple mucin types) as detected by intensity of PAS staining (top images, dark pink stain) and Muc1 immunohistochemistry staining (middle images, dark brown stain), and HSV-2 immunohistochemistry staining (bottom images, dark brown stain). (B) PAS, Muc1 and HSV-2 immunohistochemistry staining intensities for images of vaginal tissues for different treatments exhibited in panel A were quantified by Fiji ImageJ software as shown in bar graphs. Bars indicate mean ± SEM for n=10 images (n=5 mice per treatment and 2 images per vaginal tissue). All data are drawn from 2 independent experiments. Data were analyzed utilizing the one-way ANOVA with Tukey’s multiple comparison test. *, P <0.05; **, P <0.01; ****, P <0.0001.

References

    1. Morrison CS, Chen PL, Kwok C, Baeten JM, Brown J, Crook AM, et al. . Hormonal contraception and the risk of hiv acquisition: an individual participant data meta-analysis. PloS Med. (2015) 12:e1001778. doi: 10.1371/journal.pmed.1001778 - DOI - PMC - PubMed
    1. Polis CB, Curtis KM, Hannaford PC, Phillips SJ, Chipato T, Kiarie JN, et al. . An updated systematic review of epidemiological evidence on hormonal contraceptive methods and hiv acquisition in women. Aids. (2016) 30:2665–83. doi: 10.1097/qad.0000000000001228 - DOI - PMC - PubMed
    1. Heffron R, Stalter R, Pyra M, Nanda K, Erikson DW, Hladik F, et al. . Hiv risk associated with serum medroxyprogesterone acetate levels among women in east and Southern Africa. Aids. (2019) 33:735–44. doi: 10.1097/qad.0000000000002123 - DOI - PMC - PubMed
    1. Quispe Calla NE, Vicetti Miguel RD, Torres AR, Trout W, Gabriel JM, Hatfield AM, et al. . Norethisterone enanthate increases mouse susceptibility to genital infection with herpes simplex virus type 2 and hiv type 1. Immunohorizons. (2020) 4:72–81. doi: 10.4049/immunohorizons.1900077 - DOI - PMC - PubMed
    1. Wessels JM, Lajoie J, Cooper M, Omollo K, Felker AM, Vitali D, et al. . Medroxyprogesterone acetate alters the vaginal microbiota and microenvironment in women and increases susceptibility to hiv-1 in humanized mice. Dis Model Mech. (2019) 12. doi: 10.1242/dmm.039669 - DOI - PMC - PubMed

Publication types

MeSH terms