Randomized Controlled Trial
. 2024 Nov 6:15:1415475.
doi: 10.3389/fimmu.2024.1415475. eCollection 2024.

Gene expression of tight junctions in foreskin is not affected by HIV pre-exposure prophylaxis

Affiliations
Randomized Controlled Trial

Gene expression of tight junctions in foreskin is not affected by HIV pre-exposure prophylaxis

Emily L Webb et al. Front Immunol. .

Abstract

Introduction: Tight junctions (TJs) serve as permeability filters between the internal and external cellular environment. A large number of proteins have been identified to be localized at the TJs. Due to limitations in tissue collection, TJs in the male genital tract have been understudied.

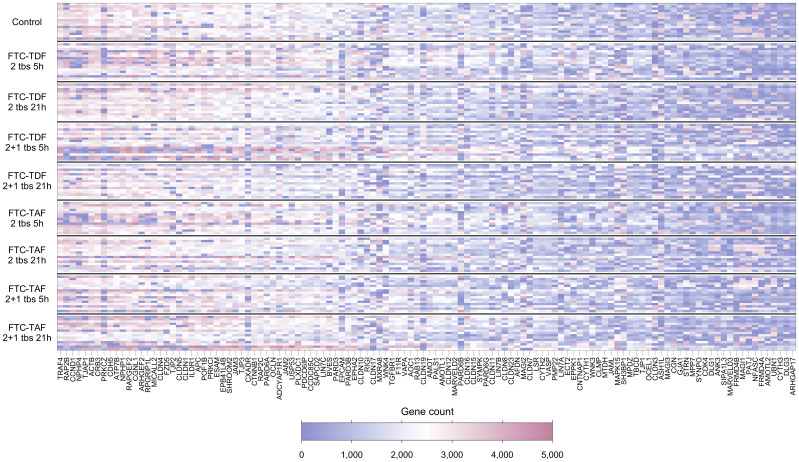
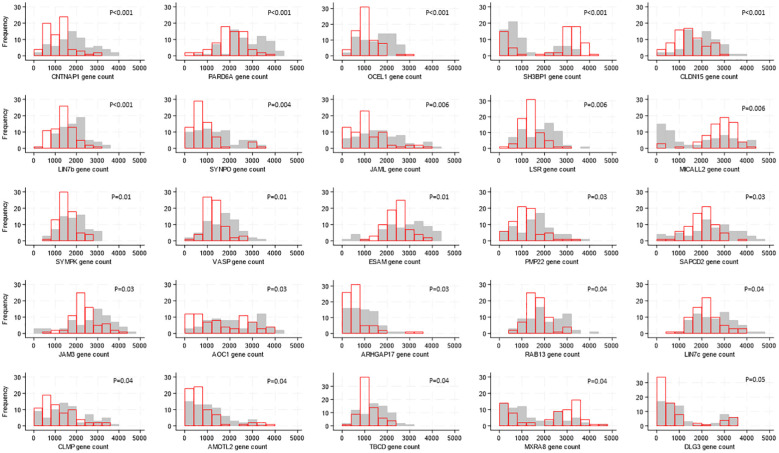
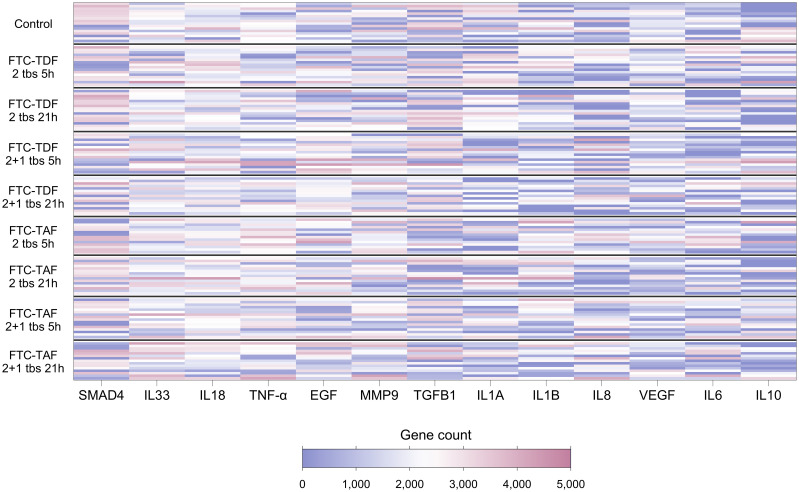
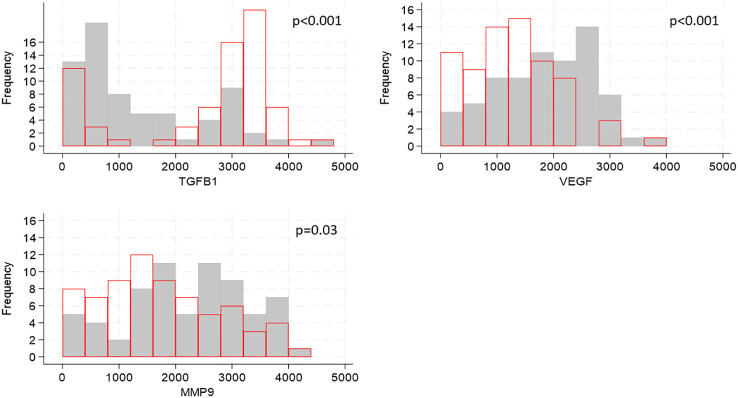
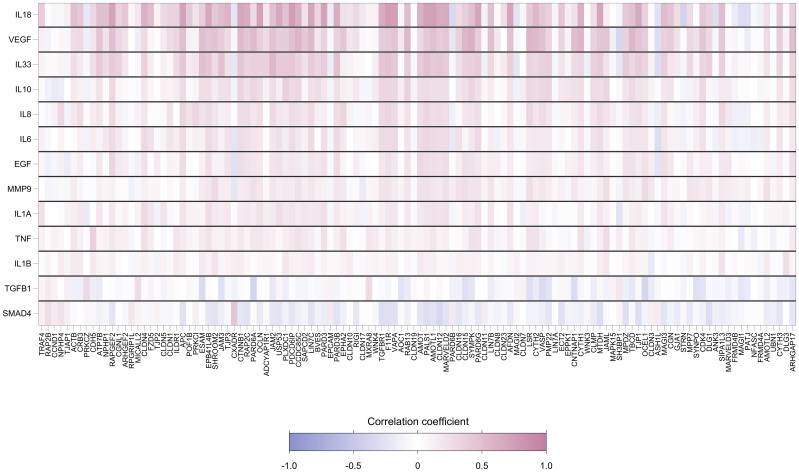
Methods: We analysed the transcriptomics of 132 TJ genes in foreskin tissue of men requesting voluntary medical male circumcision (VMMC) and enrolled in the Combined HIV Adolescent Prevention Study (CHAPS) trial conducted in South Africa and Uganda (NCT03986970). The trial evaluated the dose requirements for event-driven HIV pre-exposure prophylaxis (PrEP) with emtricitabine-tenofovir (FTC-TDF) or emtricitabine-tenofovir alafenamide (FTC-TAF) during insertive sex. A total of 144 participants were randomized to either control arm or one of 8 PrEP arms (n=16/arm), receiving oral FTC-TDF or FTC-TAF over one or two days. Following in vivo oral PrEP dosing and VMMC, the expression level of three important TJ proteins (CLDN-1, OCN and ZO-1) was measured ex vivo in foreskin tissue by Western blot. The expression of cytokine genes implicated in TJ regulation was determined. Non-parametric Kruskal-Wallis tests were used to compare TJ gene expression and protein levels by type of PrEP received, and Spearman's correlation coefficients were calculated to assess whether TJ gene expression levels were related to cytokine gene levels or to PrEP drug concentrations and their active intracellularly phosphorylated metabolites.

Results: A high level of expression in foreskin tissue was found for 118 (of 132) TJ genes analysed; this finding contributed to create a map of TJ components within the male genital tract. Importantly, PrEP regimens tested in the CHAPS trial did not affect the expression of TJ genes and the analysed proteins in the foreskin; thus, further supporting the safety of this prevention strategy against HIV-1 transmission during insertive sex. Additionally, we identified the level of several cytokines' genes to be correlated to TJ gene expression: among them, IL-18, IL-33 and VEGF.

Discussion: TJs can limit viral entry into target cells; to affect this biological function viruses can reduce the expression of TJ proteins. Our study, on the expression and regulation of TJs in the foreskin, contribute important knowledge for PrEP safety and further design of HIV-1 prophylaxis.

Keywords: cytokines; emtricitabine tenofovir; foreskin; pre-exposure prophylaxis PrEP; tight junctions; transcriptomes.


Conflict of interest statement

The authors declare that the research was conducted in the absence of any commercial or financial relationships that could be construed as a potential conflict of interest. The author(s) declared that they were an editorial board member of Frontiers, at the time of submission. This had no impact on the peer review process and the final decision.

Figures

Figure 1
Figure 1
Heatmap showing expression levels (gene counts) of 118 TJ genes for 139 individuals included in the CHAPS study. Each row represents one individual, and each column represents one gene. Individuals (rows) are grouped according to their CHAPS trial arm. Genes (columns) are ordered by median gene expression level (high to low). Darker red values indicate higher gene counts while darker blue values indicate low gene counts, as shown in the legend.
Figure 2
Figure 2
Distributions of tight junction gene expression levels by country, shown for the 25 genes whose expression levels differed by country. Gene counts are indicated by the values on the x-axis, categorized into groups of width 500, and the number of participants falling into each gene count group is shown on the y-axis. Grey bars show distribution of expression levels from South African participants, red bars show distribution of expression levels from Ugandan participants. P-values for differences in distribution of gene expression levels between countries were generated by Kruskal-Wallis tests and adjusted for multiple testing using the false discovery rate approach are indicated on each graph.
Figure 3
Figure 3
Heatmap showing expression levels of foreskin genes encoding cytokines, for 139 individuals included in the CHAPS study. Each row represents one individual, and each column represents one gene. Individuals (rows) are grouped according to their CHAPS trial arm. Genes encoding cytokines (columns) are ordered by median gene count (high to low). Darker red values indicate higher gene counts while darker blue values indicate lower gene counts, as shown in the legend.
Figure 4
Figure 4
Distributions of cytokine gene expression by country, shown for genes whose distributions differed by country. Cytokine gene counts are indicated by the values on the x-axis, categorized into groups of width 400, and the number of participants falling into each group is shown on the y-axis. Grey bars show distribution of cytokine gene expression from South African participants, red bars show distribution of cytokine concentrations from Ugandan participants. P-values for differences in distributions between the two countries were generated by Kruskal-Walis tests and adjusted for multiple testing using the false discovery rate approach are indicated on each graph.
Figure 5
Figure 5
Heatmap showing pairwise correlation coefficients between expression levels of 118 foreskin tight junctions and 13 cytokine genes. Each row represents a gene encoding cytokine, and each column represents a TJ gene. Spearman’s correlation coefficient was calculated for each row-column pair. Darker red values indicate higher positive correlation while darker blue values indicate higher negative correlation, as shown in the legend.

References

    1. Campbell HK, Maiers JL, DeMali KA. Interplay between tight junctions & adherens junctions. Exp Cell Res. (2017) 358:39–44. doi: 10.1016/j.yexcr.2017.03.061 - DOI - PMC - PubMed
    1. Zihni C, Mills C, Matter K, Balda MS. Tight junctions: from simple barriers to multifunctional molecular gates. Nat Rev Mol Cell Biol. (2016) 17:564–80. doi: 10.1038/nrm.2016.80 - DOI - PubMed
    1. Rajasekaran AK, Hojo M, Huima T, Rodriguez-Boulan E. Catenins and zonula occludens-1 form a complex during early stages in the assembly of tight junctions. J Cell Biol. (1996) 132:451–63. doi: 10.1083/jcb.132.3.451 - DOI - PMC - PubMed
    1. Maiers JL, Peng X, Fanning AS, DeMali KA. ZO-1 recruitment to α-catenin–a novel mechanism for coupling the assembly of tight junctions to adherens junctions. J Cell Sci. (2013) 126:3904–15. doi: 10.1242/jcs.126565 - DOI - PMC - PubMed
    1. Anderson JM, Van Itallie CM. Physiology and function of the tight junction. Cold Spring Harb Perspect Biol. (2009) 1:a002584. doi: 10.1101/cshperspect.a002584 - DOI - PMC - PubMed

Publication types

LinkOut - more resources