. 2024 Oct 24;27(11):111250.
doi: 10.1016/j.isci.2024.111250. eCollection 2024 Nov 15.

Sample multiplexing for retinal single-cell RNA sequencing

Affiliations

Sample multiplexing for retinal single-cell RNA sequencing

Justin Ma et al. iScience. .

Abstract

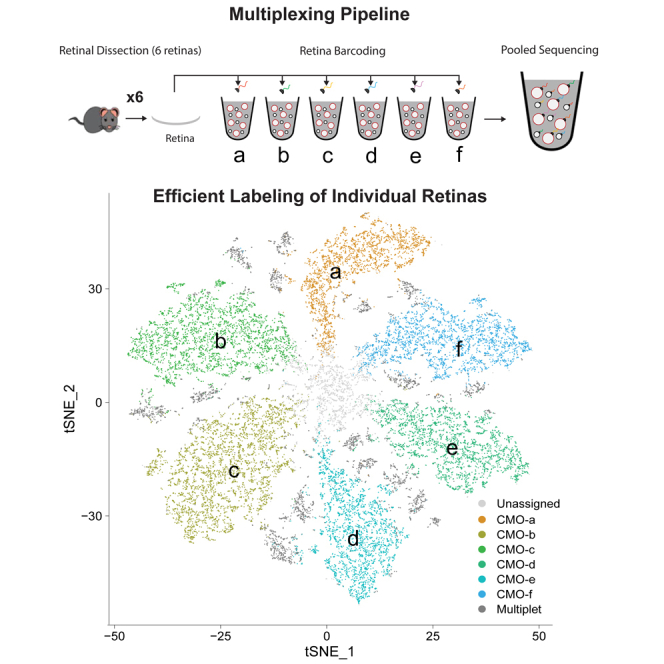
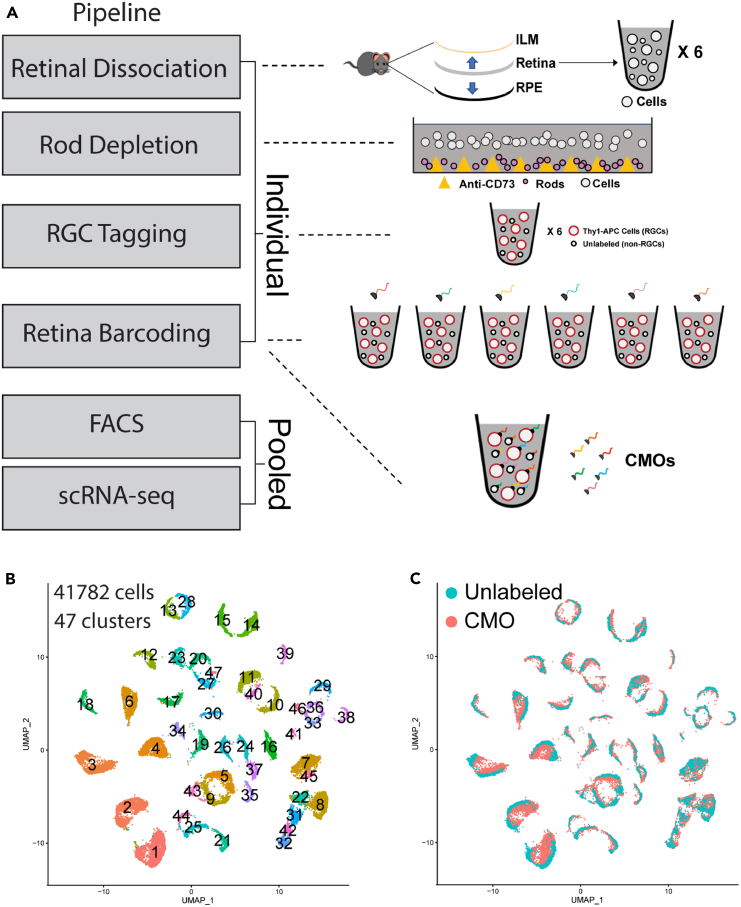
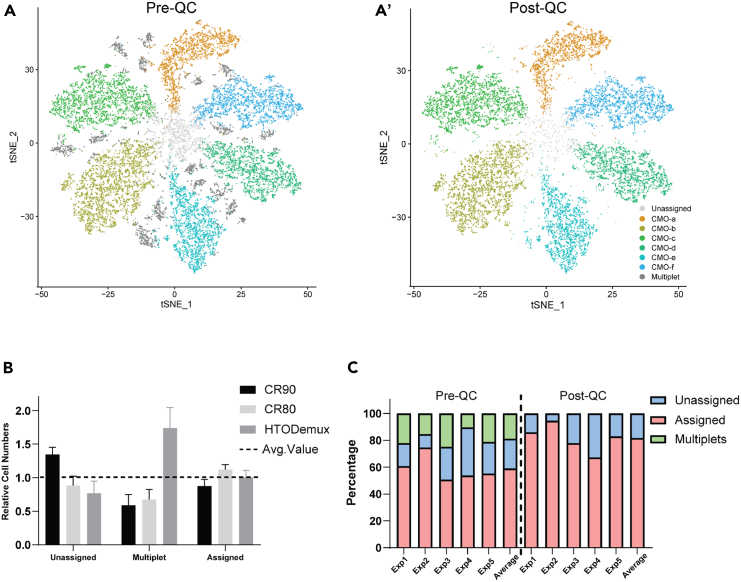
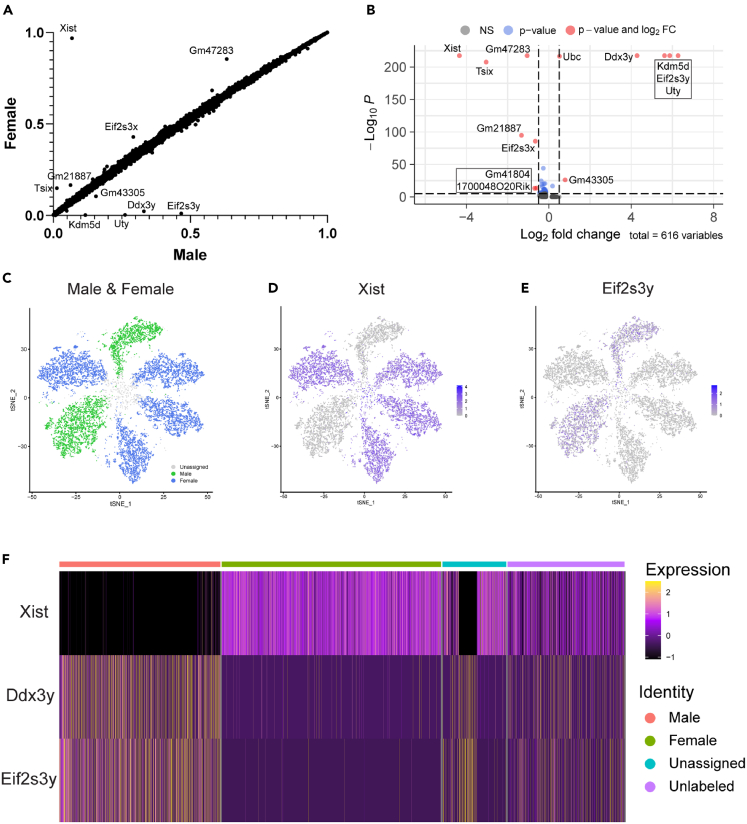
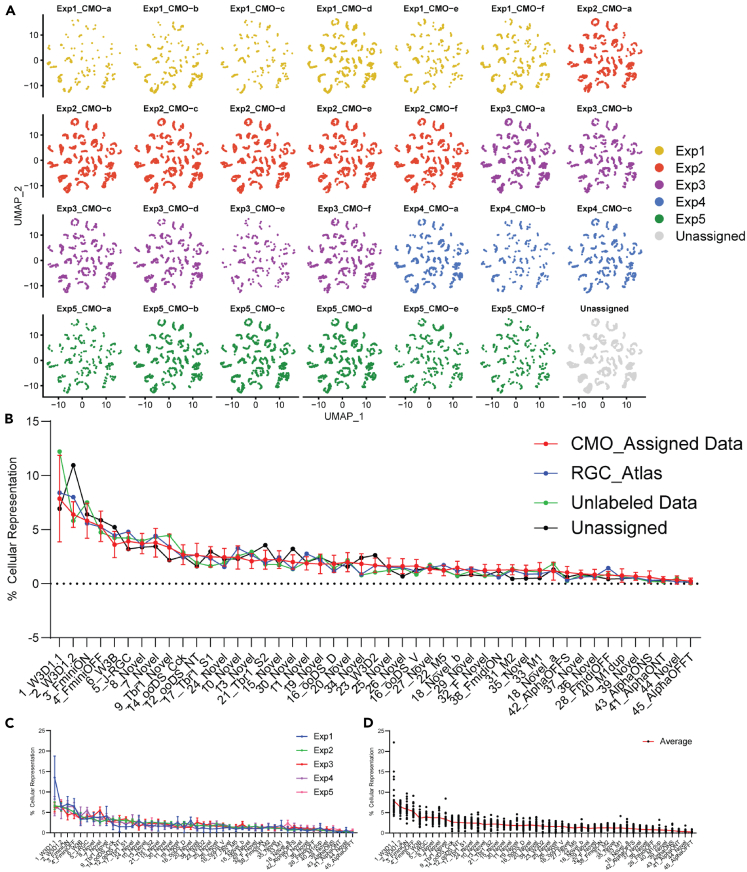
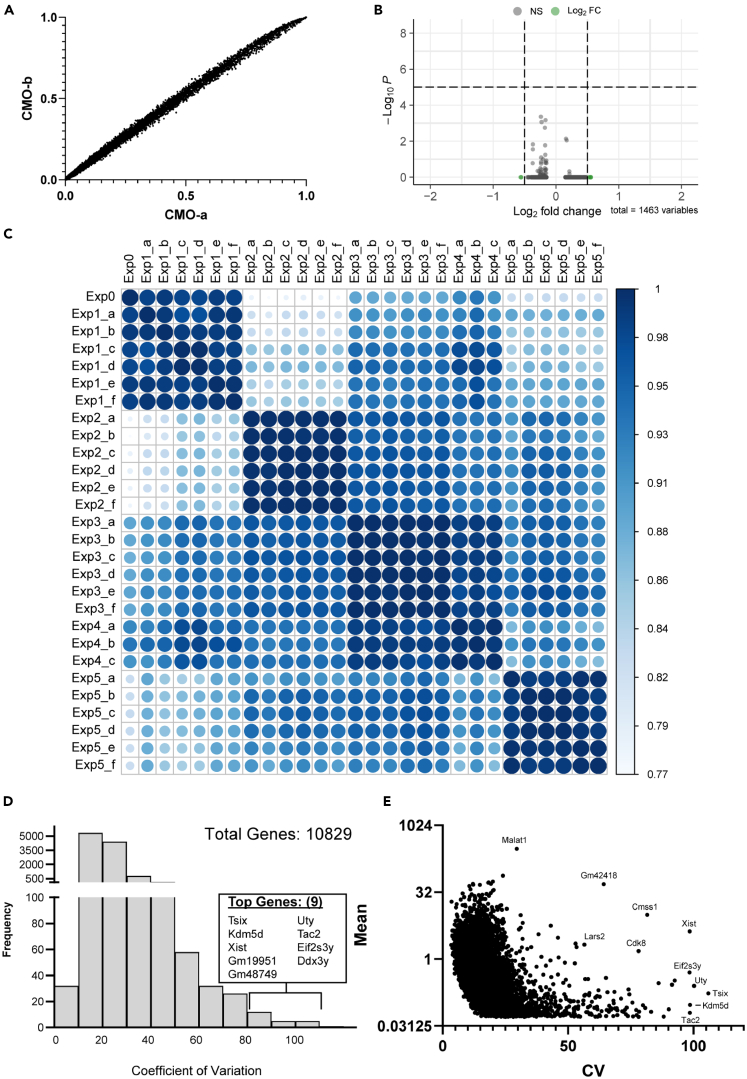
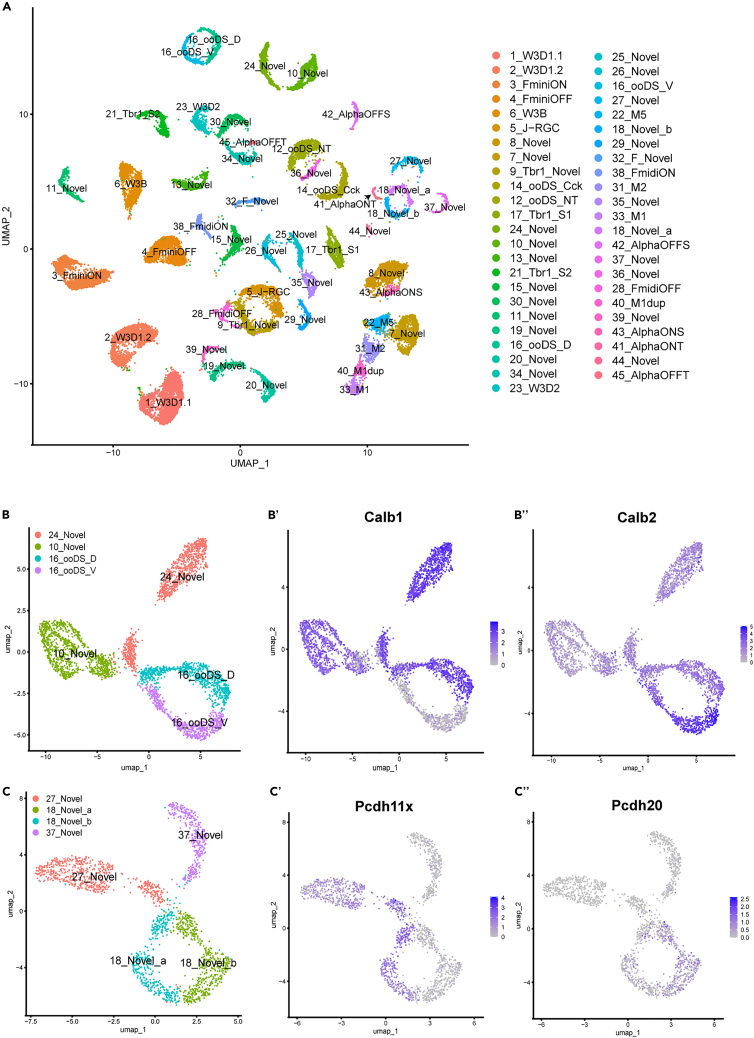
Rare cell populations can be challenging to characterize using microfluidic single-cell RNA sequencing (scRNA-seq) platforms. Typically, the population of interest must be enriched and pooled from multiple biological specimens for efficient collection. However, these practices preclude the resolution of sample origin together with phenotypic data and are problematic in experiments in which biological or technical variation is expected to be high (e.g., disease models, genetic perturbation screens, or human samples). One solution is sample multiplexing whereby each sample is tagged with a unique sequence barcode that is resolved bioinformatically. We have established a scRNA-seq sample multiplexing pipeline for mouse retinal ganglion cells using cholesterol-modified oligos. We utilized the enhanced precision of this dataset to investigate cell type distribution and transcriptomic variance across retinal samples. Additionally, we demonstrate that our multiplexed dataset can be useful for the identification of multiplets in non-labeled samples, a common challenge in scRNA-seq analysis.

Keywords: Molecular biology; Neuroscience; Omics; Transcriptomics.


Conflict of interest statement

The authors declare no competing interests.

Figures

None
Graphical abstract
Figure 1
Figure 1
CMO labeling enables tracking of retinal sample origin in scRNA-seq (A) Retinas from Vglut2-Cre;Ai9 mice were enzymatically dissociated and processed in parallel. Rods were depleted by CD73 negative-immunopanning, and RGCs were labeled with an anti-CD90.2/Thy1.2 antibody conjugated to APC. Each retina was labeled with a unique CMO barcode and then pooled for RGC enrichment by FACS (TdTomato+; C90.2/Thy1.2+). Collected cells were processed for scRNA-seq. (B) UMAP showing clustering of processed scRNA-seq dataset (6 collections) yielded 41,782 high-quality RGC transcriptomes grouped into 47 clusters. This included five CMO-labeled experiments (27 retinas) and one “Unlabeled” experiment (8,706 cells), which was not labeled with CMOs. (C) All clusters contained both CMO-labeled and “Unlabeled” cells, demonstrating transcriptional similarity. ILM, inner limiting membrane; RPE, retinal pigment epithelium (see also Figures S1, S2 and Table S1).
Figure 2
Figure 2
Demultiplexed retinas retain a high percentage of high-quality cells (A) t-distributed stochastic neighbor embedding (tSNE) showing clustering of cells from experiment 2 (6 retinas) based on CMO-barcode reads. (A′) Multiplets and most “Unassigned” cells were removed by quality control (QC) filters. Resulting clusters largely represent cells labeled with one CMO-barcode, which are predicted to be derived from the same retinal sample. (B) Comparison of the HTODemux assignment method to the Cell Ranger (CR) multiplex pipeline (CR90 and CR80 represent 90% and 80% confidence interval limits used, respectively). Assignment percentages were calculated for each experiment (n = 5) and normalized to the average value for each of the 3 categories. Data are represented as normalized mean +/− standard deviation (SD). (C) Comparison of assignment percentages pre- and post-QC filtering. For each side, columns 1–5 depict the percentage of cells represented by one of the three assignments for each experiment. On average, 81.6% ± 9.1% of the cells that passed QC and multiplet filters were assigned. All experiments are the average of their 6 retinas, with the exception of Exp4, which has 3 retinas (see also Figure S3 and Table S2).
Figure 3
Figure 3
Sample barcoding reveals differential expression of sex-related genes (A) All detected genes comparing cells from male and female samples plotted by percentage of cells with detected transcripts, excluding retinas from Exp3, which were male only. (B) Volcano plot of top DEGs determined by the “bimod” test (FC, fold change; NS, not significant). Thirteen genes (red) had a >0.5 FC difference and a p value < 1e−05 between male and female cells, all of which were located on sex chromosomes. (C) tSNE CMO feature plot labeled by sex of originating sample. (D and E) X-linked (Xist) and Y-linked (Eif2s3y) genes display predicted expression patterns based on sample assignment. (F) Heatmap of all experiments depicting scaled expression of three sex-linked genes segregated by assigned “Male” (red) or “Female” (green) identity. “Unlabeled Exp0” (purple), which pooled cells from four male and four female mice, was included for comparison (see also Table S3).
Figure 4
Figure 4
RGC type distribution is consistent across CMO-labeled retinas (A) UMAPs showing distribution of RGCs from individual retinas across transcriptomic clusters (Exp0 not included). RGCs collected across CMO-labeled samples were evenly distributed across clusters. “Unassigned,” cells not assigned to an individual retina by CMO labeling, were similarly distributed across clusters. (B) Line plot depicting RGC type percent representation between the “RGC_Atlas” (Tran et al. 201912), “Unlabeled Data” (Exp0), “CMO_Assigned Data” (n = 27), and the Unassigned data. Data are represented as mean +/− SD. (C) Line plot of “CMO_Assigned Data” segregated by each experiment. Data are represented as mean +/− SD. (D) Line plot of “CMO_Assigned Data” showing distribution of each individual retina per RGC type. Red line indicates average value. This graph indicates RGC type distribution was consistent across samples and labeling method and with previously published datasets. (see also Table S5).
Figure 5
Figure 5
Gene expression patterns are highly correlated between CMO-labeled retinas (A and B) A representative comparison showing the low transcriptional variance between cells assigned to different CMOs within each collection. No significantly different genes were identified by the “bimod” test comparing cells assigned to CMO-a and CMO-b from Exp2. (C) Correlation analysis (Pearson) comparing the average gene expression of the top 5,000 variable genes between all retinas. Correlations ranged from 0.77–1.00 across all samples and 0.97–1.00 comparing samples from the same experiment, indicating high transcriptional similarity among cells derived from different retinas within and between experiments. (D) Histogram showing distribution of the coefficient of variation (CV, standard deviation divided by the mean) across all detected genes (scaled mean > 0.05). The 9 most variable genes (>80 CV) are listed. (E) Scatterplot comparing CV to mean expression level for all detected genes (see also Figure S7 and Table S6).
Figure 6
Figure 6
Refinement of the RGC atlas annotation (A) UMAP of the transcriptomic data with RGC type annotations. (B) Feature plots depicting enrichment of Calb1 and Calb2 expression in ooDS_V and ooDS_D, respectively. (C) Feature plots depicting enrichment of Pcdh11x and Pcdh20 expression in 18_Novel_a and 18_Novel_b, respectively. (See also Figure S8).

Update of

References

    1. Haque A., Engel J., Teichmann S.A., Lönnberg T. A practical guide to single-cell RNA-sequencing for biomedical research and clinical applications. Genome Med. 2017;9:1–12. doi: 10.1186/s13073-017-0467-4. - DOI - PMC - PubMed
    1. Hwang B., Lee J.H., Bang D. Single-cell RNA sequencing technologies and bioinformatics pipelines. Exp. Mol. Med. 2018;50:1–14. doi: 10.1038/s12276-018-0071-8. - DOI - PMC - PubMed
    1. Jovic D., Liang X., Zeng H., Lin L., Xu F., Luo Y. Single-cell RNA sequencing technologies and applications: A brief overview. Clin. Transl. Med. 2022;12:e694. doi: 10.1002/ctm2.694. - DOI - PMC - PubMed
    1. Macosko E.Z., Basu A., Satija R., Nemesh J., Shekhar K., Goldman M., Tirosh I., Bialas A.R., Kamitaki N., Martersteck E.M., et al. Highly Parallel Genome-wide Expression Profiling of Individual Cells Using Nanoliter Droplets. Cell. 2015;161:1202–1214. doi: 10.1016/j.cell.2015.05.002. - DOI - PMC - PubMed
    1. Klein A.M., Mazutis L., Akartuna I., Tallapragada N., Veres A., Li V., Peshkin L., Weitz D.A., Kirschner M.W. Droplet barcoding for single-cell transcriptomics applied to embryonic stem cells. Cell. 2015;161:1187–1201. doi: 10.1016/j.cell.2015.04.044. - DOI - PMC - PubMed