. 2024 Oct 22;27(11):111226.
doi: 10.1016/j.isci.2024.111226. eCollection 2024 Nov 15.

Inhibiting AMPA receptor signaling in oligodendrocytes rescues synapse loss in a model of autoimmune demyelination

Affiliations

Inhibiting AMPA receptor signaling in oligodendrocytes rescues synapse loss in a model of autoimmune demyelination

Gabrielle M Mey et al. iScience. .

Abstract

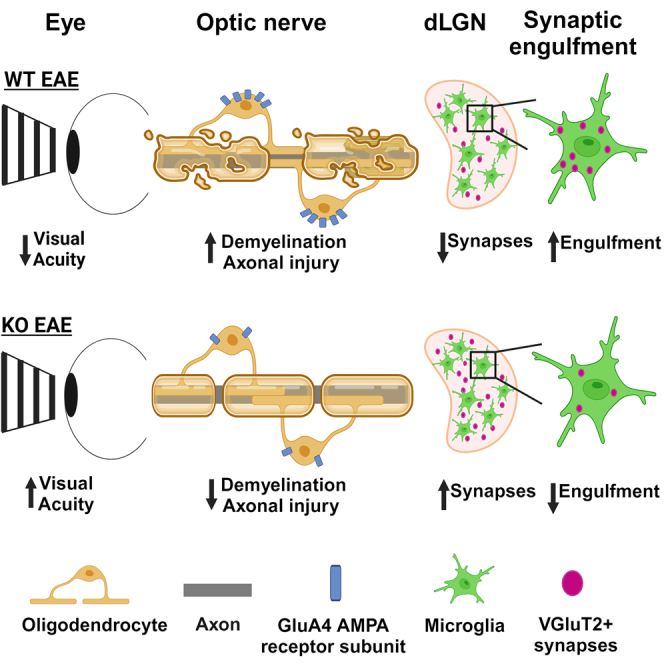
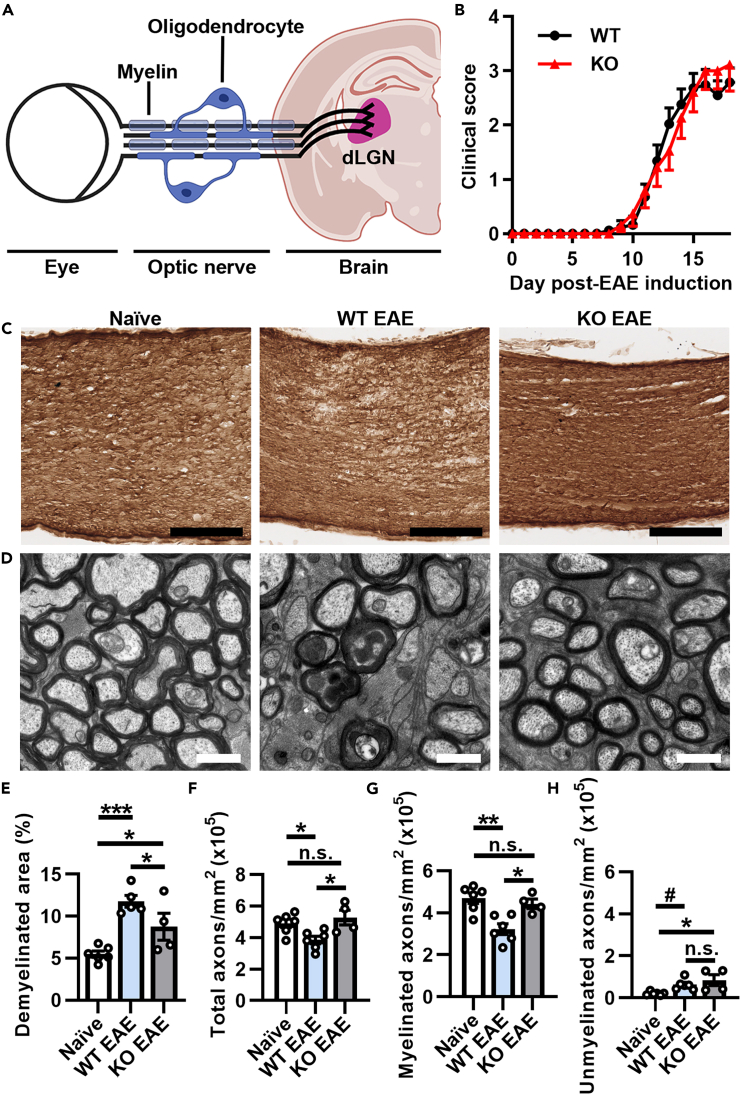
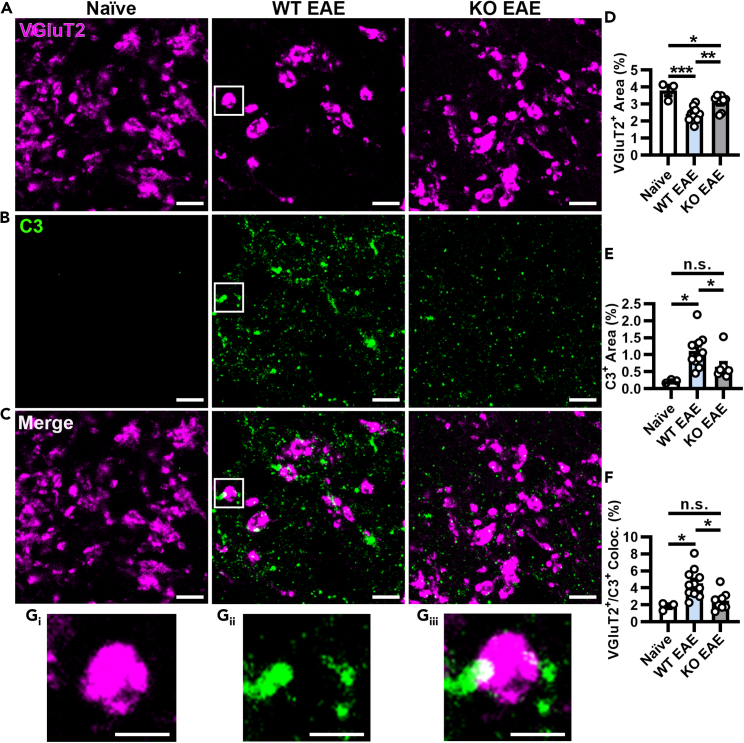
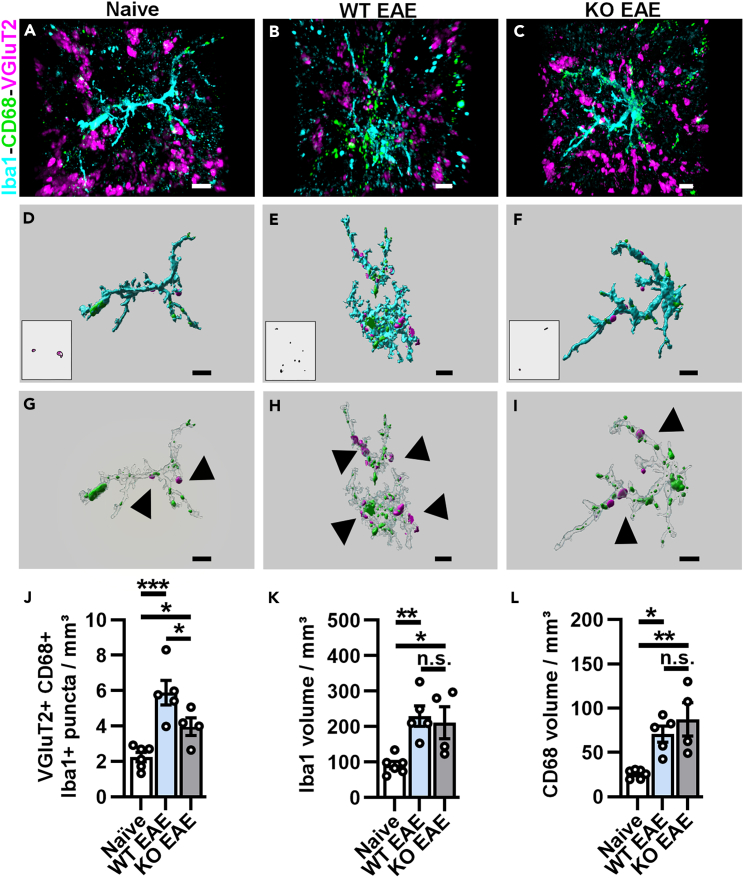
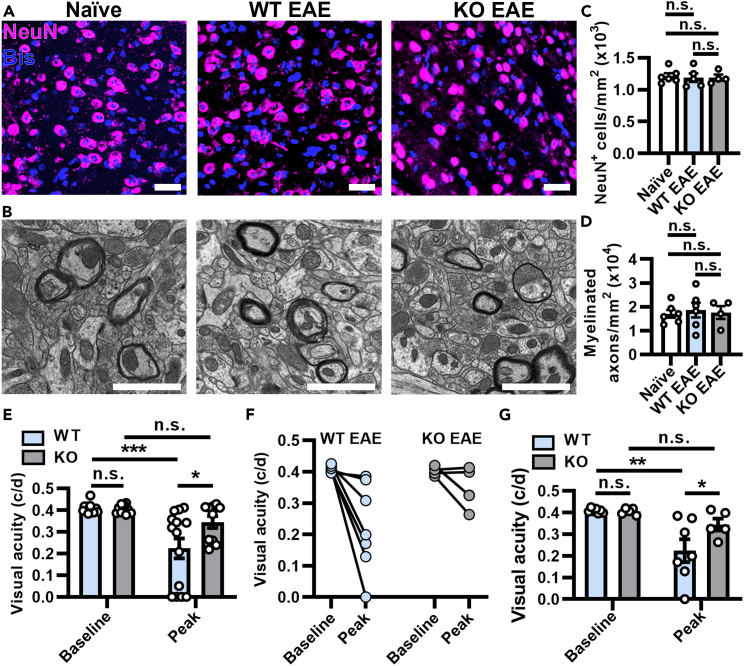
Multiple sclerosis (MS) is initially characterized by myelin and axonal damage in central nervous system white matter lesions, but their causal role in synapse loss remains undefined. Gray matter atrophy is also present early in MS, making it unclear if synaptic alterations are driven by white matter demyelinating lesions or primary gray matter damage. Furthermore, whether axonal pathology occurs secondary to or independent of demyelination to drive synaptic changes is not clear. Here, we address whether reducing demyelination by selectively manipulating glutamatergic signaling in mature oligodendrocytes (OLs) preserves synapses in experimental autoimmune encephalomyelitis (EAE), a preclinical model of demyelinating disease. We demonstrate that inducible reduction of the GluA4 AMPA-type glutamate receptor subunit selectively in mature (OLs) reduces demyelination and axonal injury, preserves synapses, and improves visual function during EAE. These data link demyelination to the pathophysiology of synaptic loss with therapeutic implications for both motor and cognitive disability in MS.

Keywords: Cell biology; Immunology; Neuroscience.


Conflict of interest statement

T.M.D. serves on the board of directors for Coeptis Therapeutics.

Figures

None
Graphical abstract
Figure 1
Figure 1
Inducible reduction of AMPAR signaling in mature OLs attenuates demyelination and loss of myelinated axons in optic nerves during EAE peak of disease (A) Diagram of the retino-geniculate pathway. (B) EAE clinical scores from PLPcreER−:GluA4fl/fl (WT; black line) and PLPcreER+:GluA4fl/fl (KO; red line) mice. Two-tailed Mann-Whitney test, p = 0.9933, n = 25 WT and n = 19 KO mice from 4 independent experiments. All EAE mice were assessed at peak of disease, approximately 16–18 days post-EAE induction (dpi). (C and D) Representative optic nerve images of (C) immunohistochemical staining of myelin basic protein (MBP), scale bars, 100 μm and (D) electron micrograph (EM) images, scale bars, 1 μm. (E) Quantification of demyelinated area using MBP staining from naive (n = 6), WT EAE (n = 5), or KO EAE (n = 4) mice, 4 sections per mouse. Naive vs. WT EAE, ∗∗∗p = 0.0005; naive vs. KO EAE, ∗p = 0.0439; WT EAE vs. KO EAE, ∗p = 0.0439. (F and G) Quantification of (F) total axons (naive compared to WT EAE, ∗p = 0.0455; naive compared to KO EAE, p = 0.4327; WT EAE compared to KO EAE, ∗p = 0.0245), (G) myelinated axons (naive vs. WT EAE, ∗∗p = 0.0023; naive vs. KO EAE, p = 0.5004; WT EAE vs. KO EAE, ∗p = 0.0135, and (H) unmyelinated axons (naive vs. WT EAE, #p = 0.0591; naive vs. KO EAE, ∗p = 0.0174; WT EAE vs. KO EAE, p = 0.2850) in TEM images from n = 6 naive, 6 WT EAE, and 4 KO EAE mice, 6 images per mouse. Data expressed as mean ± SEM. Statistical differences determined using one-way ANOVA with Šidák multiple comparison tests, n.s. = not significant.
Figure 2
Figure 2
No change in RGC number or reactive gliosis in the retina at EAE peak of disease (A) Diagram of a retinal flatmount. 12 total images were taken per flatmount from the 1/6, 3/6, and 5/6 regions in each of 4 leaflets from n = 6 naive, 5 WT EAE and 4 KO EAE mice. (B) Confocal images of Brn3a+ and bisbenzimide+ (Bis) retinal ganglion cells (RGCs) in naive, PLPcreER−:GluA4fl/fl (WT) EAE, and PLPcreER+:GluA4fl/fl (KO) EAE mice. Scale bars, 10 μm. Quantification of (C) total Brn3a+ RGCs cells (naive vs. WT EAE, p = 0.2291; naive vs. KO EAE, p = 0.2934; WT EAE vs. KO EAE, p = 0.7970) and (D–F) in the 1/6, 3/6, or 5/6 region of the retinal flatmount. (D) Naive vs. WT EAE, p = 0.4556; naive vs. KO EAE, p = 0.1795; WT EAE vs. KO EAE, p = 0.4556. (E) Naive vs. WT EAE, p = 0.5790; naive vs. KO EAE, p = 0.8177; WT EAE vs. KO EAE, p = 0.5790. (F) Naive vs. WT EAE, p = 0.7922; naive vs. KO EAE, p = 0.8853; WT EAE vs. KO EAE, p = 0.7922. (G–I) (G) Representative images of Iba1+ microglia/macrophages and Bis+ nuclei in the retina. Scale bars, 20 μm. Quantification of Iba1+ percent area (H) in the total retina (naive vs. WT EAE, p = 0.7333; naive vs. KO EAE, p = 0.4729; WT EAE vs. KO EAE, p = 0.7333) and (I) in the RNFL/GCL (naive vs. WT EAE, p = 0.8580; naive vs. KO EAE, p = 0.8303; WT EAE vs. KO EAE, p = 0.8580). (J–L) (J) Representative images of GFAP+ astrocytes and Bis+ nuclei in the retina. Scale bars, 20 μm. Quantification of GFAP+ percent area (K) in the total retina (naive vs. WT EAE, p = 0.9716; naive vs. KO EAE, p = 0.7847; WT EAE vs. KO EAE, p = 0.7847) and (L) in the RNFL/GCL (naive vs. WT EAE, p = 0.9592; naive vs. KO EAE, p = 0.9592; WT EAE vs. KO EAE, p = 0.9796). Iba1 and GFAP were quantified in 7–8 images from 2 to 4 sections per mouse. Data expressed as mean ± SEM, n = 6 naive, 5 WT EAE and 4 KO EAE mice. Statistical differences determined using one-way ANOVAs with Holm-Šidák multiple comparison tests, n.s. = not significant.
Figure 3
Figure 3
Preservation of retinogeniculate presynaptic terminals and reduced complement deposition in AMPAR-deficient mice at peak EAE (A–C) Representative images from compressed z stacks (3 planes spaced 0.7 μm apart) of VGluT2+ presynaptic terminals (A, magenta), complement factor C3 (B, green), and their colocalization (C, Merge) in naive, PLPcreER−:GluA4fl/fl (WT) EAE, and PLPcreER+:GluA4fl/fl (KO) mice at peak of disease. Scale bars, 10 μm. (D) Quantification of VGluT2+ percent area (naive vs. WT EAE, ∗∗∗p = 0.0003; naive vs. KO EAE, ∗p = 0.0303; WT EAE vs. KO EAE, ∗∗p = 0.0061). (E) Quantification of C3+ percent area (naive vs. WT EAE, ∗p = 0.0106; naive vs. KO EAE, p = 0.1512; WT EAE vs. KO EAE, ∗p = 0.0444). (F) Quantification of VGluT2+/C3+ percent colocalization (naive vs. WT EAE, ∗p = 0.0154; naive vs. KO EAE, p = 0.5025; WT EAE vs. KO EAE, ∗p = 0.0148). Insets from WT EAE (white boxes) show a region where VGluT2+ (Gi) and C3+ (Gii) puncta are colocalized (white, Giii). Scale bars, 5 μm. Data expressed as mean ± SEM, n = 3 naive, 11 WT EAE, and 8 KO EAE mice from two independent experiments, 5–6 randomly selected fields from 3 tissue sections per mouse. Statistical differences determined using one-way ANOVAs with Holm-Šidák multiple comparison tests, n.s. = not significant.
Figure 4
Figure 4
Inducible reduction of AMPAR signaling in mature OLs attenuates engulfment of VGluT2+ presynaptic inputs in the dLGN (A–C) Representative 3D confocal immunofluorescence images of Iba1+ microglia (cyan) containing CD68+ lysosomes (green) with engulfed VGluT2+ presynaptic protein (pink) in naive (A), PLPcreER−:GluA4fl/fl (WT) EAE (B), and PLPcreER+:GluA4fl/fl (KO) EAE (C) mice. (D and F) Insets are representative of the 3D-rendered image of VGluT2+ inputs within CD68+ lysosomes, which is within Iba1+ microglia (larger image) in naive (D), WT EAE (E), and KO EAE (F) mice. (G–I) Representative images of 3D surface rendering and masking to visualize VGluT2+ inputs engulfed by microglia (black arrows, G-I) of naive (G), WT EAE (H), and KO EAE (I) mice. Scale bars, 5 μm. (J) Quantification of mean engulfed volume of VGluT2+ presynaptic inputs within CD68+ lysosomes per microglia. Naive vs. WT EAE, ∗∗∗p = 0.0005; naive vs. KO EAE, ∗p = 0.0482; WT EAE vs. KO EAE, ∗p = 0.0482. (K) Quantification of Iba1+ volume. Naive vs. WT EAE, ∗∗p = 0.0080; naive vs. KO EAE, ∗p = 0.0198; WT EAE vs. KO EAE, p = 0.6505. (L) Quantification of CD68+ volume. Naive vs. WT EAE, ∗p = 0.0127; naive vs. KO EAE, ∗∗p = 0.0034; WT EAE vs. KO EAE, p = 0.2877. Engulfed VGluT2, Iba1, and CD68 volumes were quantified from 15 to 20 Iba1+ microglia in the dLGN from 2 sections per mouse, n = 6 naive, 5 WT EAE, and 4 KO EAE mice. Data expressed as mean ± SEM. Statistical differences determined using a one-way ANOVAs with Holm-Šidák multiple comparison tests, n.s. = not significant.
Figure 5
Figure 5
Reduction in AMPAR signaling on mature OLs does not change neuron or axon numbers in the dLGN, but improves visual acuity at EAE peak of disease (A) Confocal images of NeuN+ and bisbenzimide+ (Bis) cells in the dLGN from naive, PLPcreER−; GluA4fl/fl (WT) EAE, and PLPcreER+; GluA4fl/fl (KO) EAE mice. Scale bars, 20 μm. (B) EM images of coronal sections of the dLGN (bregma ˗1.455 mm to ˗2.355 mm) from naive, WT EAE and KO EAE mice. Scale bars, 1 μm. (C) Quantification of NeuN+ neurons in the dLGN. Naive vs. WT EAE, p = 0.9840; naive vs. KO EAE, p = 0.9840; WT EAE vs. KO EAE, p = 0.9873, from n = 6 naive, 5 WT EAE and 4 KO EAE mice, 2–4 images from 2 sections per mouse. (D) Quantification of myelinated axons in the dLGN. Naive vs. WT EAE, p = 0.9621; naive vs. KO EAE, p = 0.9621; WT EAE vs. KO EAE, p = 0.9621, from n = 6 naive, 6 WT EAE, and 4 KO EAE mice, 4 fields per mouse. Statistical differences in (C) and (D) determined by one-way ANOVAs with Holm-Šidák multiple comparison test. (E) Visual acuity (cycles per degree, c/d) quantified per eye at baseline and peak of disease (so each mouse was measured at its own peak EAE) in WT and KO EAE mice. Independent measures multiple comparisons: WT vs. KO baseline, p = 0.9386; WT vs. KO peak EAE, ∗p = 0.0135. Repeated measures multiple comparisons: WT baseline vs. WT peak EAE, ∗∗∗p = 0.0001; KO baseline vs. KO peak EAE, p = 0.1927. (F and G) (F) Visual acuity (cycles per degree, c/d) plotted as an average per animal across baseline and peak disease, quantified in (G), independent measures multiple comparisons: WT vs. KO baseline, p = 0.9485; WT vs. KO peak EAE, ∗p = 0.0403. Repeated measures multiple comparisons: WT baseline vs. WT peak EAE, ∗∗p = 0.0039; KO baseline vs. KO peak EAE, p = 0.2774. Data expressed as mean ± SEM. Statistical differences determined by two-way repeated measures ANOVAs with Holm-Šidák multiple comparisons test, n.s. = not significant, from n = 7 WT EAE and n = 5 KO EAE mice.

References

    1. Dutta R., Chang A., Doud M.K., Kidd G.J., Ribaudo M.V., Young E.A., Fox R.J., Staugaitis S.M., Trapp B.D. Demyelination causes synaptic alterations in hippocampi from multiple sclerosis patients. Ann. Neurol. 2011;69:445–454. doi: 10.1002/ana.22337. - DOI - PMC - PubMed
    1. Werneburg S., Jung J., Kunjamma R.B., Ha S.K., Luciano N.J., Willis C.M., Gao G., Biscola N.P., Havton L.A., Crocker S.J., et al. Targeted Complement Inhibition at Synapses Prevents Microglial Synaptic Engulfment and Synapse Loss in Demyelinating Disease. Immunity. 2020;52:167–182.e7. doi: 10.1016/j.immuni.2019.12.004. - DOI - PMC - PubMed
    1. Ziehn M.O., Avedisian A.A., Tiwari-Woodruff S., Voskuhl R.R. Hippocampal CA1 atrophy and synaptic loss during experimental autoimmune encephalomyelitis, EAE. Lab. Invest. 2010;90:774–786. doi: 10.1038/labinvest.2010.6. - DOI - PMC - PubMed
    1. Mey G.M., Evonuk K.S., Chappell M.K., Wolfe L.M., Singh R., Batoki J.C., Yu M., Peachey N.S., Anand-Apte B., Bermel R., et al. Visual imaging as a predictor of neurodegeneration in experimental autoimmune demyelination and multiple sclerosis. Acta Neuropathol. Commun. 2022;10:87. doi: 10.1186/s40478-022-01391-y. - DOI - PMC - PubMed
    1. Trapp B.D., Peterson J., Ransohoff R.M., Rudick R., Mörk S., Bö L. Axonal transection in the lesions of multiple sclerosis. N. Engl. J. Med. 1998;338:278–285. doi: 10.1056/NEJM199801293380502. - DOI - PubMed

LinkOut - more resources