

Long-term effects of tocilizumab on retinal and choroidal inflammation in Birdshot uveitis
- PMID: 39570440
- PMCID: PMC11582289
- DOI: 10.1186/s12348-024-00443-9
Long-term effects of tocilizumab on retinal and choroidal inflammation in Birdshot uveitis
Abstract
Background: Tocilizumab (TCZ), an interleukin-6 receptor antagonist, is approved for treating rheumatic diseases and has demonstrated efficacy in managing refractory non-infectious uveitis (NIU). This retrospective study aimed to investigate the long-term effects of TCZ on inflammation in the retinal and choroidal compartments in Birdshot NIU.
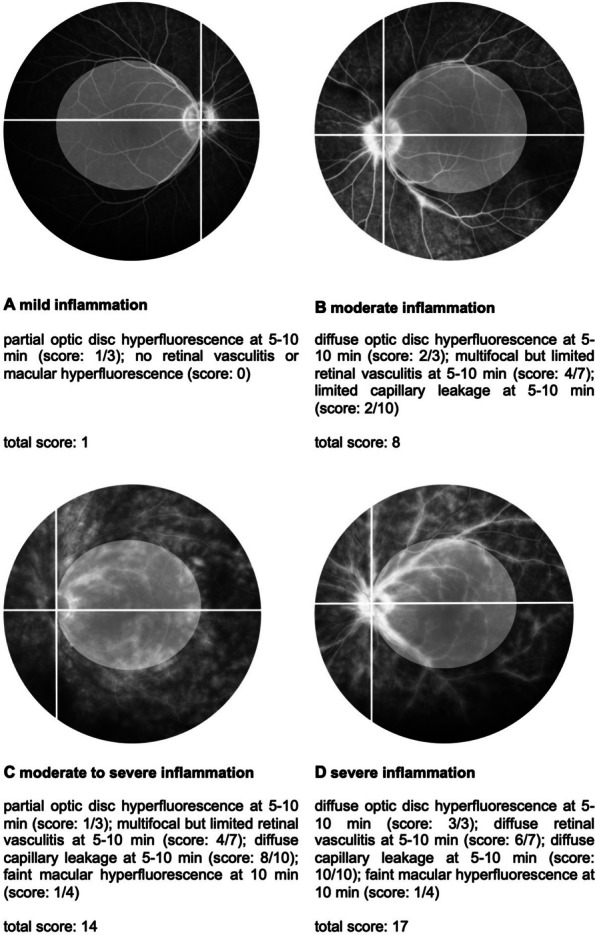
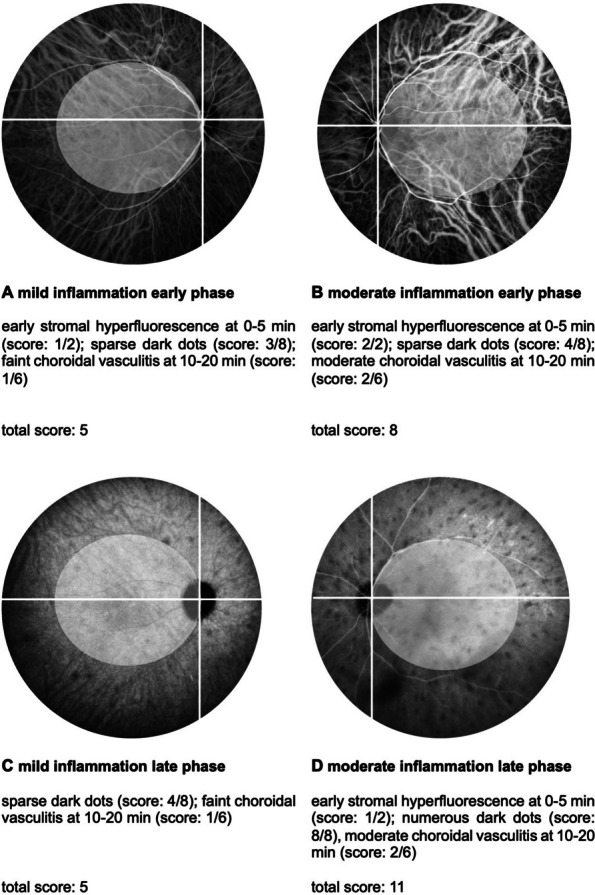
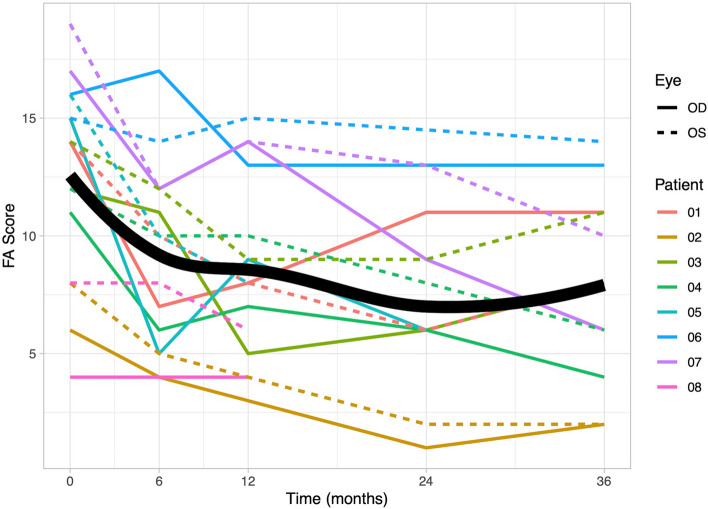
Methods: Eight patients (16 eyes) received TCZ and were included in the analysis. The primary outcomes measured were inflammatory activity in the retina and choroid, assessed by fluorescein angiography (FA) and indocyanine green angiography (ICGA) using the Angiography Scoring for Uveitis Working Group at baseline, 6, 12, 24, and 36 months.
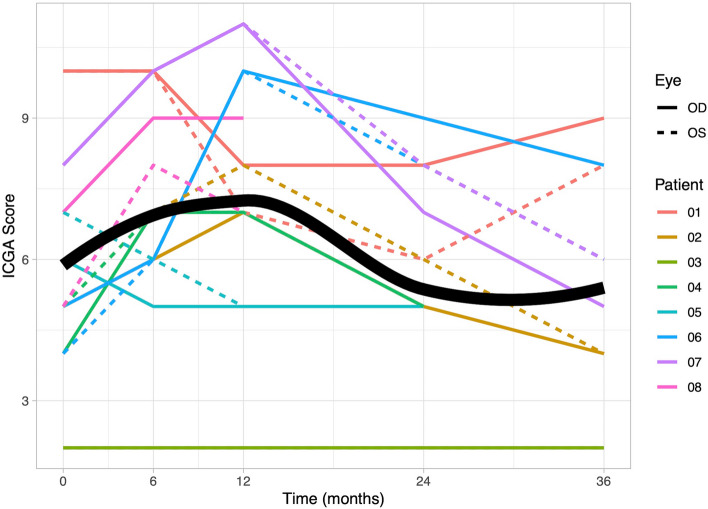
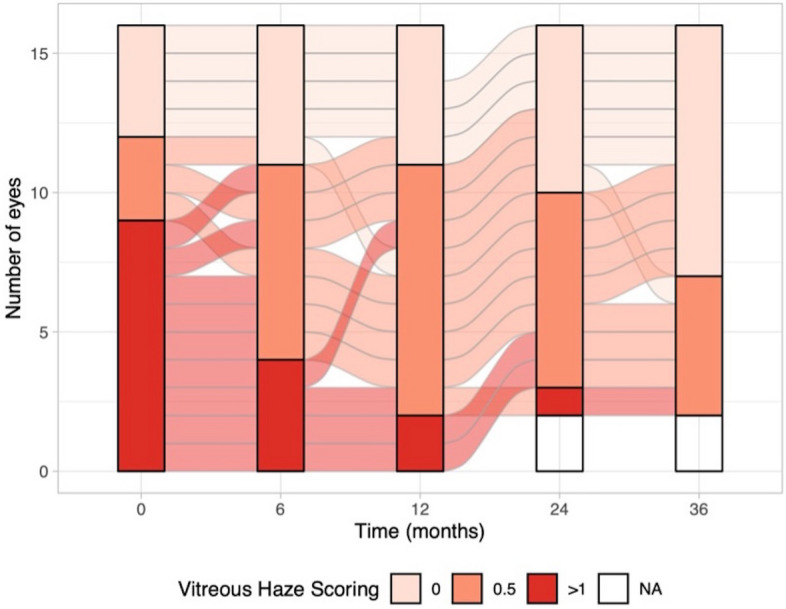
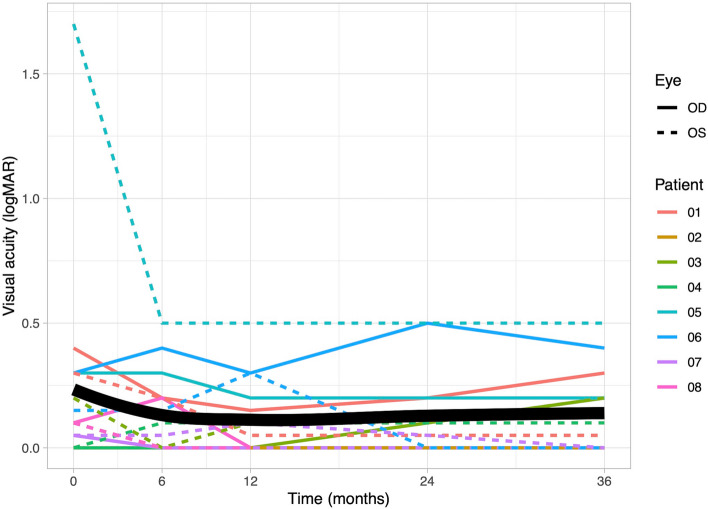
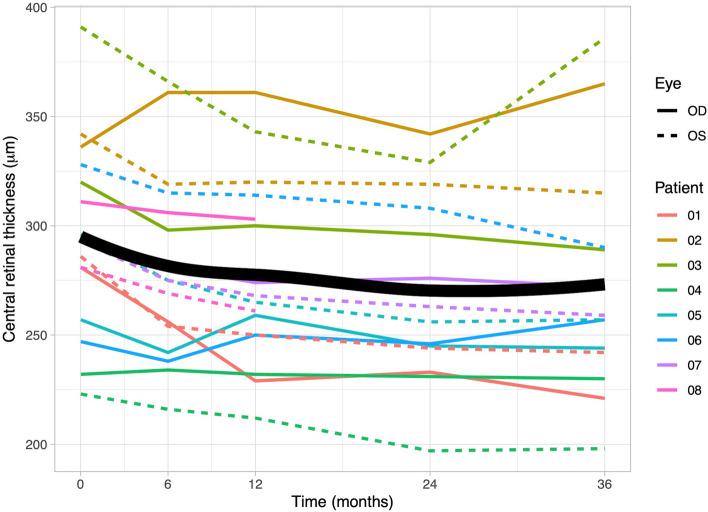
Results: The mean follow-up time with TCZ treatment was 33 months. At baseline, the median FA score was 14 (quartiles: 10.25, 15.25), which significantly decreased over time (at 36 months: 8 (5.5, 11); p = 0.004). In contrast, the ICGA score significantly increased within the first year (median at baseline: 5 (4.75, 7.25); at 6 months: 7 (6, 9.25); at 12 months: 7 (6.5, 9.25); p = 0.002), but returned to baseline levels after two years (at 24 months: 5 (5, 6.5); at 36 months: 5.5 (4, 7.5)). Central retinal thickness (CRT) improved significantly after 6 months (median at baseline: 295 µm (275, 322); at 6 months: 275 µm (251, 308); p = 0.01).
Conclusion: TCZ is effective in reducing retinal vasculitis and CRT in refractory Birdshot uveitis over time, but might be less effective in managing choroidal inflammation. Further studies are needed to determine the optimal treatment strategies for TCZ therapy in NIU.
Keywords: Angiography; Birdshot uveitis; Choroidal inflammation; Indocyanine green; Interleukin-6; Tocilizumab; Uveitis; Vasculitis.
© 2024. The Author(s).
Conflict of interest statement
Declarations. Ethics approval and consent to participate: This study was conducted in accordance with the Declaration of Helsinki. Ethical approval was obtained from the local ethics committee (EA2/066/19). Informed consent was obtained from all subjects involved in the study. Consent for publication: Informed consent was obtained from all subjects regarding publishing their data. Competing interests: The authors declare no competing interests.
Figures
Similar articles
-
Need for Quantitative Measurement Methods for Posterior Uveitis: Comparison of Dual FA/ICGA Angiography, EDI-OCT Choroidal Thickness and SUN Vitreous Haze Evaluation in Stromal Choroiditis.Klin Monbl Augenheilkd. 2018 Apr;235(4):424-435. doi: 10.1055/s-0043-124966. Epub 2018 Apr 18. Klin Monbl Augenheilkd. 2018. PMID: 29669371 English.
-
TWENTY-FOUR MONTH FOLLOW-UP OF TOCILIZUMAB THERAPY FOR REFRACTORY UVEITIS-RELATED MACULAR EDEMA.Retina. 2018 Jul;38(7):1361-1370. doi: 10.1097/IAE.0000000000001690. Retina. 2018. PMID: 28520640
-
Posterior segment inflammatory outcomes assessed using fluorescein angiography in the STOP-UVEITIS study.Int J Retina Vitreous. 2020 Oct 6;6:47. doi: 10.1186/s40942-020-00245-w. eCollection 2020. Int J Retina Vitreous. 2020. PMID: 33042579 Free PMC article.
-
Retinal vasculitis in HLA-A29 birdshot retinochoroiditis, particularities and imaging narrative of an under-estimated and diagnostic component of the disease.J Ophthalmic Inflamm Infect. 2024 Jul 9;14(1):31. doi: 10.1186/s12348-024-00406-0. J Ophthalmic Inflamm Infect. 2024. PMID: 38980473 Free PMC article. Review.
-
Efficacy of Anti-IL6-Receptor Tocilizumab in Refractory Cystoid Macular Edema of Birdshot Retinochoroidopathy Report of Two Cases and Literature Review.Ocul Immunol Inflamm. 2017 Oct;25(5):604-609. doi: 10.1080/09273948.2016.1231331. Epub 2016 Oct 11. Ocul Immunol Inflamm. 2017. PMID: 27726475 Review.
Cited by
-
The Role of Cytokines in Degenerative Retinal Diseases: A Comprehensive Review.Biomedicines. 2025 Jul 15;13(7):1724. doi: 10.3390/biomedicines13071724. Biomedicines. 2025. PMID: 40722794 Free PMC article. Review.
References
-
- Miserocchi E, Fogliato G, Modorati G et al (2013) Review on the worldwide epidemiology of uveitis. Eur J Ophthalmol 23:705–717 - PubMed
-
- Thorne JE, Suhler E, Skup M et al (2016) Prevalence of noninfectious uveitis in the United States: A Claims-Based Analysis. JAMA Ophthalmol 134:1237–1245 - PubMed
-
- Gritz DC, Wong IG (2004) Incidence and prevalence of uveitis in Northern California; the Northern California Epidemiology of Uveitis Study. Ophthalmology 111:491–500 - PubMed
-
- Jaffe GJ, Dick AD, Brézin AP et al (2016) Adalimumab in patients with active noninfectious uveitis. N Engl J Med 375:932–943 - PubMed
-
- Nguyen QD, Merrill PT, Jaffe GJ et al (2016) Adalimumab for prevention of uveitic flare in patients with inactive non-infectious uveitis controlled by corticosteroids (VISUAL II): a multicentre, double-masked, randomised, placebo-controlled phase 3 trial. Lancet 388:1183–1192 - PubMed
LinkOut - more resources
Full Text Sources
Research Materials
