

Numerical simulation method for the assessment of the effect of molar activity on the pharmacokinetics of radioligands in small animals
- PMID: 39570519
- PMCID: PMC11582259
- DOI: 10.1186/s41181-024-00308-5
Numerical simulation method for the assessment of the effect of molar activity on the pharmacokinetics of radioligands in small animals
Abstract
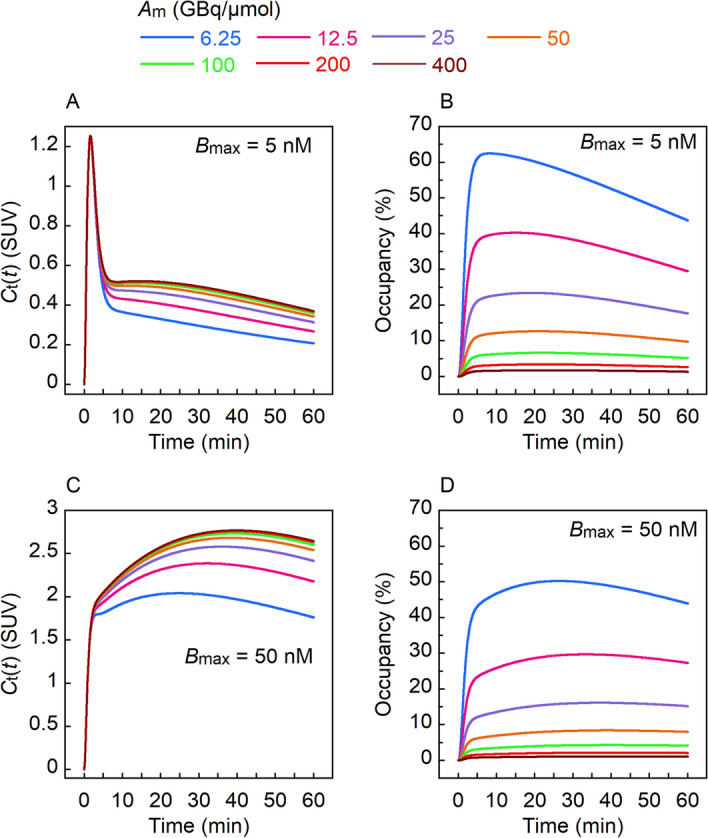
Background: It is well recognized that the molar activity of a radioligand is an important pharmacokinetic parameter, especially in positron emission tomography (PET) of small animals. Occupation of a significant number of binding sites by radioligand molecules results in low radioligand accumulation in a target region (mass effect). Nevertheless, small-animal PET studies have often been performed without consideration of the molar activity or molar dose of radioligands. A simulation study would therefore help to assess the importance of the mass effect in small-animal PET. Here, we introduce a new compartmental model-based numerical method, which runs on commonly used spreadsheet software, to simulate the effect of molar activity or molar dose on the pharmacokinetics of radioligands.
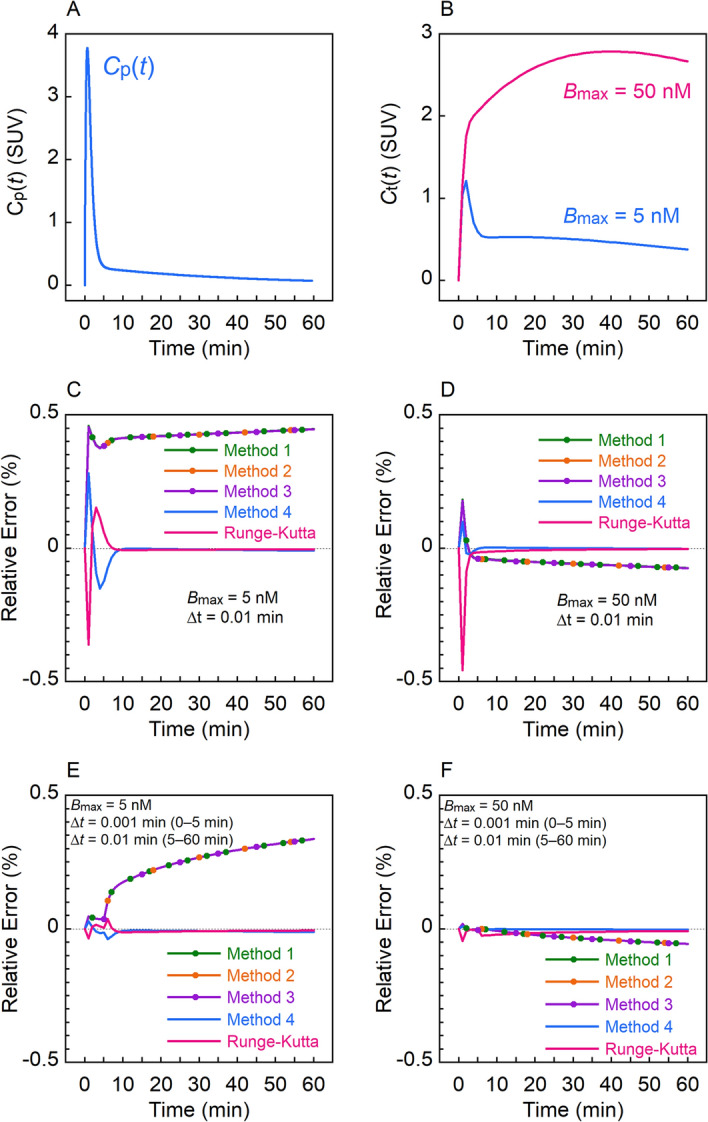
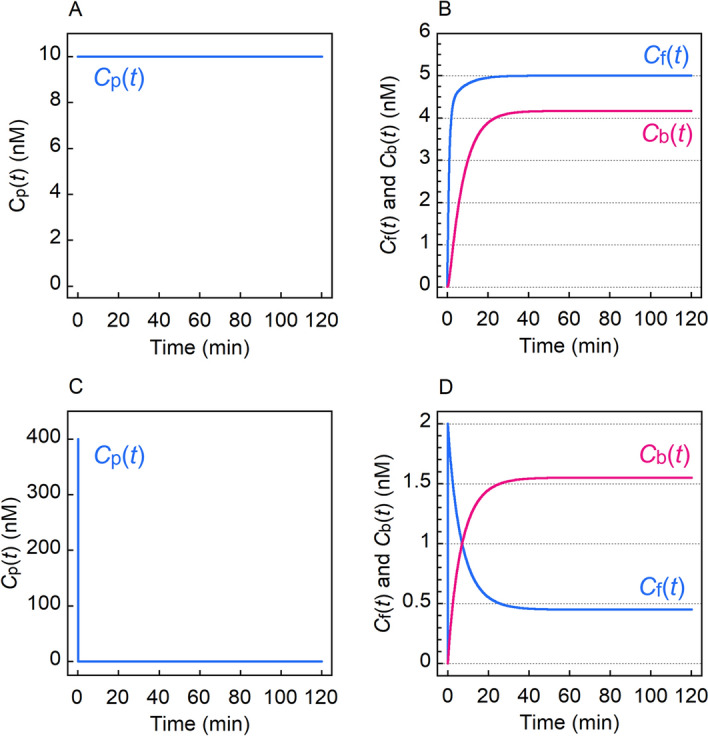
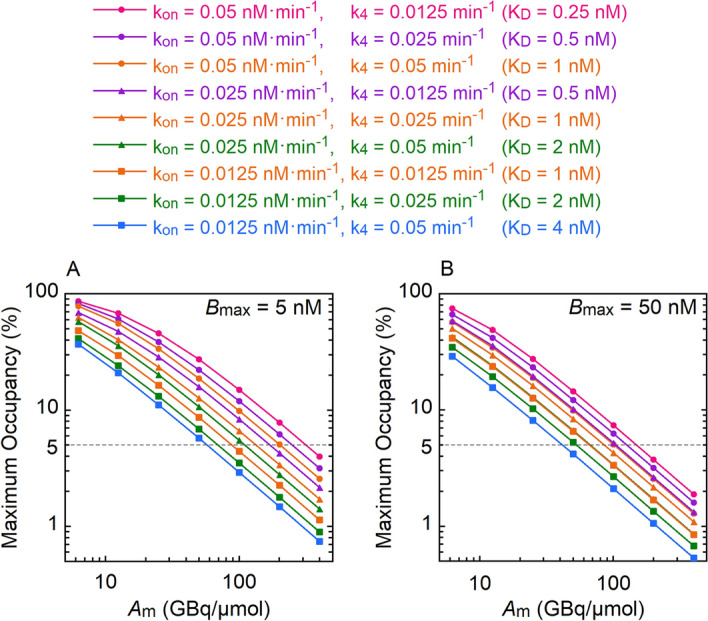
Results: Assuming a two-tissue compartmental model, time-concentration curves of a radioligand were generated using four simulation methods and the well-known Runge-Kutta numerical method. The values were compared with theoretical values obtained under an ultra-high molar activity condition (pseudo-first-order binding kinetics), a steady-state condition and an equilibrium condition (second-order binding kinetics). For all conditions, the simulation method using the simplest calculation yielded values closest to the theoretical values and comparable with those obtained using the Runge-Kutta method. To satisfy a maximum occupancy less than 5%, simulations showed that a molar activity greater than 150 GBq/μmol is required for a model radioligand when 20 MBq is administered to a 250 g rat and when the concentration of binding sites in target regions is greater than 1.25 nM.
Conclusions: The simulation method used in this study is based on a very simple calculation and runs on widely used spreadsheet software. Therefore, simulation of radioligand pharmacokinetics using this method can be performed on a personal computer and help to assess the importance of the mass effect in small-animal PET. This simulation method also enables the generation of a model time-activity curve for the evaluation of kinetic analysis methods.
Keywords: Mass effect; Molar activity; Numerical method; Simulation.
© 2024. The Author(s).
Conflict of interest statement
Declarations. Ethics approval and consent to participate: Not applicable. Consent for publication: Not applicable. Competing interests: The authors declare that they have no competing interests.
Figures


Similar articles
-
Development of two fluorine-18 labeled PET radioligands targeting PDE10A and in vivo PET evaluation in nonhuman primates.Nucl Med Biol. 2018 Feb;57:12-19. doi: 10.1016/j.nucmedbio.2017.10.004. Epub 2017 Oct 23. Nucl Med Biol. 2018. PMID: 29223715
-
Potentials and pitfalls using high affinity radioligands in PET and SPET determinations on regional drug induced D2 receptor occupancy--a simulation study based on experimental data.Neuroimage. 2001 Oct;14(4):936-45. doi: 10.1006/nimg.2001.0879. Neuroimage. 2001. PMID: 11554812
-
Influence of binding affinity and blood plasma level on cerebral pharmacokinetics and PET imaging characteristics of two novel xanthine PET radioligands for the A1 adenosine receptor.Nucl Med Biol. 2020 Mar-Apr;82-83:1-8. doi: 10.1016/j.nucmedbio.2019.12.001. Epub 2019 Dec 2. Nucl Med Biol. 2020. PMID: 31838339
-
Modeling of the renal kinetics of the AT1 receptor specific PET radioligand [11C]KR31173.Biomed Res Int. 2013;2013:835859. doi: 10.1155/2013/835859. Epub 2013 Sep 8. Biomed Res Int. 2013. PMID: 24083243 Free PMC article.
-
A two-dimensional mathematical model of non-linear dual-sorption of percutaneous drug absorption.Biomed Eng Online. 2005 Jul 3;4:40. doi: 10.1186/1475-925X-4-40. Biomed Eng Online. 2005. PMID: 15992411 Free PMC article.
References
-
- Alexoff DL, Vaska P, Marsteller D, Gerasimov T, Li J, Logan J, Fowler JS, Taintor NB, Thanos PK, Volkow ND. Reproducibility of 11C-raclopride binding in the rat brain measured with the microPET R4: effects of scatter correction and tracer specific activity. J Nucl Med. 2003;44:815–22. - PubMed
-
- Ashworth S, Rabiner EA, Gunn RN, Plisson C, Wilson AA, Comley RA, Lai RYK, Gee AD, Laruelle M, Cunningham VJ. Evaluation of 11C-GSK189254 as a novel radioligand for the H3 receptor in humans using PET. J Nucl Med. 2010;51:1021–9. - PubMed
-
- Barrett PH, Bell BM, Cobelli C, Golde H, Schumitzky A, Vicini P, Foster DM. SAAM II: simulation, analysis, and modeling software for tracer and pharmacokinetic studies. Metabolism. 1998;47:484–92. - PubMed
-
- Burger C, Buck A. Requirements and implementation of a flexible kinetic modeling tool. J Nucl Med. 1997;38:1818–23. - PubMed
Grants and funding
LinkOut - more resources
Full Text Sources