. 2024 Nov 21;135(2):e183219.
doi: 10.1172/JCI183219.

Ferroptosis of select skin epithelial cells initiates and maintains chronic systemic immune-mediated psoriatic disease

Affiliations

Ferroptosis of select skin epithelial cells initiates and maintains chronic systemic immune-mediated psoriatic disease

Kavita Vats et al. J Clin Invest. .

Abstract

Dysregulations of epithelial-immune interactions frequently culminate in chronic inflammatory diseases of the skin, lungs, kidneys, and gastrointestinal tract. Yet, the intraepithelial processes that initiate and perpetuate inflammation in these organs are poorly understood. Here, by utilizing redox lipidomics we identified ferroptosis-associated peroxidation of polyunsaturated phosphatidylethanolamines in the epithelia of patients with asthma, cystic fibrosis, psoriasis, and renal failure. Focusing on psoriasis as a disease model, we used high-resolution mass spectrometry imaging and identified keratin 14-expressing (K14-expressing) keratinocytes executing a ferroptotic death program in human psoriatic skin. Psoriatic phenotype with characteristic Th1/Th17 skin and extracutaneous immune responses was initiated and maintained in a murine model designed to actuate ferroptosis in a fraction of K14+ glutathione peroxidase 4-deficient (Gpx4-deficient) epidermal keratinocytes. Importantly, an antiferroptotic agent, liproxstatin-1, was as effective as clinically relevant biological IL-12/IL-23/TNF-α-targeting therapies or the depletion of T cells in completely abrogating molecular, biochemical, and morphological features of psoriasis. As ferroptosis in select epidermal keratinocytes triggers and sustains a pathological psoriatic multiorgan inflammatory circuit, we suggest that strategies targeting ferroptosis or its causes may be effective in preventing or ameliorating a variety of chronic inflammatory diseases.

Keywords: Autoimmune diseases; Cell stress; Dermatology; Inflammation; Skin.


Figures

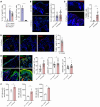
Figure 1
Figure 1. Pro-ferroptotic epidermal oxPE signals in psoriasis are associated with decreased Gpx4 and increased 15-LOX-2 levels.
(A) Volcano plotof oxidized PE species (with 1–3 [O]) measured by LC-MS from pulmonary airway epithelium of patients with cystic fibrosis (CF) versus non-CF patients (red circles), from patient-matched psoriatic lesional versus control perilesional epidermis (blue circles), from bronchial epithelium of patients with severe asthma versus asthma-free patients (green circles), and from proximal and distal renal tubular epithelium of non-recovered versus recovered patients after acute kidney injury (AKI; purple circles). Ferroptosis-specific oxPE signals [PE(36:4)+2O, PE(36:5)+2O, PE(38:4)+2O] are indicated by stars. (B and C) Gene expression of ferroptosis markers and regulators in psoriatic versus patient-matched perilesional skin identified by the ferroptosis database FerrDb (B) or QIAGEN Ingenuity Pathway Analysis (C); n = 3. (D) Relative expression of Gpx4 in psoriatic and patient-matched nonlesional epidermis; n = 10. (E and F) Immunofluorescence (IF) images of psoriatic and perilesional skin (E) and mean fluorescence intensities (MFIs) per square micrometer of Gpx4 in basal/epibasal and spinous layers (F); n = 80 regions of interest (ROIs) per group, 3 patients. (G) Isolation of CD45EGFR+CD104+CD49f+ basal KCs from human epidermis by FACS. (H) Relative Gpx4 expression in basal KCs isolated from psoriatic or control (nonlesional) epidermis as shown in G; n = 9. (I) Flow cytometry (top) and MFI (bottom) of Gpx4 in basal KCs from psoriatic versus control skin; n = 3. (J and K) IF images of psoriatic and perilesional skin (J) and 15-LOX-2 MFI per square micrometer in basal/epibasal and spinous layers (K); n = 54 ROIs per group, 3 patients. (L and M) IF images of psoriatic and perilesional skin (L) and oxBODIPY488/BODIPY546 (MFI/MFI) in basal/epibasal and spinous KCs (M); n = 21 ROIs per group, 3 patients. Dermal-epidermal junction is outlined in all IF images by white dashed lines. Data are means ± SD. Two-tailed Student’s t test (D, H, and I), 1-way ANOVA (F, K, and M); *P < 0.05. Scale bars: 50 μm.
Figure 2
Figure 2. Elevated oxPE ferroptosis death signals in psoriatic epidermis are overrepresented within the K14+ KCs.
(A) Overlay of MALDI-MS and IF imaging of human nonlesional (control) skin (left) and psoriatic skin (right). MALDI-MS ratiometric grayscale images (20 μm raster, negative ion mode) show the abundance ratio of detected m/z 826.6 to 794.6 ions, corresponding to PE(40:4)+2O and PE(40:4), respectively. Scale bars: 100 μm. PanCK, pan-cytokeratin. (B) MALDI-MS signal intensities (single pixel) of oxPE/PE [PE(40:4)+2O/PE(40:4), PE(40:4)+3O/PE(40:4)] in panCK+K14 and K14+ regions of control and psoriatic epidermides. Numbers of pixels in each group are indicated over the first violin plot. (C) C60-SIMS imaging of K14+ and panCK+ cells in control skin (top) and psoriatic skin (bottom). Scale bars: 50 μm. Regions within dashed rectangles are shown magnified in D. (D) Overlay of panCK+ and K14+ epidermal regions (obtained by C60-SIMS) and lipids [cholesterol sulfate, PE, and oxPE species; obtained by (H2O)n-GCIB-SIMS] in control skin (top) and psoriatic skin (bottom). Color intensities representing each lipid species were adjusted to match a relative scale of 0 to 100 (color bars). Scale bars: 50 μm. (E) Single-cell (H2O)n-GCIB-SIMS signal intensities of select pro-ferroptotic oxPE species within panCK+K14 and K14+ epidermal KCs in control versus psoriatic skin. Numbers of cells in each group are indicated over the first violin plot. Data are means ± SD. Two-tailed Student’s t test; *P < 0.05.
Figure 3
Figure 3. Gpx4 depletion in K14+ epidermal KCs of K14/Gpx4 mice triggers their ferroptosis.
(A) Flow cytometry of the ear epidermis of K14/Gpx4, Cre+ control, and Cre control mice 25 days after TMX initiation. Each dot represents an individual mouse. (BE) IF images of the skin of K14/Gpx4, Cre+ control, and Cre control mice 18 days after TMX initiation, and quantification of Cre+ (B) and TUNEL+ (C) KCs in epidermis, percentage TUNEL+ of Cre+ KCs (D), and Ki67+ KCs, epidermal oxC11-BODIPY488/BODIPY546 (MFI/MFI), and epidermal 4-HNE MFI per μm2 (E). Blue, DAPI; scale bars: 50 μm. n = 3 mice per group. (F) Levels of pro-ferroptotic death signals PE(38:4)+2O, PE(36:4)+2O, and PE(36:3)+2O in ear epidermis of K14/Gpx4 and Cre control mice 5 days after TMX initiation; n = 3 mice per group. Data are means ± SD. Two-tailed Student’s t test; *P < 0.05.
Figure 4
Figure 4. Gpx4 depletion in select K14+ KCs produces T cell–dependent psoriasiform inflammation.
(A) Psoriasis-like skin changes in a K14/Gpx4 mouse 25 days after TMX initiation. (B) Skin induration, desquamation scores, and their sum (severity score) of K14/Gpx4 and Cre control mice as a function of days after TMX initiation; n = 10–15 mice per group. (C and D) Severity scores (C) and photographs (D) of K14/Gpx4 mice when TMX injections were continued over 32 days or stopped on day 14 after TMX initiation; n = 4 mice per group. (E) Serum IL-6 levels of K14/Gpx4 and Cre control mice (ELISA) 23 days after TMX initiation. (FI) H&E and IF images (F), flow cytometry (G), quantitative real-time PCR (H), and LC-MS lipidomic analyses (I) of the skin of K14/Gpx4 and Cre control mice 23 days after TMX initiation. Blue, DAPI; scale bars: 50 μm. Each dot in EI represents an individual mouse. (J) Western blot of Stat3, Erk1/2, and Akt phosphorylation in the skin of K14/Gpx4 and Cre control mice 15 days after TMX initiation; n = 2 mice per group. (K) Effects of antibody-mediated T cell depletion on the severity scores of K14/Gpx4 and Cre control mice as a function of time (days) after TMX initiation; n = 4 mice per group. Data are means ± SD. Two-way ANOVA (B, C, and K), 2-tailed Student’s t test (E and GI); *P < 0.05.
Figure 5
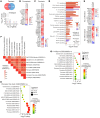
Figure 5. K14/Gpx4 model recapitulates transcriptional profile of psoriasis.
(A) Comparison of DEGs (P < 0.05, |FC| > 1.5) in psoriatic skin (vs. patient-matched perilesional skin; n = 3 patients) with DEGs in K14/Gpx4 skin (vs. Cre controls; n = 3 mice per group) using Illumina Correlation Engine. (B and C) Changes in the expression of ferroptosis-associated (B) and psoriasis-associated (C) genes (P < 0.05, |FC| > 1.5) in psoriatic versus patient-matched perilesional skin and K14/Gpx4 versus Cre control mouse skin (18 days after TMX initiation). (D and E) Ingenuity Pathway Analysis (IPA) (D) and Gene Ontology (E) enrichment analyses using DEGs of psoriasis versus patient-matched perilesional skin and DEGs of K14/Gpx4 versus Cre control mouse skin. (F) Pearson’s correlation coefficients from pairwise comparisons of transcriptional profiles of 3 human psoriasis datasets (including this study) and 5 mouse models of psoriasis (including K14/Gpx4) based on z scores of 19 psoriasis-associated pathways shown in D. (G and H) Correlation analyses of the overlapping DEGs between K14/Gpx4 model (vs. Cre control) (G) or human psoriasis (lesional vs. patient-matched perilesional skin) (H) and select published studies on human psoriasis and murine models; Fisher’s exact test, Illumina Correlation Engine.
Figure 6
Figure 6. Psoriasiform inflammatory phenotype of K14/Gpx4 model responds to anti–IL-12/IL-23/TNF-α and anti-ferroptosis therapies.
(A) Severity scores of K14/Gpx4 mice treated with anti–IL-12p40, anti–IL-23p19, or anti–TNF-α antibodies or IgG1/IgG2a isotype control antibodies, in conjunction with TMX; n = 6 mice per group, *P < 0.05 vs. vehicle control and respective isotype control. (B) Photographs of K14/Gpx4 mice treated with anti–IL-12p40 antibodies or isotype control antibodies on days 8 and 25 after TMX initiation. (C and D) Relative expression of IL-1β, IL-6, S100a8, IL-23, and TNF-α (RT-qPCR) (C) and percentages of immune cells (flow cytometry) (D) in skin of K14/Gpx4 mice treated with anti–IL-12p40, anti–IL-23p19, or anti–TNF-α antibodies or vehicle control 35 days after TMX initiation; n = 5 mice per group, *P < 0.05 vs. no-treatment control. (E) Severity scores of K14/Gpx4 mice treated with Lip-1 or vehicle control, in conjunction with TMX. Lip-1 was started on either day 2 (Lip-1A) or day 21 (Lip-1B); n = 5–6 mice per group, *P < 0.05 vs. control (days 3–34 for Lip-1A, days 25–34 for Lip-1B). (F) Photographs of K14/Gpx4 mice treated with Lip-1 or vehicle control. Shown are days 3 and 21 for Lip-1A and days 23 and 51 for Lip-1B after TMX initiation. (G and H) Relative expression of IL-1β, IL-6, S100a8, IL-23, TNF-α, IFN-γ, and IL-17A (RT-qPCR) (G) and percentages of immune cells (flow cytometry) (H) in skin of K14/Gpx4 mice treated with Lip-1A or vehicle control 35 days after TMX initiation; n = 5 mice per group, *P < 0.05 vs. control. Data are means ± SD. Two-way ANOVA (A and E), 1-way ANOVA (C and D), 2-tailed Student’s t test (G and H). Each dot in C, D, G, and H represents an individual mouse.

References

    1. Nagasaki T, et al. 15LO1 dictates glutathione redox changes in asthmatic airway epithelium to worsen type 2 inflammation. J Clin Invest. 2022;132(1):e151685. doi: 10.1172/JCI151685. - DOI - PMC - PubMed
    1. Dar HH, et al. Pseudomonas aeruginosa utilizes host polyunsaturated phosphatidylethanolamines to trigger theft-ferroptosis in bronchial epithelium. J Clin Invest. 2018;128(10):4639–4653. doi: 10.1172/JCI99490. - DOI - PMC - PubMed
    1. Wenzel SE, et al. PEBP1 wardens ferroptosis by enabling lipoxygenase generation of lipid death signals. Cell. 2017;171(3):628–641. doi: 10.1016/j.cell.2017.09.044. - DOI - PMC - PubMed
    1. Armstrong AW, Read C. Pathophysiology, clinical presentation, and treatment of psoriasis: a review. JAMA. 2020;323(19):1945–1960. doi: 10.1001/jama.2020.4006. - DOI - PubMed
    1. Dainichi T, et al. The epithelial immune microenvironment (EIME) in atopic dermatitis and psoriasis. Nat Immunol. 2018;19(12):1286–1298. doi: 10.1038/s41590-018-0256-2. - DOI - PubMed

MeSH terms