. 2024 Dec 24;43(12):114991.
doi: 10.1016/j.celrep.2024.114991. Epub 2024 Nov 20.

ZBTB7A is a modulator of KDM5-driven transcriptional networks in basal breast cancer

Affiliations

ZBTB7A is a modulator of KDM5-driven transcriptional networks in basal breast cancer

Benedetto DiCiaccio et al. Cell Rep. .

Abstract

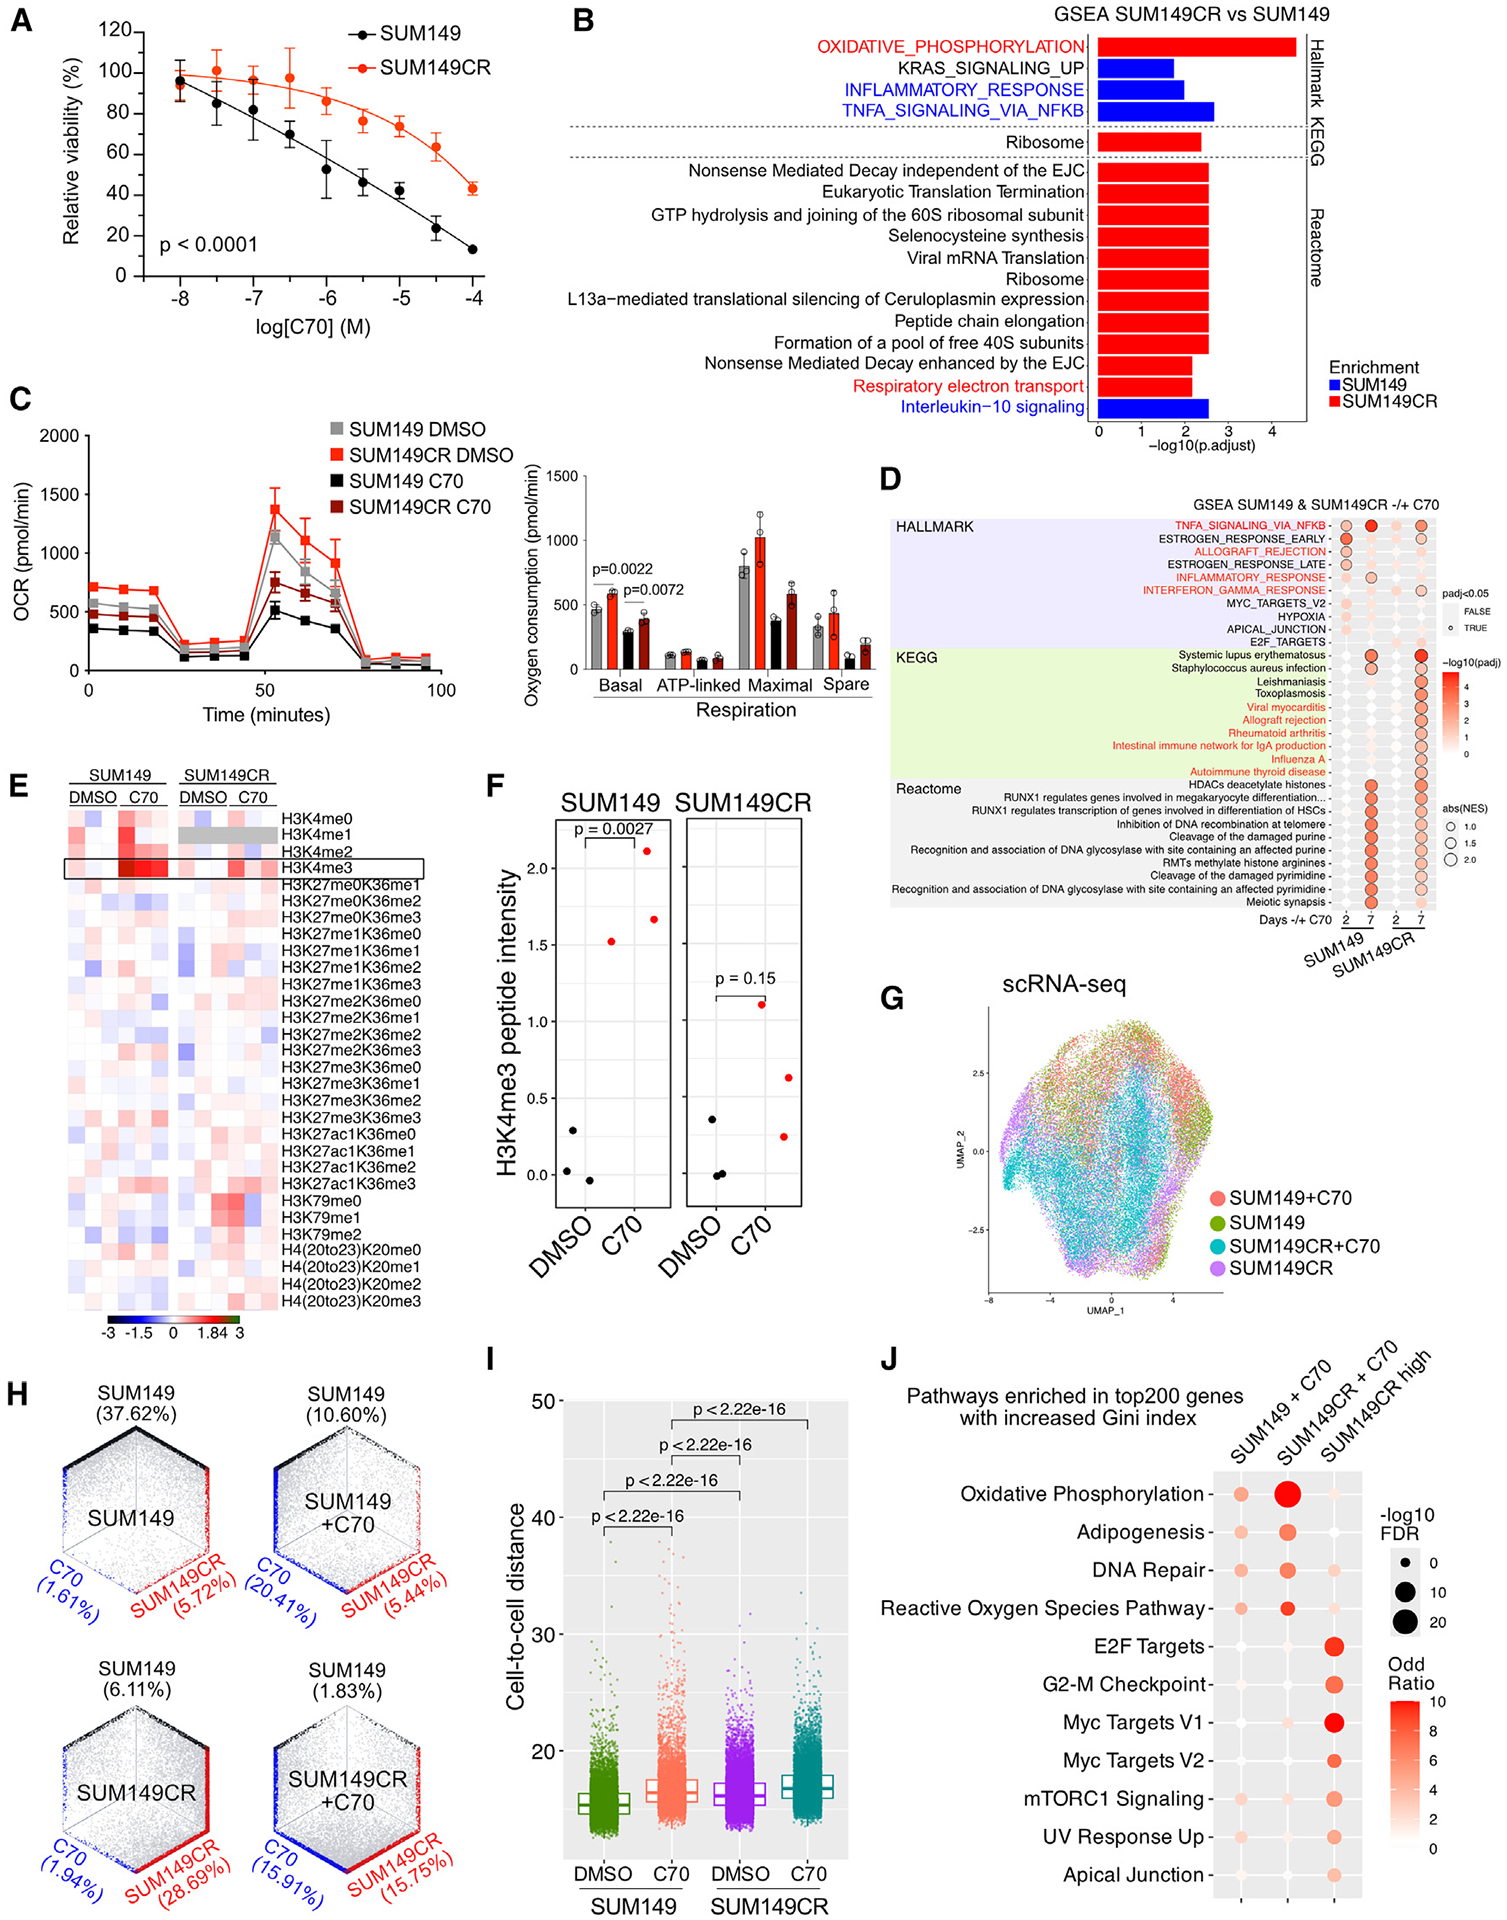
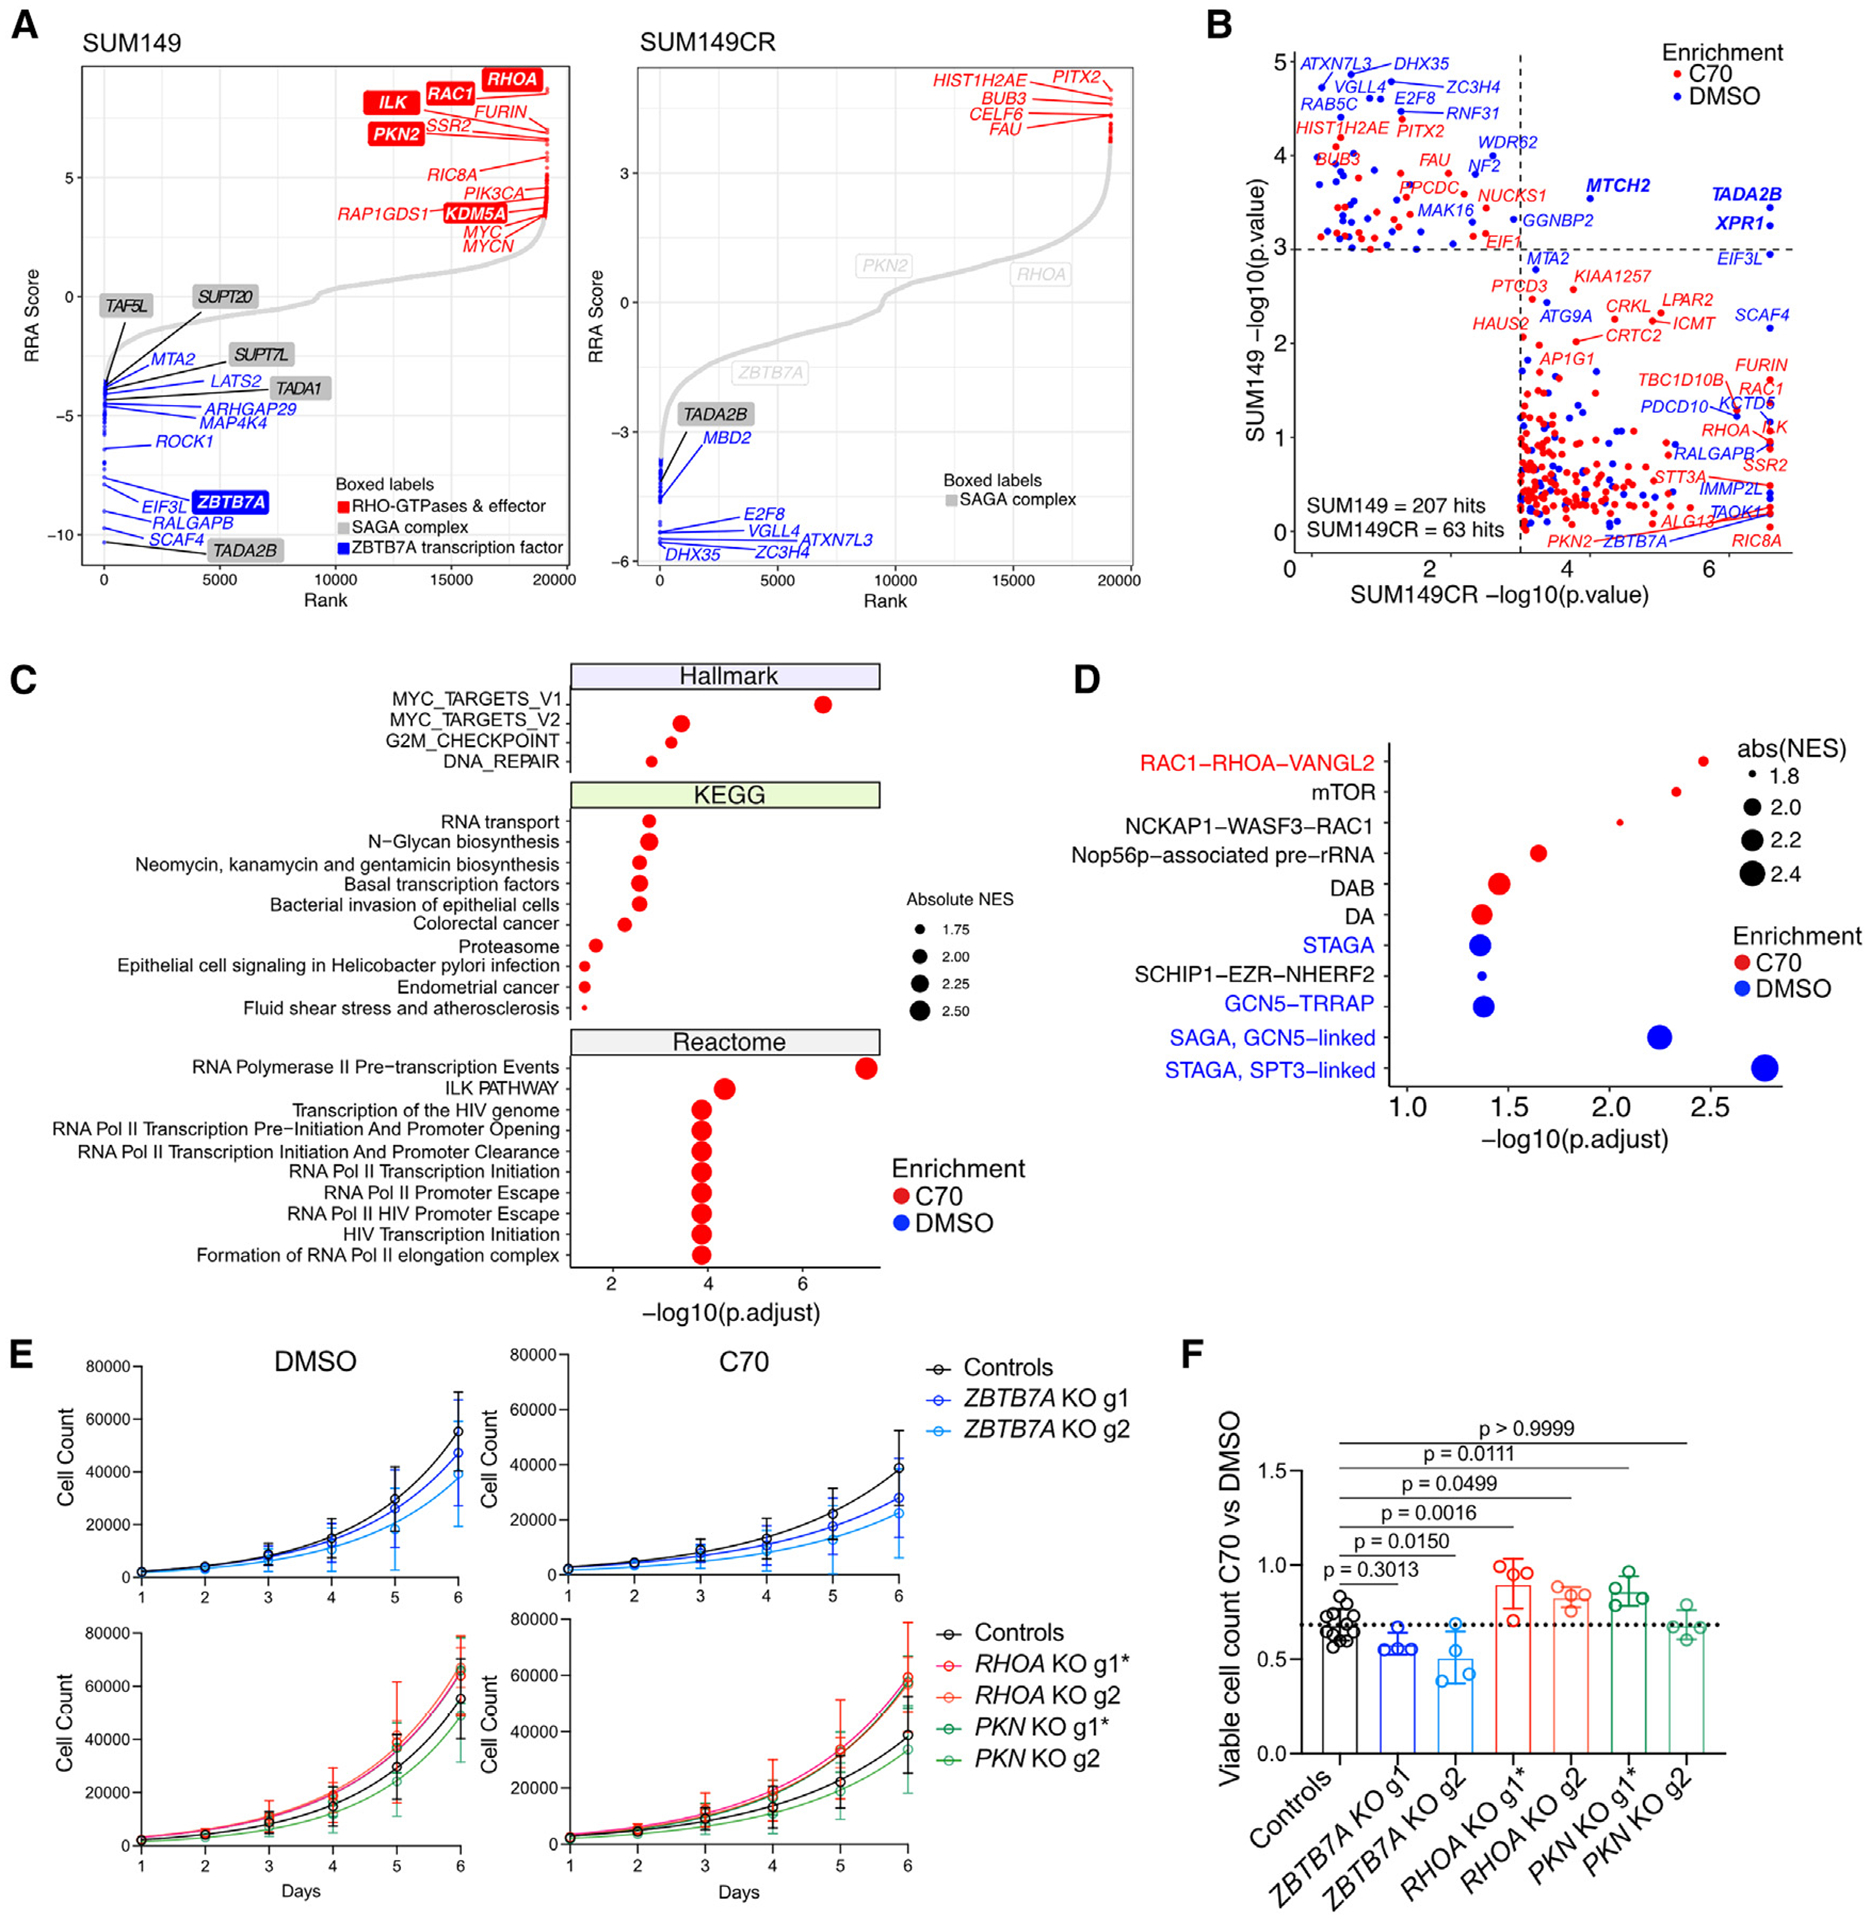
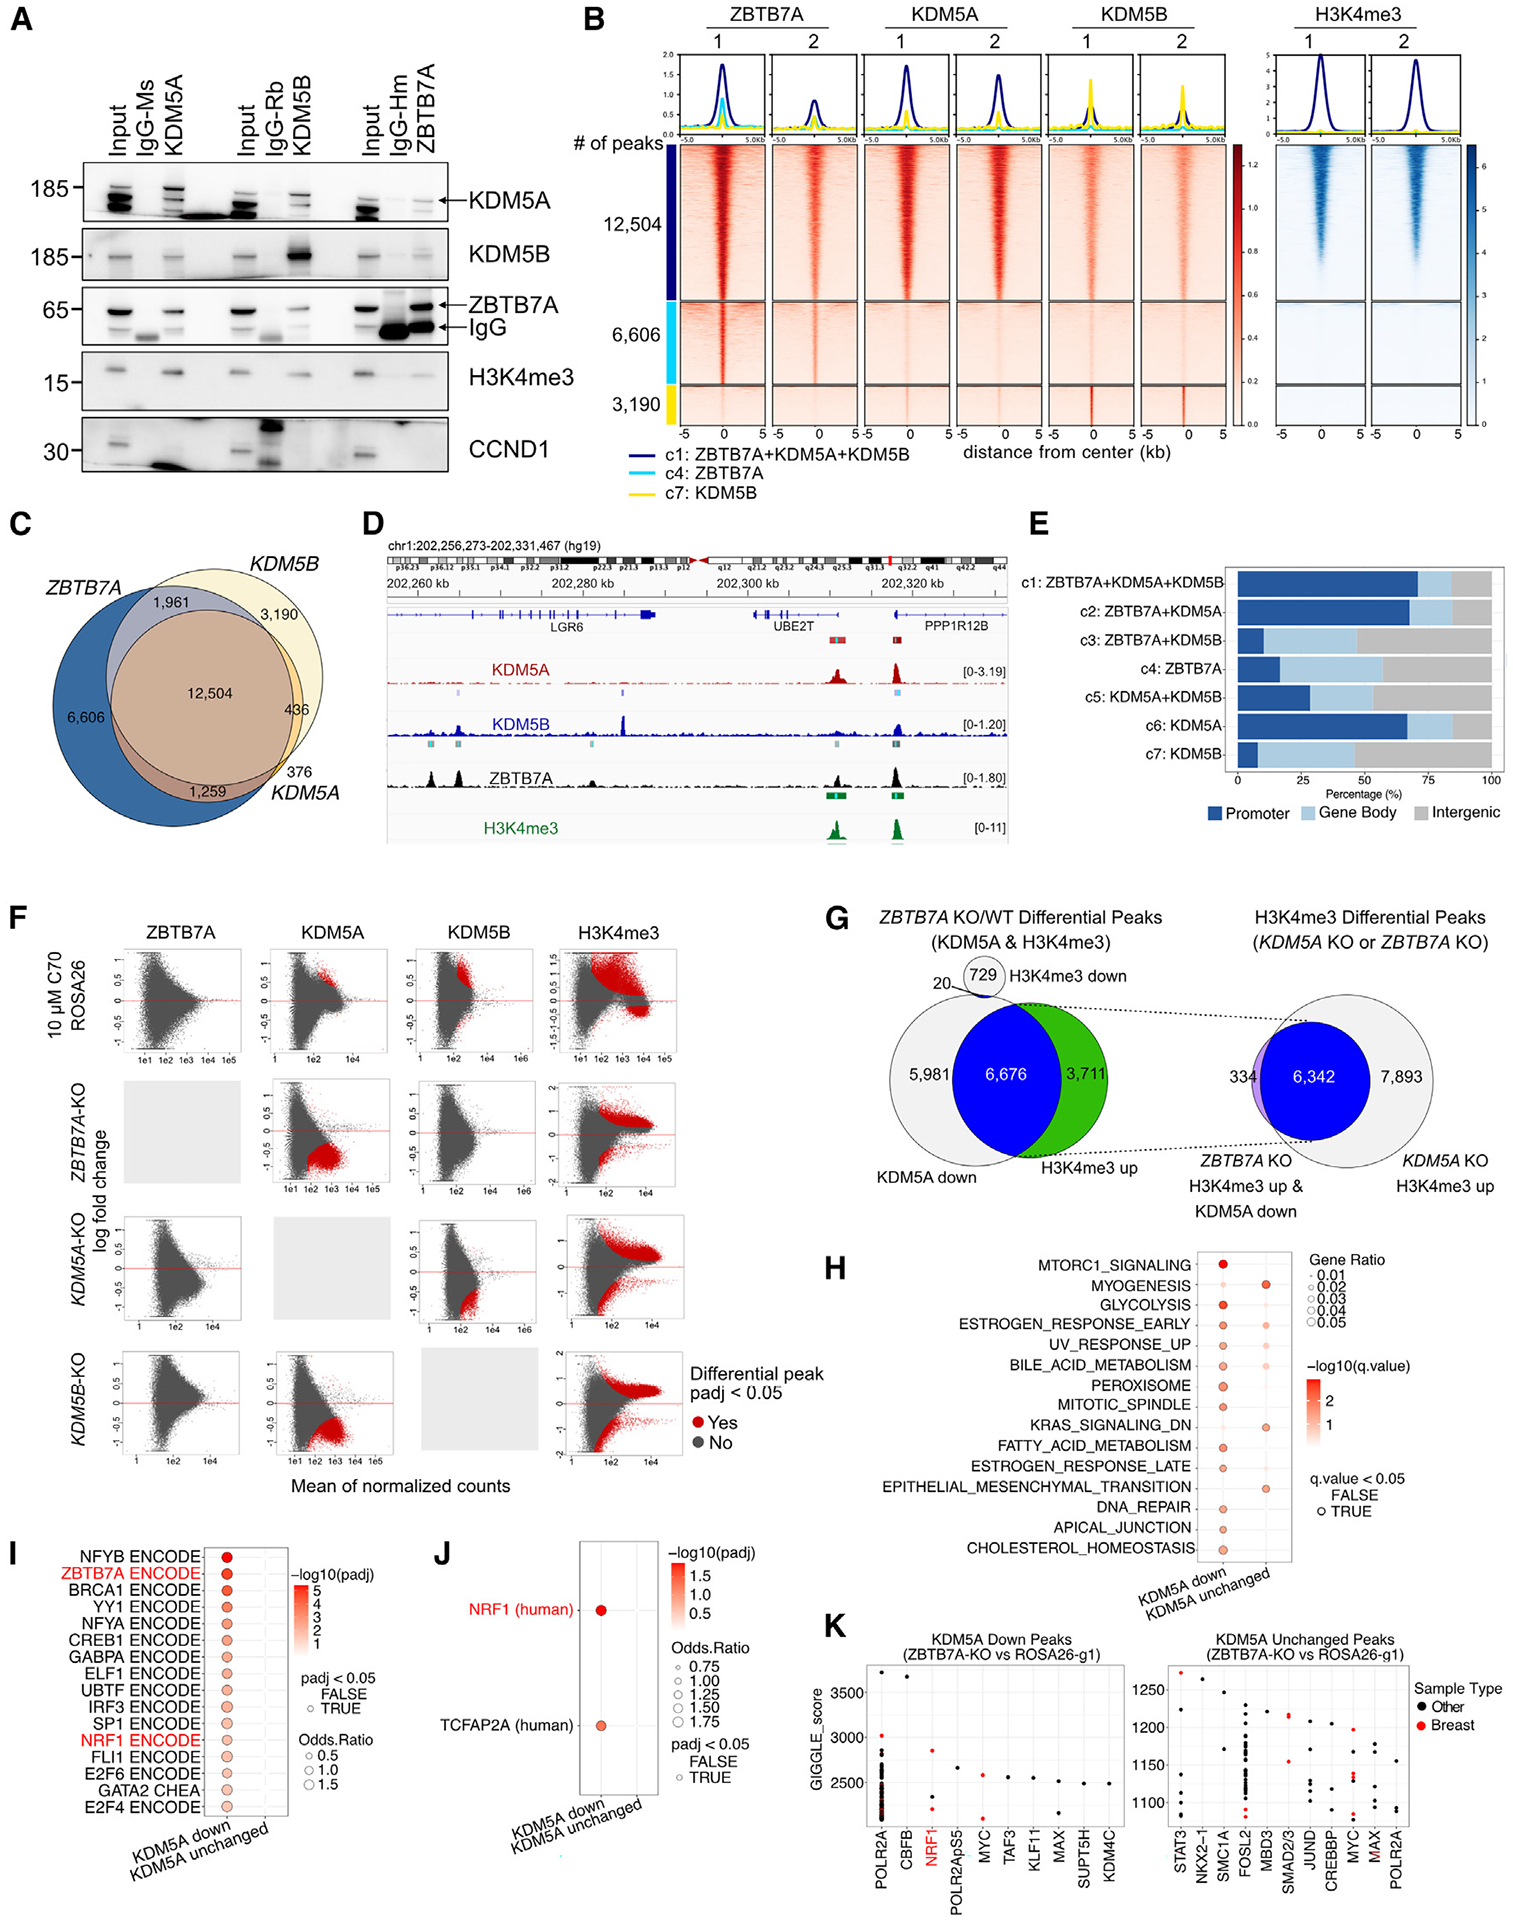
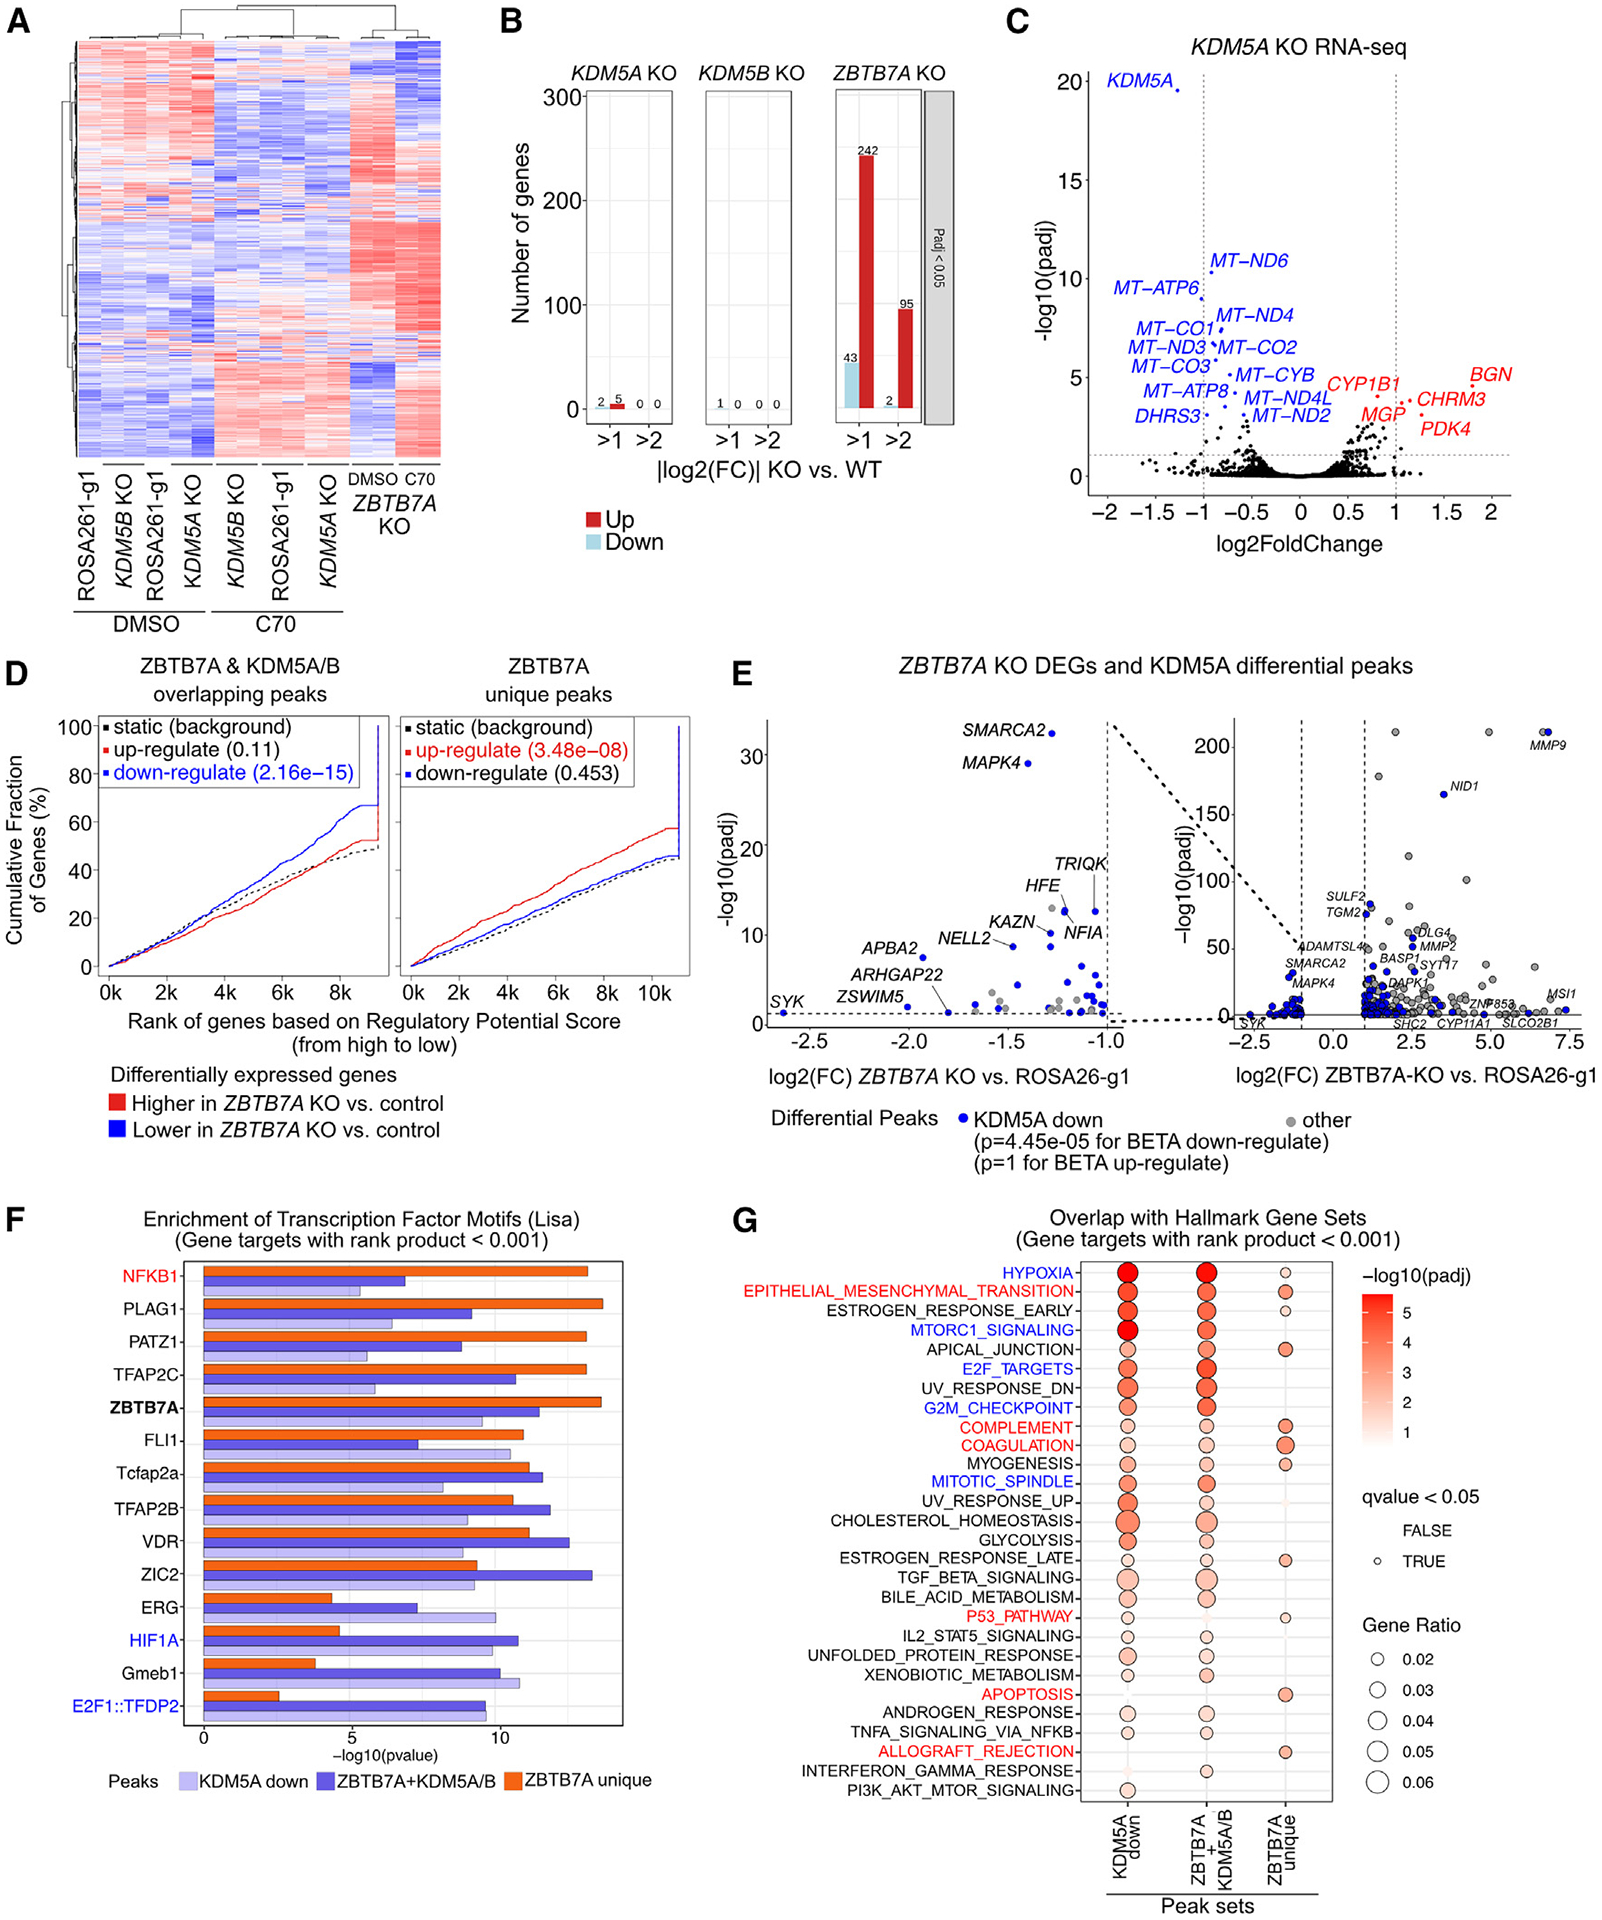
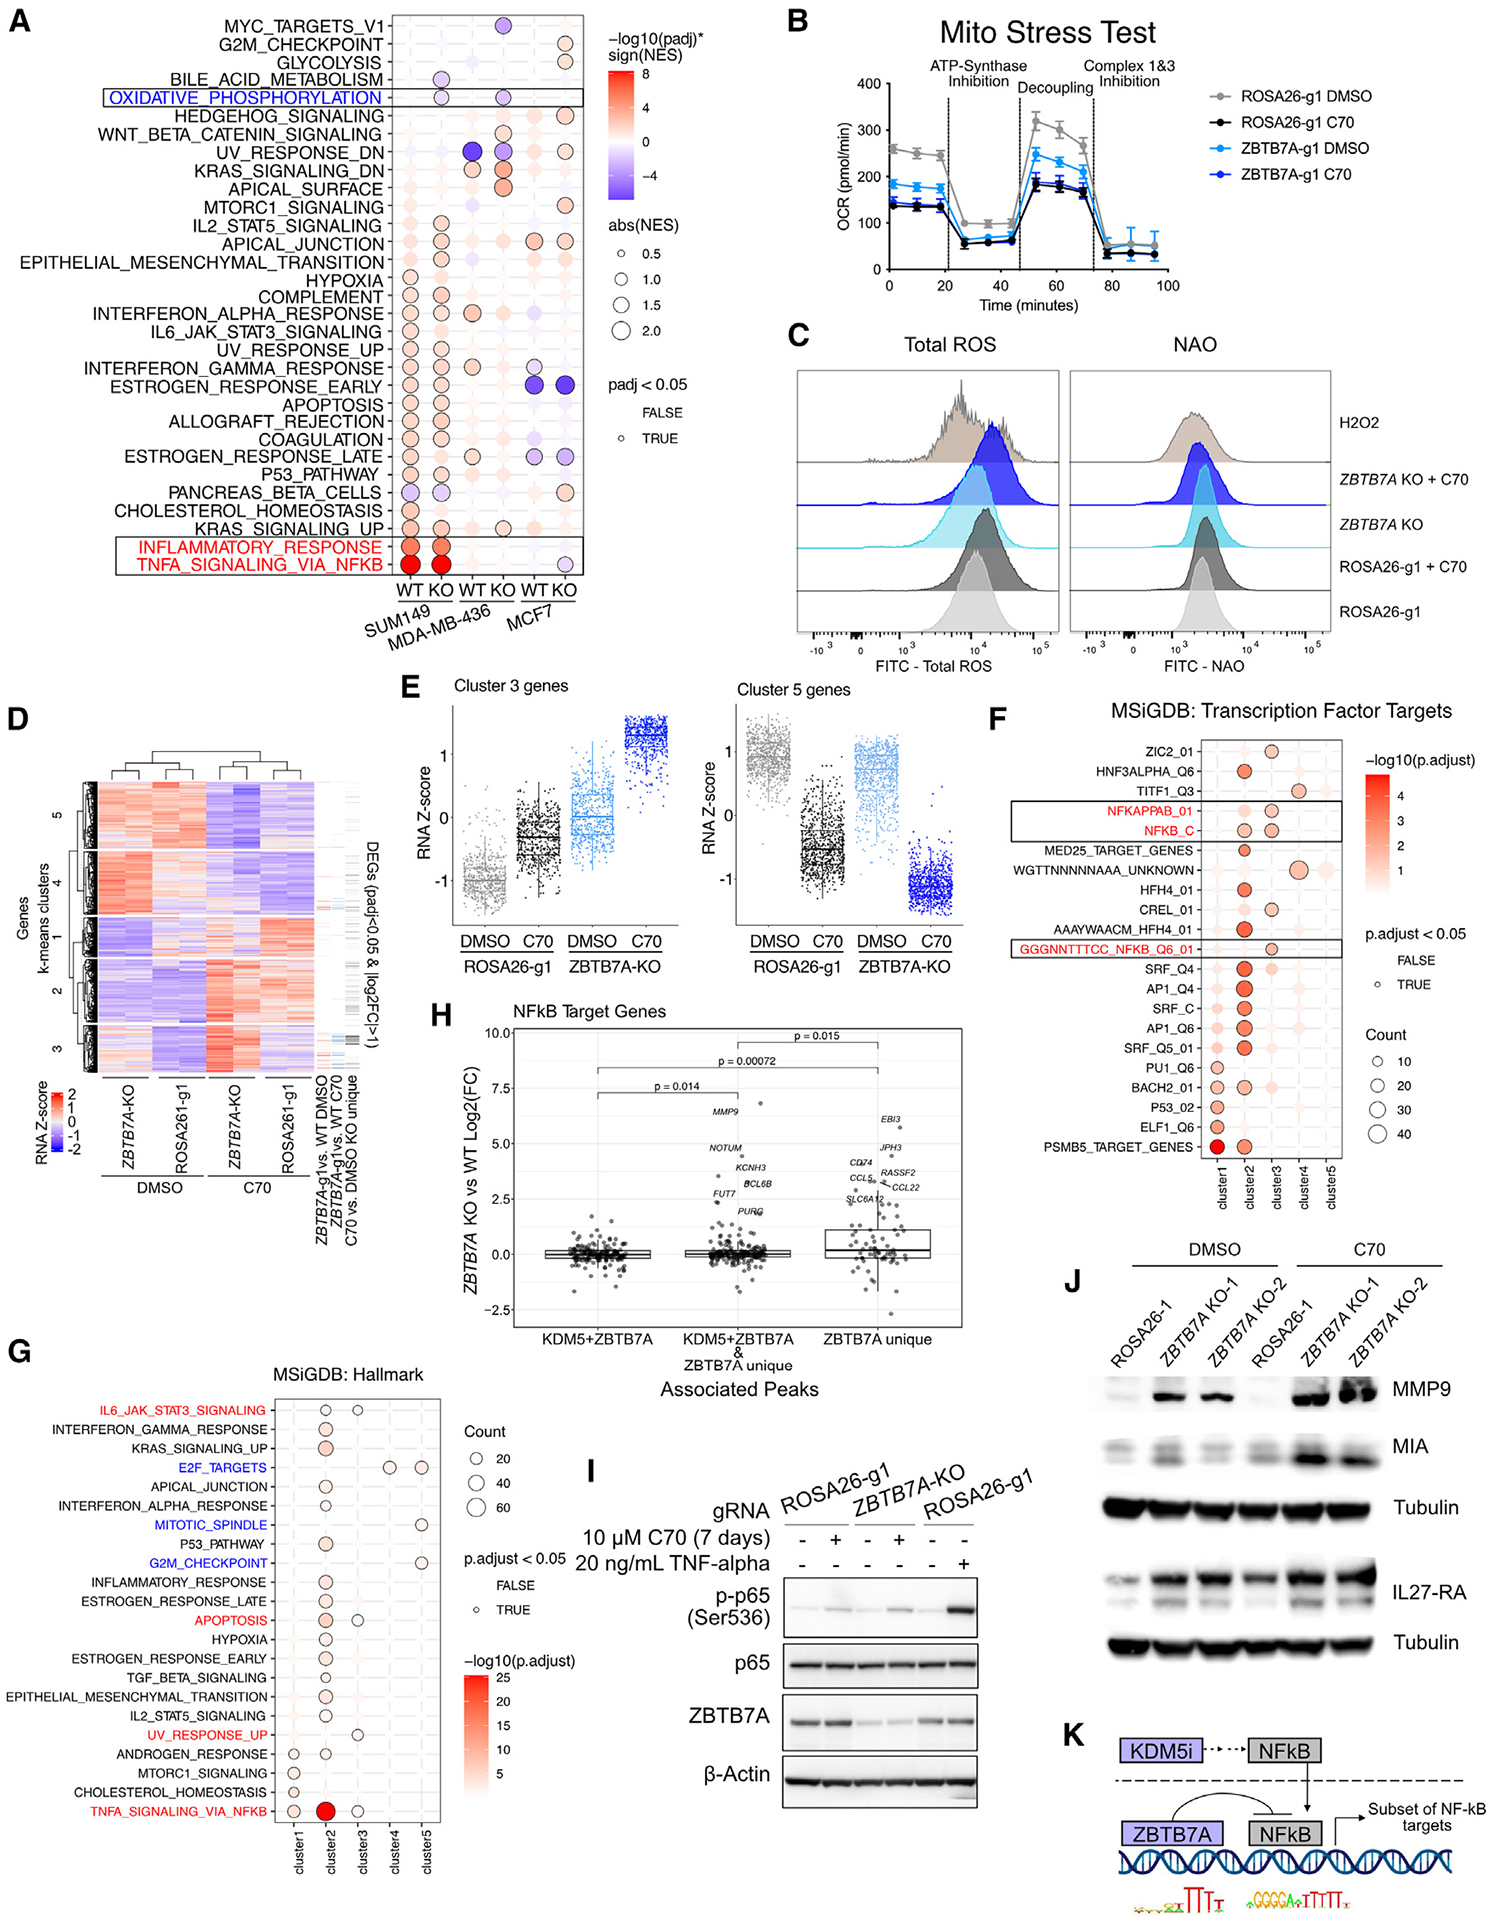
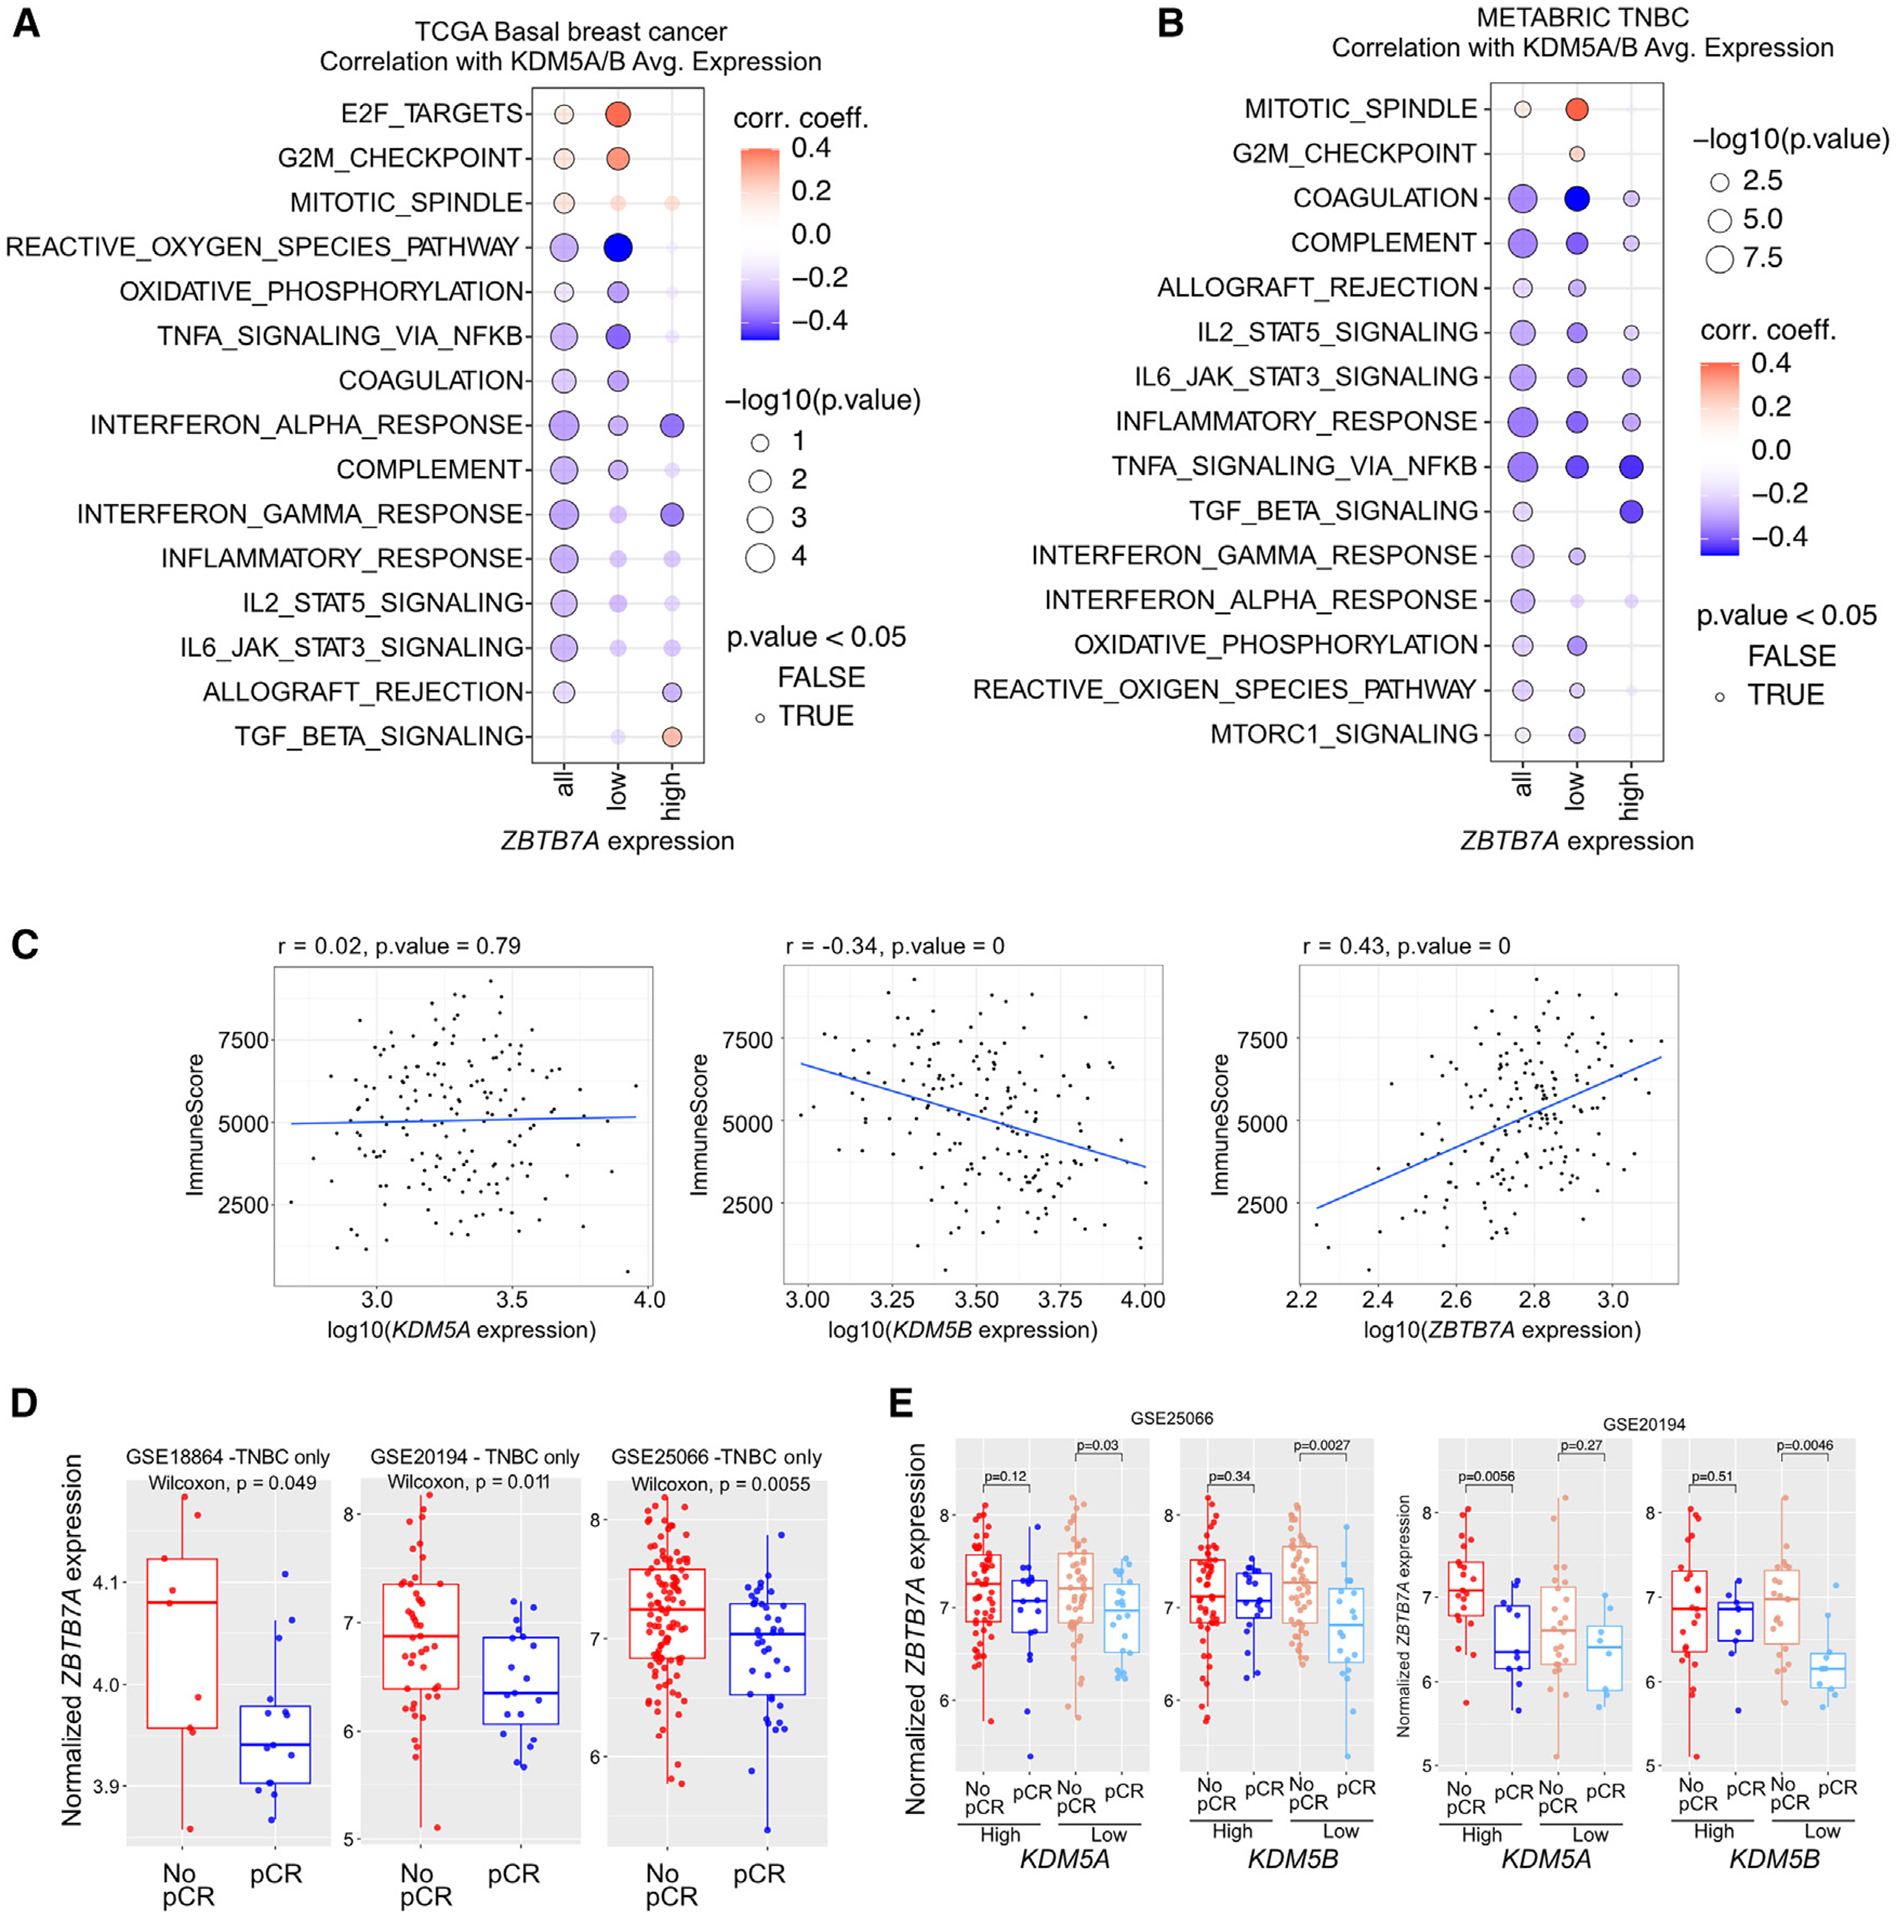
We previously described that the KDM5B histone H3 lysine 4 demethylase is an oncogene in estrogen-receptor-positive breast cancer. Here, we report that KDM5A is amplified and overexpressed in basal breast tumors, and KDM5 inhibition (KDM5i) suppresses the growth of KDM5-amplified breast cancer cell lines. Using CRISPR knockout screens in a basal breast cancer cell line with or without KDM5i, we found that deletion of the ZBTB7A transcription factor and core SAGA complex sensitizes cells to KDM5i, whereas deletion of RHO-GTPases leads to resistance. Chromatin immunoprecipitation sequencing (ChIP-seq) and RNA sequencing (RNA-seq) revealed co-localization of ZBTB7A and KDM5A/B at promoters with high histone H3K4me3 and dependence of KDM5A chromatin binding on ZBTB7A. ZBTB7A knockout altered the transcriptional response to KDM5i at NF-κB targets and mitochondrion-related pathways. High expression of ZBTB7A in triple-negative breast cancer is significantly associated with poor response to neoadjuvant chemotherapy. Our work furthers the understanding of KDM5-mediated gene regulation and identifies mediators of sensitivity to KDM5i.

Keywords: CP: Cancer; CRISPR screen; breast cancer; histone demethylase; mitochondrial signaling.


Conflict of interest statement

Declaration of interests K.P. serves on the scientific advisory boards of Ideaya Biosciences and Scorpion Therapeutics, holds equity options in Scorpion Therapeutics and Ideaya Biosciences, and receives sponsored research funding from Novartis, where she also consults. H.W.L. receives research funding from Novartis.

Figures

Figure 1.
Figure 1.. Characterization of the SUM149CR cell line
(A) Viability of SUM149 and SUM149CR cells after 7 days of treatment across C70 concentrations. p = t test comparing area under the curve. Data are the mean ± standard deviation (n = 6). (B) Gene Set Enrichment Analysis (GSEA) comparing RNA-seq profiles of SUM149CR and SUM149 cells. (C) Oxygen consumption rate (OCR) in SUM149 and SUM149CR cells ± pre-treatment with 10 μM C70 for 6 days; plot (left) and bar graph depicting quantification of differences (right). Values are the mean ± standard deviation. n = 3 for all conditions. One-way ANOVA with multiple comparison within either DMSO- or C70-treated groups for each respiration phase test was used. (D) GSEA comparing RNA-seq profiles of SUM149 ± 10 μM C70 and SU149CR ± 10 μM C70. Top 10 most significant gene sets from each database are shown. (E) Heatmap of normalized peptide intensities from mass spectrometry analysis of histone modifications in SUM149 and SUM149CR ± 10 μM C70 treatment for 48 h. Lysine residues that can be methylated are shown. Peptide intensities were normalized to the DMSO control within each cell line, in which there were three processing replicates. (F) Boxplot depicting quantification of H3K4me3 peptide intensities. The p values are based on the t test. (G) Uniform Manifold Approximation and Projection (UMAP) of scRNA-seq in SUM149 and SUM149CR ± 10 μM C70 for 7 days. (H) Hexagonal plots showing classification of single cells as parental (black), parental C70-treated (C70; teal), or C70-resistant (SUM149CR; red) populations. (I) Boxplot showing transcriptomic cell-to-cell Euclidean distance from PCA dimension reduction in the indicated groups. Mann Whitney U test was used. (J) Dot plot illustrating the enrichment of hallmark pathways in the top 200 genes with increased Gini index in the indicated groups. Pathways with false discovery rate (FDR) < 0.05 in at least one groups are selected.
Figure 2.
Figure 2.. CRISPR screen results and validation
(A) Rank plots of CRISPR KO viability screens in SUM149 and SUM149CR cells after 10 doublings ± 10 μM C70. Genes are ranked based on the computed RRA score from MaGECK RRA, which indicates the essentiality of each gene. Positive RRA scores indicate enriched in C70. Negative RRA scores indicate enriched in DMSO. Differentially enriched hits (p < 0.001) are marked in blue and red for DMSO-enriched and C70-enriched hits, respectively. (B) Comparison of CRISPR hits with p < 0.001 in either the SUM149 or the SUM149CR CRISPR screens ± C70. (C and D) GSEA on RRA-ranked CRISPR screen results in SUM149. Top 10 most significant gene sets with padj < 0.05 from the indicated databases (C) and CORUM protein complexes (D) are shown. (E) Cell growth assays of SUM149 cells expressing constitutive Cas9 and guide RNAs (gRNAs) targeting ZBTB7A, RHOA, PKN2, or non-targeting controls. gRNAs with more efficient KO efficiency are marked with an asterisk (see also Figure S2L). Data are the mean ± standard deviation (n = 4, controls are merged ROSA26 and NonTargeting cells with n = 4 each). (F) Bar plot depicting quantification of ratios in viable cell numbers upon DMSO vs. C70 treatment at day 6. Data are the mean ± standard deviation, one-way ANOVA followed by Dunnett’s multiple comparisons test comparing to control group only (n = 4, controls are merged ROSA26 and cells expressing non-targeting gRNAs with n = 4 each). See also Figure S2.
Figure 3.
Figure 3.. ZBTB7A and KDM5A/B interact and co-localize on DNA with high H3K4me3 levels
(A) Immunoblot analysis of ZBTB7A, KDM5A, and KDM5B in total cell lysates (input), control IgG, and the indicated immunoprecipitants in SUM149 cells. (B) Heatmap of ChIP-seq for ZBTB7A, KDM5A, KDM5B, and H3K4me3. Peaks are clustered based on the intersection of peak calls among the three proteins. (C) Venn diagram illustrating overlap of ChIP-seq peaks. (D) Example ChIP-seq bigwig tracks with the hg19 genome as a reference. (E) Genomic feature distribution of peaks within clusters. (F) MA plots showing differential peak enrichment for the indicated proteins (columns) after the indicated perturbations (rows). Each perturbation is compared to SUM149-ROSA26-g1 in DMSO. Differential peaks are indicated in red (padj < 0.05; default output from CoBRA (Containerized Bioinformatics Workflow for Reproducible ChIP/ATAC-seq Analysis) using the Wald test from DEseq2). The y axis shows log fold change; x axis shows mean of normalized counts. (G) Venn diagrams showing overlap between KDM5A down and H3K4me3 up peaks in ZBTB7A KO cells. The intersect of these peaks is then compared with H3K4me3 up peaks in KDM5A KO cells. (H–J) Overlap of the top 500 predicted target genes of KDM5A down/unchanged peaks in the ZBTB7A KO with the described gene sets. (H) Hallmark pathways, (I) consensus target genes for transcription factors present in ENCODE and ChEA, (J) position weight matrices from TRANSFAC and JASPAR at the gene promoters. The top 500 target genes were identified via the regulatory potential score from BETA. (K) Overlap of the entire set of KDM5A down/unchanged peaks in the ZBTB7A KO with public ChIP-seq tracks available on CISTROME. The top 10–11 enriched transcription factors are shown ranked by GIGGLE score (−log10(p) * odds ratio). See also Figure S3.
Figure 4.
Figure 4.. Gene expression changes induced by ZBTB7A-KO and its associations with ZBTB7A and KDM5A/B peak sets
(A) Heatmap of RNA-seq in SUM149 cells expressing the indicated gRNAs treated with DMSO or 10 μM C70 for 7 days. Rows and columns are ordered based on hierarchical clustering. Values are row-normalized Z scores. (B) Number of DEGs for KOs in SUM149 cells compared to the ROSA26-g1 control. (C) Volcano plot of RNA-seq in the SUM149 KDM5A KO compared to the ROSA26-g1 control. Dashed gray lines indicate adjusted p value (padj) and fold change (FC) cutoff used for (B). (D) Output from BETA testing for association between the indicated peak sets and the up-/downregulated genes upon ZBTB7A KO. For promoter-enriched peaks, the distance from the transcription start site (TSS) for within which peaks were considered to contribute to the gene regulatory potential score was set to 3 kb. For non-promoter-enriched peak sets, the default parameter of 100 kb was used. (E) Volcano plot comparing DEGs and decreased KDM5A peak enrichment in the ZBTB7A KO cells. Only significant DEGs are shown (padj < 0.05 and |log2(FC)| > 1). The p values are based on BETA, indicating if the differential peak set is significantly associated with up- or downregulated genes. Nearest genes to each peak are annotated. (F and G) Overlap of the predicted target genes for each peak set with (F) CISTROME LISA transcription factor motifs (top 5 motifs per cluster are shown) and (G) Hallmark gene sets. Genes with a rank product score <0.001 from the BETA output were used as predicted target genes for each peak set. See also Figure S4.
Figure 5.
Figure 5.. Effects of ZBTB7A KO on transcriptional response to KDM5 inhibition
(A) GSEA on genes ranked by log2(FC) for ±10 μM C70 for 7 days. The analysis was performed in all three cell lines with wild-type (i.e., ROSA26-g1) or ZBTB7A KO. (B) Oxygen consumption rate (OCR) in ROSA26-g1 and ZBTB7A KO SUM149 cells ± pre-treatment with 10 μM C70 for 6 days. Values are the mean ± standard deviation. N = 5 for all conditions except ZBTB7A KO + C70, which had one outlier well removed (N = 4). (C) Ridge plot depicting flow cytometry for total ROS detection with the Total Reactive Oxygen Species (ROS) Assay Kit and for mitochondrial cardiolipins with nonyl acridine orange (NAO). SUM149 cells were treated with or without 10 μM C70 for 5 days. One millimolar H2O2 (7 h for ROS and 2 h for NAO) was used as a positive control. (D) Heatmap of DEGs upon C70 treatment in either SUM149 ROSA26-g1 or ZBTB7A-g1 (padj < 0.05). Genes are ordered based on k-means clustering (k = 5) and samples are ordered based on hierarchical clustering. (E) RNA Z scores of cluster 3 and 5 genes from (D). Box plots represent mean, first and third quantile, and min and max values. (F and G) Overrepresentation analysis for (F) MSigDB transcription factor targets and (G) MSigDB Hallmark pathways within each gene cluster specified by (D). (H) Plot of NF-κB target genes associated with KDM5 + ZBTB7A peaks, ZBTB7A unique peaks, or both (KDM5 + ZBTB7A and ZBTB7A unique). Target genes were defined by the union of MSigDB transcription factor target gene sets (GGGNNTTTCC_NFKB_Q6_01, NFKAPPAB_01, NFKAPPAB65_01, NFKB_C, NFKB_Q6_01, and NFKB_Q6). The p value was determined by the t test. Box plots represent mean, first and third quantile, and min and max values. (I) Immunoblot for phospho-NF-κB p65 (Ser536) in SUM149 ROSA26-g1 and ZBTB7A KO cells ± 10 μM C70 for 7 days. Cells treated with 20 ng/mL TNF-α for 5 min were used as positive control. Image is the left side part of a larger blot with additional lanes. (J) Immunoblot for NF-κB targets MMP9, MIA, and IL-27-RA in SUM149 ROSA26-g1 or ZBTB7A KO cell lines ± 10 μM C70 for 6 days. Tubulin was used as loading control. (K) Diagram of proposed interaction between ZBTB7A and KDM5 inhibition on NF-κB signaling. See also Figures S4 and S5.
Figure 6.
Figure 6.. Associations between ZBTB7A and KDM5 expression and tumor features in patient samples
(A and B) Correlation between KDM5A/B expression and select pathways across basal tumors from TCGA (A) and TNBC samples from METABRIC (B). Correlation coefficients and −log10(p) are plotted. The samples were subset into high and low ZBTB7A expression based on upper and lower tertiles. (C) Correlation between KDM5A, KDM5B, and ZBTB7A expression with estimated immune infiltration scores from bulk RNA-seq data. Data are from basal tumors in TCGA. Immune scores were calculated from bulk RNA-seq via “Estimation of Stromal and Immune cells in Malignant Tumors Using Expression Data” (ESTIMATE). (D) Boxplots depicting the expression of ZBTB7A in TNBC from patients with pCR or no pCR from the indicated cohorts. Box plots represent mean, first and third quantile, and min and max values. Mann-Whitney U test was used. (E) Boxplots depicting the expression of ZBTB7A in breast tumors from patients with pCR or no pCR from the indicated cohorts and divided based on the expression levels of KDM5A or KDM5B. Box plots represent mean, first and third quantile, and min and max values. Mann-Whitney U test was used.

References

    1. Feinberg AP, Koldobskiy MA, and Göndör A (2016). Epigenetic modulators, modifiers and mediators in cancer aetiology and progression. Nat. Rev. Genet 17, 284–299. 10.1038/nrg.2016.13. - DOI - PMC - PubMed
    1. Flavahan WA, Gaskell E, and Bernstein BE (2017). Epigenetic plasticity and the hallmarks of cancer. Science 357, eaal2380. 10.1126/science.aal2380. - DOI - PMC - PubMed
    1. Shen C, and Vakoc CR (2015). Gain-of-function mutation of chromatin regulators as a tumorigenic mechanism and an opportunity for therapeutic intervention. Curr. Opin. Oncol 27, 57–63. 10.1097/CCO.0000000000000151. - DOI - PMC - PubMed
    1. Hinohara K, and Polyak K (2019). Intratumoral Heterogeneity: More Than Just Mutations. Trends Cell Biol. 29, 569–579. 10.1016/j.tcb.2019.03.003. - DOI - PMC - PubMed
    1. Yuan S, Norgard RJ, and Stanger BZ (2019). Cellular Plasticity in Cancer. Cancer Discov. 9, 837–851. 10.1158/2159-8290.CD-19-0015. - DOI - PMC - PubMed

Publication types

MeSH terms

Associated data