. 2025 Feb 1;85(3):602-617.
doi: 10.1158/0008-5472.CAN-24-0821.

Multiomics Analysis Reveals Molecular Changes during Early Progression of Precancerous Lesions to Lung Adenocarcinoma in Never-Smokers

Affiliations

Multiomics Analysis Reveals Molecular Changes during Early Progression of Precancerous Lesions to Lung Adenocarcinoma in Never-Smokers

Yun-Ching Chen et al. Cancer Res. .

Abstract

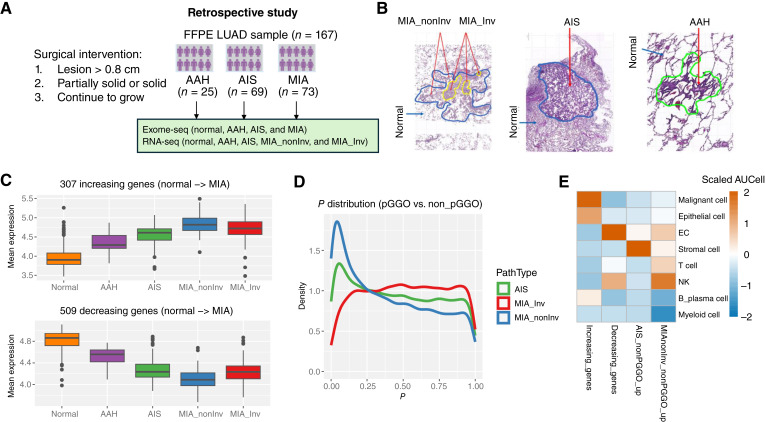
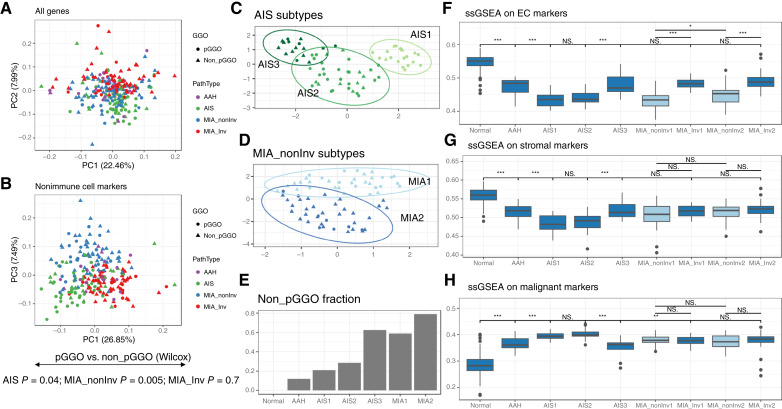
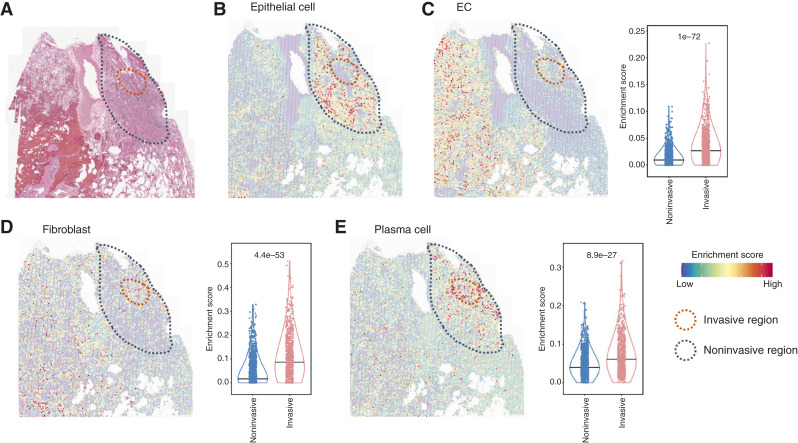
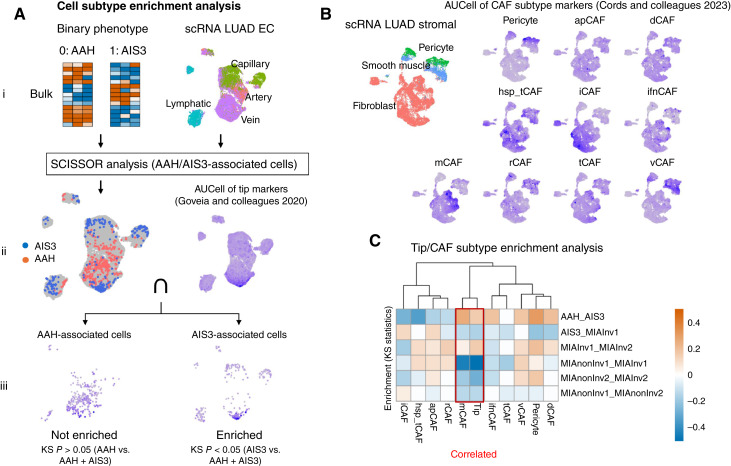
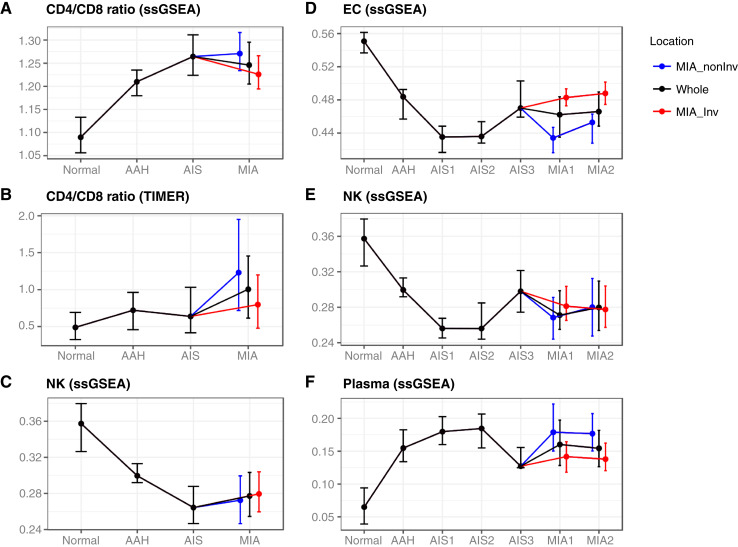
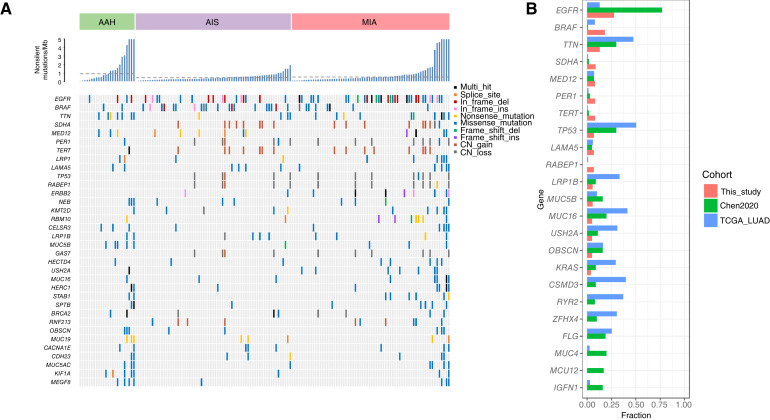
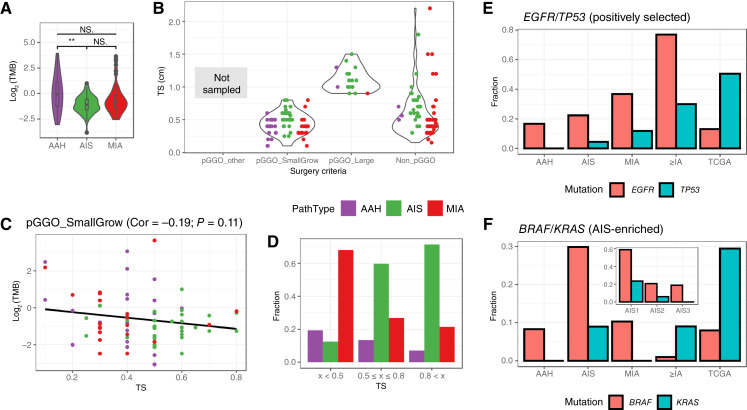
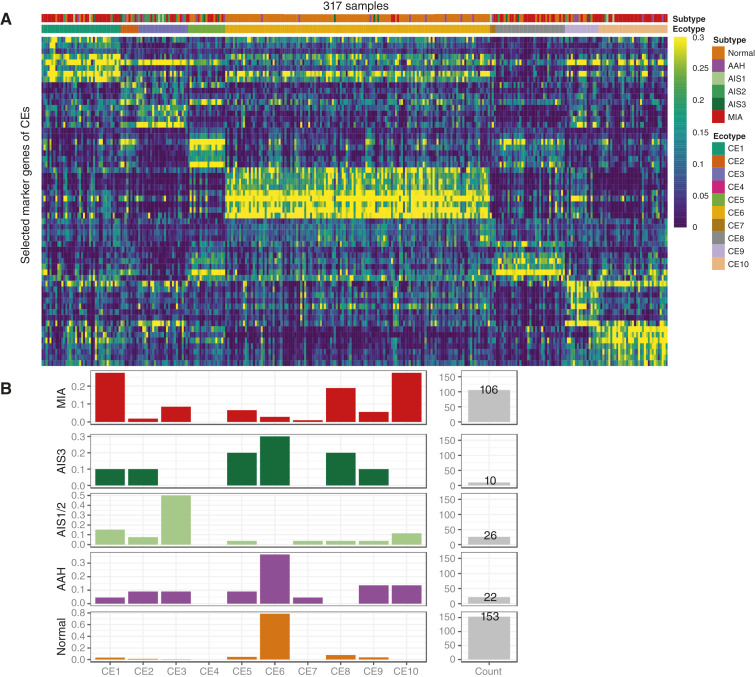
Lung cancer is the most common cause of cancer mortality globally, and the prevalence of lung adenocarcinoma, the most common lung cancer subtype, has increased sharply in East Asia. Early diagnosis leads to better survival rates, but this requires an improved understanding of the molecular changes during early tumorigenesis, particularly in nonsmokers. In this study, we performed whole-exome sequencing and RNA sequencing of samples from 94 East Asian patients with precancerous lesions [25 with atypical adenomatous hyperplasia (AAH); 69 with adenocarcinoma in situ (AIS)] and 73 patients with early invasive lesions [minimally invasive adenocarcinoma (MIA)]. Cellular analysis revealed that the activities of endothelial and stromal cells could be used to categorize tumors into molecular subtypes within pathologically defined types of lesions. The subtypes were linked with the radiologically defined type of lesions and corresponded to immune cell infiltration throughout the early progression of lung adenocarcinoma. Spatial transcriptomic analysis revealed the distribution of epithelial cells, endothelial cells, fibroblasts, and plasma cells within MIA samples. Characterization of the molecular lesion subtypes identified positively selected mutational patterns and suggested that angiogenesis in the late-stage AIS type potentially contributes to tissue invasion of the MIA type. This study offers a resource that may help improve early diagnosis and patient prognosis, and the findings suggest possible approaches for early disease interception. Significance: Integrative analysis of multiomics data revealed coordination between immune and nonimmune cells during early progression of precancerous lesions to lung adenocarcinomas and shed light on the molecular characteristics of clinically defined subtypes.


Conflict of interest statement

Y.-C. Chen reports current employment with Johnson & Johnson, as well as holding shares in the company. H.-M. Wang reports employment with Johnson & Johnson at the time of analysis. M. Pirooznia reports current employment with Johnson & Johnson, as well as holding shares in the company. R. Yang reports other support from Johnson & Johnson outside the submitted work. J.-Y. Shih reports grants from National Science and Technology Council during the conduct of the study, as well as grants from Roche and personal fees from AbbVie, ACT Genomics, Amgen, AstraZeneca, Bayer, Boehringer Ingelheim, Bristol Myers Squibb, Chugai Pharmaceutical, Daiichi Sankyo, Eli Lilly and Company, Guardant Health, Illumina, Janssen, Lotus, Merck Sharp & Dohme, Merck, Ono Pharmaceutical, Orient EuroPharma, Pfizer, Roche, Takeda, TSH Biopharm, and TTY Biopharm outside the submitted work. No disclosures were reported by the other authors.

Figures

Figure 1.
Figure 1.
Overview of study methods and analysis of differential expression of genes from bulk RNA-seq samples. A, Overview of the cohort and methods of analysis. B, Morphology-based clinicopathologic staging and tissue-based pathologic staging. LUAD, lung adenocarcinoma. C, Mean expression of genes in which expression increased (top) or decreased (bottom) during lung adenocarcinoma progression. D, Distributions of P values for all genes in the comparison of pGGO with non-pGGO for the AIS, MIA_ nonInv, and MIA_Inv types. E, Mean expression scores (AUCell scores) of differentially expressed genes (from C and D) for each major cell type in the scRNA-seq data from Sinjab and colleagues (28).
Figure 2.
Figure 2.
Use of nonimmune cell markers to explain pathologic types and classify samples into GGO-associated subtypes. A and B, PCA of all genes (A) and nonimmune cell markers (B). The two-sided Wilcoxon rank-sum test was used to test the association between PC1 and the radiological types for AIS, MIA_ nonInv, and MIA_Inv in B. C, AIS subtypes identified by clustering using nonimmune cell markers. D, MIA_nonInv subtypes identified by clustering using nonimmune cell markers. E, Fraction of non-pGGO samples within each subtype. F–H, Distribution of EC ssGSEA scores based on EC markers, stromal markers, and malignancy markers according to subtype. Statistical significance was determined from a two-sided Wilcoxon rank-sum test. *, P < 0.05; **, P < 0.01; ***, P < 0.001; NS, not significant.
Figure 3.
Figure 3.
Distribution of epithelial cells, ECs, fibroblasts, and plasma cells based on spatial transcriptomic analysis of an MIA sample. A, The tumor region (black dots) was annotated by the pathologist based on hematoxylin and eosin staining. Within the tumor, the area marked by red dots represents the invasive component (MIA_Inv) and the remaining region is the noninvasive component (MIA_nonInv). B–E, Spatial feature plots show enrichment scores for epithelial cells (B), ECs (C), fibroblasts (D), and plasma cells (E). All enrichment scores were calculated using xCell, and the distributions of enrichment scores for spots from the invasive and noninvasive components were compared using the Wilcoxon rank-sum test.
Figure 4.
Figure 4.
Enrichment of cell subtypes from scRNA-seq data for two groups of bulk samples using SCISSOR. A, Three steps used for enrichment of tip ECs in the AAH and AIS3 types: (i) AAH and AIS3 samples and the EC population from scRNA-seq were used to compute AAH- and AIS3-associated ECs using SCISSOR; (ii) tip EC scores were calculated for AAH- and AIS3-associated ECs; and (iii) enrichment of tip ECs in AAH or AIS3 was determined by a one-sided Kolmogorov–Smirnov (KS) test to assess the distribution of tip EC scores in the union of AAH-associated and AIS3-associated ECs with AAH-associated ECs (left) and/or AIS3-associated ECs (right). B, Uniform Manifold Approximation and Projection of stromal cells from scRNA-seq data and their CAF subtype scores. apCAF, antigen-presenting CAF; dCAF, dividing CAF; hsp_tCAF, heat-shock protein-high tCAF; iCAF, inflammatory CAF; ifnCAF, interferon-response CAF; LUAD, lung adenocarcinoma; mCAF, matrix CAF; rCAF, reticular-like CAF; tCAF, tumor-like CAF; vCAF, vascuar CAF. C, Enrichment of EC and CAF subtypes between paired bulk sample subtypes (from A).
Figure 5.
Figure 5.
Coordinated variations of ECs and immune cells. Pathologic types or subtypes according to the ratio of CD4 T and CD8 T ssGSEA scores (A), ratio of CD4 T and CD8 T fractions estimated by TIMER (B), NK ssGSEA score (C), EC ssGSEA score (D), NK ssGSEA score (E), and plasma ssGSEA score (F), with symbols indicating medians and the 25th and 75th percentiles.
Figure 6.
Figure 6.
Mutational tracking during clinicopathologic progression of lung adenocarcinoma. A, TMB (top) and somatic mutations (bottom) in different genes (OncoPrint). B, Gene mutation rates of the 10 most mutated genes in this study, the cohort from Chen2020 (a Taiwanese nonsmoking cohort; ref. 19), and the cohort from TCGA. LUAD, lung adenocarcinoma.
Figure 7.
Figure 7.
Relationships of TMB, TS, surgical criteria, pathologic types, and gene mutation rate. A, Log2(TMB) distributions for AAH, AIS, and MIA. B, TS for nodules resected based on different surgical criteria. Non-pGGO, nodules with any solid or partially solid components; pGGO_Large, large pGGO nodules (>0.8 cm); pGGO_SmallGrow, pGGO nodules that are small (<0.8 cm) but enlarged during follow-up; pGGO_other, other pGGO nodules not collected in this study. C, Pearson correlation of log2(TMB) and TS within the pGGO_SmallGrow group (from B). D, Fractions of nodules of different pathologic types in different size groups. E and F, Fractions of patients with EGFR and TP53 mutations (E) and BRAF and KRAS mutations (F) according to pathologic types and in two separate lung adenocarcinoma cohorts: Chen2020 (a Taiwanese nonsmoking cohort; ref. 19) and TCGA. F, inset, fraction of patients with BRAF and KRAS mutations according to AIS subtypes. **, P < 0.01.
Figure 8.
Figure 8.
Analysis of cell ecosystems by EcoTyper. A, Heatmap of gene expression profiles of CEs in 317 patients based on EcoTyper (50). Rows show the top genes associated with each CE, and columns show the 317 patients ordered by CE. B, Fraction of patients assigned to each CE within each pathologic type/subtype (left) and the number of patients with each type (right).

Similar articles

Cited by

References

    1. Bray F, Ferlay J, Soerjomataram I, Siegel RL, Torre LA, Jemal A. Global cancer statistics 2018: GLOBOCAN estimates of incidence and mortality worldwide for 36 cancers in 185 countries. CA Cancer J Clin 2018;68:394–424. - PubMed
    1. Wu B, Chen J, Zhang X, Feng N, Xiang Z, Wei Y, et al. . Prognostic factors and survival prediction for patients with metastatic lung adenocarcinoma: a population-based study. Medicine (Baltimore) 2022;101:e32217. - PMC - PubMed
    1. Myers DJ, Wallen JM. Lung adenocarcinoma. In: StatPearls. Treasure Island (FL): StatPearls Publishing; 2023. - PubMed
    1. Sakurai H, Maeshima A, Watanabe S-i, Suzuki K, Tsuchiya R, Maeshima AM, et al. . Grade of stromal invasion in small adenocarcinoma of the lung: histopathological minimal invasion and prognosis. Am J Surg Pathol 2004;28:198–206. - PubMed
    1. Noguchi M. Stepwise progression of pulmonary adenocarcinoma–clinical and molecular implications. Cancer Metastasis Rev 2010;29:15–21. - PubMed

MeSH terms

Substances