. 2025 Apr 3;148(4):1242-1257.
doi: 10.1093/brain/awae365.

Lewy pathology formation in patient-derived GBA1 Parkinson's disease midbrain organoids

Affiliations

Lewy pathology formation in patient-derived GBA1 Parkinson's disease midbrain organoids

Emanuele Frattini et al. Brain. .

Abstract

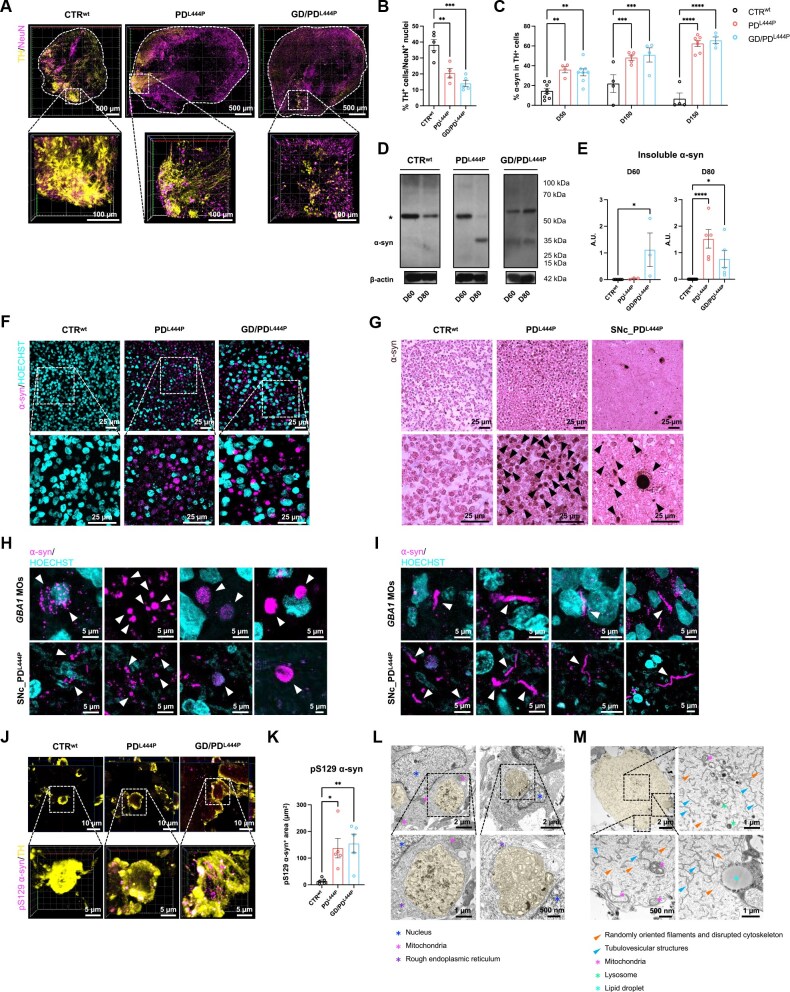
Fibrillary aggregation of α-synuclein in Lewy body inclusions and nigrostriatal dopaminergic neuron degeneration define Parkinson's disease neuropathology. Mutations in GBA1, encoding glucocerebrosidase, are the most frequent genetic risk factor for Parkinson's disease. However, the lack of reliable experimental models able to reproduce key neuropathological signatures has hampered clarification of the link between mutant glucocerebrosidase and Parkinson's disease pathology. Here, we describe an innovative protocol for the generation of human induced pluripotent stem cell-derived midbrain organoids containing dopaminergic neurons with nigral identity that reproduce characteristics of advanced maturation. When applied to patients with GBA1-related Parkinson's disease, this method enabled the differentiation of midbrain organoids recapitulating dopaminergic neuron loss and fundamental features of Lewy pathology observed in human brains, including the generation of α-synuclein fibrillary aggregates with seeding activity that also propagate pathology in healthy control organoids. Concurrently, we found that the retention of mutant glucocerebrosidase in the endoplasmic reticulum and increased levels of its substrate, glucosylceramide, are determinants of α-synuclein aggregation into Lewy body-like inclusions, and the reduction of glucocerebrosidase activity accelerated α-synuclein pathology by promoting fibrillary α-synuclein deposition. Finally, we demonstrated the efficacy of ambroxol and GZ667161 (two modulators of the glucocerebrosidase pathway in clinical development for the treatment of GBA1-related Parkinson's disease) in reducing α-synuclein pathology in this model, supporting the use of midbrain organoids as a relevant preclinical platform for investigational drug screening.

Keywords: GBA1; Lewy bodies; Parkinson’s disease; ambroxol; glucocerebrosidase; midbrain organoids.


Conflict of interest statement

The authors report no competing interests. S.P.S. is an employee and stockholder of Sanofi. He provided the molecule GZ667161 that was tested in midbrain organoids. To avoid potential biases, this author was excluded from experiments and analysis of data concerning use of GZ667161 in midbrain organoids. No research funding was obtained from any company for the present study.

Figures

Figure 1
Figure 1
Midbrain organoids display mature neuromelanin-containing dopaminergic neurons. (A) Schematic overview of the differentiation protocol for the generation of midbrain organoids (MOs). On Day 0 (D0), induced pluripotent stem cells are seeded into ultra-low-attachment plates to allow embryoid body formation (D0–D6). Following neural induction, embryoid bodies are embedded in Cultrex (D10) and cultured in static conditions for another 4 days. On D14, tissues are transferred to spinning bioreactors, where they are subdued to dopaminergic (DA) patterning factors. Trophic factors are added on D27 to aid DA maturation and long-term culturing. (B) Differentiation protocol efficiency measured as quantification of TH+ cells over NeuN+ nuclei in control (CTR1wt) midbrain organoids (MOs) at 65 days in vitro (DIV). n = 4 organoids per condition were analysed by examining whole organoid volume. (C) Representative immunofluorescence images of CTR1wt MOs at 100 DIV showing TH and NeuN expression at different magnifications. Scale bars = 50 µm (right), 100 µm (middle) and 500 µm (left). (DF) Representative immunofluorescence images of neuronal and DA markers (MAP2, TH and GIRK2) expression in CTR1wt MOs at 65 DIV. Arrowheads in F indicate cell bodies of TH+/GIRK2+ DA neurons. In D and E, boxed areas are expanded in the corresponding insets. Scale bars = 25 µm (F), 100 µm (D  right, E  right), 200 µm (D  left) and 500 µm (E  left). (G) Sphingolipid composition of MOs (pool of CTRwt, PDL444P and GD/PDL444P MOs) at early (6 DIV) and mature (65 or 100 DIV) time points. Fully differentiated MOs have a higher content of gangliosides and sphingomyelin enriched in human adult brain. n = 12 organoids for each time point; ****P < 0.0001, Student’s two-tailed unpaired t-test. (H) High magnification images of haematoxylin and eosin (H&E)-stained sections of CTR1wt MOs at 100 DIV demonstrates neuromelanin (NM) in neurons at single-cell resolution (arrowheads). Scale bars = 25 µm. (I) H&E staining (left) and Schmorl’s ferricyanide reduction method (right) in serial sections of CTR2wt (top) and PDL444P (bottom) MOs at 120 DIV highlight the presence of NM pigmentation. Scale bars = 100 µm (bottom) and 500 µm (top). (J) Naturally pigmented NM granules (arrowheads) in TH+ neurons (red) in CTR2wt MOs at 120 DIV. Scale bar = 10 µm. (K) Transmission electron microscopy image of GD/PDL444P MO at 80 DIV showing a membrane-bound (arrowheads) pigmented organelle containing NM granules (dark-coloured pigment) and vacuolar lipid body (asterisk). Scale bar = 1 µm. In B and G, data are mean ± standard error of the mean. ASAC = ascorbic acid; bFGF = basic fibroblast growth factor; cAMP = cyclic AMP; EB = embryoid body; GIRK2 = G-protein-regulated inward-rectifier potassium channel 2; hES = human embryonic stem cell; KSR = KnockOut serum replacement; NeuN = neuronal nuclei; PURM = purmorphamine; SAG = smoothened agonist; SM = sphingomyelin; TH = tyrosine hydroxylase.
Figure 2
Figure 2
GBA1 L444P mutation results in reduced enzyme activity, endoplasmic reticulum retention of mutant glucocerebrosidase and increased levels of glucosylceramide. (A) Glucocerebrosidase (GCase) enzymatic activity in control (CTRwt) midbrain organoids (MOs) at 65 days in vitro (DIV) with and without treatment with 500 µM conduritol B epoxide (CBE) for 14 days. n = 9 organoids; ****P < 0.0001, Student’s two-tailed unpaired t-test. (B) GCase enzymatic activity in CTRwt, Parkinson’s disease heterozygous L444P GBA1 mutation (PDL444P) and Gaucher's disease (GD)/PDL444P MOs at 6, 65, 100 and 150 DIV. n = 3 biological replicates per line for each time point; ****P < 0.0001, two-way ANOVA with Dunnett’s post hoc test. (C) GCase enzymatic activity in substantia nigra pars compacta (SNc)_CTRwt and SNc_PDL444P brain extracts. n = 12 samples; **P < 0.01, Student’s two-tailed unpaired t-test. (D and E) Representative western blots and relative densitometries showing GCase levels in CTRwt, PDL444P and GD/PDL444P MOs at 50, 100 and 150 DIV. n = 33 organoids; ****P < 0.0001, ***P < 0.001, **P < 0.01, *P < 0.05, two-way ANOVA with Dunnett’s post hoc test. (F) Densitometry of GCase/GAPDH amount in brain extracts from patients. n = 9 samples; **P < 0.01, Student’s two-tailed unpaired t-test. (G) Representative images of CTRwt, PDL444P and GD/PDL444P MOs at 100 DIV immunolabelled for GCase, Grp78 and ERp72. Indicated regions are expanded in the insets (bottom). Scale bars = 5 µm (bottom) and 10 µm (top). (H) Quantification of Grp78, Grp78/GCase co-localization and ERp72/GCase co-localization from immunofluorescent images shown in G. n = 3 biological replicates per line; ***P < 0.001, **P < 0.01, *P < 0.05, one-way ANOVA with Tukey’s post hoc test. (I) Densitometry of p-eIF2α/GAPDH amount in CTRwt, PDL444P and GD/PDL444P MOs at 50 and 80 DIV. n = 21 organoids; **P < 0.01, *P < 0.05, two-way ANOVA with Dunnett’s post hoc test. (J and K) Glucosylceramide (GlcCer) levels in CTRwt MOs at 65 DIV following treatment with CBE (J) and in CTRwt, PDL444P and GD/PDL444P MOs at 6, 65, 100 and 150 DIV (K) evaluated by the metabolic labelling at the steady state using radioactive sphingosine. In J: n = 9 organoids; ****P < 0.0001, Student’s two-tailed unpaired t-test; in K: n = 3 biological replicates per line for each time point; ****P < 0.0001, two-way ANOVA with Dunnett’s post hoc test. In AC, E, F and HK, data are mean ± standard error of the mean. A.U. = arbitrary units; UNTR = untreated.
Figure 3
Figure 3
GBA1-Parkinson's disease midbrain organoids reproduce dopaminergic neurodegeneration and Lewy-like pathology. (A and B) Immunofluorescence labelling of TDE-clarified control (CTRwt), Parkinson’s disease heterozygous L444P GBA1 mutation (PDL444P) and Gaucher’s disease (GD)/PDL444P midbrain organoids (MOs) at 100 days in vitro (DIV) and relative 3D confocal microscopy analysis of TH+ and NeuN+ cells showing dopaminergic (DA) neuron loss in GBA1 mutant MOs. A shows orthogonal z-stack projections. n = 14 organoids, with each value in B corresponding to analysis conducted on individual whole organoids; ***P < 0.001, **P < 0.01, one-way ANOVA with Dunnett’s post hoc test. Scale bars = 100 µm (bottom) and 500 µm (top). (C) Analysis of the progressive accumulation of α-synuclein (α-syn) in TH+ neurons in GBA1 mutant MOs from immunostaining shown in Supplementary Fig. 7A. n = 2 organoids of each line were analysed by examining an average of five fields per condition; ****P < 0.0001, ***P < 0.001, **P < 0.01, two-way ANOVA with Tukey’s post hoc test. (D and E) Representative western blots and relative densitometry of detergent-resistant insoluble α-syn fractions in CTRwt, PDL444P and GD/PDL444P MOs at 60 and 80 DIV. Asterisk indicates a non-specific 55 kDa band. n = 3 biological replicates per line at 60 DIV, n = 5 biological replicates per line at 80 DIV; ****P < 0.0001, *P < 0.05, one-way ANOVA with Dunnett’s post hoc test. (F) Representative immunofluorescence images of proteinase K (PK)-resistant insoluble α-syn immunoreactivity in CTRwt, PDL444P and GD/PDL444P MOs at 80 DIV. Scale bars = 25 µm. (G) DAB (3,3′-diaminobenzidine) immunoreactivity of α-syn in Eosin Y-stained CTRwt, PDL444P and GD/PDL444P MOs at 80 DIV and in substantia nigra pars compacta (SNc)_PDL444P following treatment with PK. Arrowheads indicate PK-resistant inclusions of insoluble α-syn. Scale bars = 25 µm. (H and I) High-magnification images of PK-resistant α-syn organization in MOs from subjects carrying L444P GBA1 mutations at 100 DIV and in SNc_PDL444P: heterogeneous morphology of α-syn inclusions might be indicative of various stages of maturation of Lewy body-like aggregates (H) and Lewy neurite-like processes (I) reminiscent of Lewy pathology seen in human brains (arrowheads). Scale bars = 5 µm. (J and K) Immunostaining of α-syn phosphorylated at serine 129 (pS129 α-syn) inclusions in TH+ neurons (J) and quantification of pS129 α-syn+ area (K) in CTRwt, PDL444P and GD/PDL444P MOs at 100 DIV. J shows orthogonal z-stack projections. n = 5 biological replicates per line, with each point representing the mean of three z-stack images for each organoid; **P < 0.01, *P < 0.05, one-way ANOVA with Dunnett’s post hoc test. Scale bars, 5 µm (bottom) and 10 µm (top). (L) Representative transmission electron microscopy (TEM) images of PDL444P (left) and GD/PDL444P (right) MOs at 80 DIV showing large autophagosome/autolysosome-like bodies with inclusions of aggregated intracellular material in the perinuclear region. Cellular organelles are indicated by asterisks and in the corresponding legend. Scale bars = 500 nm (bottom right), 1 µm (bottom left) and 2 µm (top). (M) Representative TEM images of a Lewy-like inclusion in PDL444P MO at 80 DIV. Disrupted cytoskeleton and filaments (orange arrowheads), tubulovesicular structures (blue arrowheads), lipid droplet (aqua asterisk), abundant membrane fragments from mitochondria (pink asterisks) and lysosomes (green asterisks) are visible. Scale bars = 500 nm (bottom left), 1 µm (right) and 2 µm (top left). In B, C, E and K, data are mean ± standard error of the mean. Boxed areas are expanded in the corresponding insets. A.U. = arbitrary units; TDE = 2,2′-thiodiethanol; TH = tyrosine hydroxylase.
Figure 4
Figure 4
Insoluble α-synuclein from GBA1 midbrain organoids induces aggregation of endogenous α-synuclein. (A) Representative immunofluorescence images of α-synuclein (α-syn)+/thioflavin-S (Thio-S)+ aggregates in TH+ neurons in Parkinson’s disease heterozygous L444P GBA1 mutation (PDL444P) and Gaucher's disease (GD)/PDL444P midbrain organoids (MOs) at 100 days in vitro (DIV) and in conduritol B epoxide (CBE)-treated control (CTRwt) MOs. Arrowheads indicate inclusions of fibrillary α-syn with double staining for α-syn and Thio-S. Scale bars = 25 µm. (B) Analysis of the percentage of α-syn in TH+ neurons in CTRwt MOs at 100 DIV following CBE treatment shown in A. n = 3 organoids per condition; ****P < 0.0001, Student’s two-tailed unpaired t-test. (C) Analysis of the overlay area of Thio-S/α-syn in CBE-treated CTRwt MOs at 100 DIV shown in A. n = 3 organoids per condition; ****P < 0.0001, Student’s two-tailed unpaired t-test. (D) Analysis of the overlay area of Thio-S/α-syn in CTRwt, PDL444P and GD/PDL444P MOs at 100 DIV shown in A. n = 14 organoids; ****P < 0.0001, ***P < 0.001, one-way ANOVA with Tukey’s post hoc test. (E) Aggregation kinetics of recombinant α-syn induced by CTRwt, PDL444P and GD/PDL444P MOs at 100 DIV and brain homogenates of the PDL444P patient [substantia nigra pars compacta (SNc)_PDL444P] and one control subject (SNc_CTRwt). (F) Representative immunofluorescence images of α-syn and Thio-S-labelled aggregates in β-3 tubulin (β3TUB)+ neurons in CTR3wt MOs at 100 DIV previously injected with α-syn extracted from PDL444P MOs or CTR1wt MOs at 100 DIV. Arrowheads indicate inclusions of fibrillary α-syn with double staining for α-syn and Thio-S. Boxed areas are expanded in the insets on the right. Scale bars = 25 µm. (G) Analysis of the overlay area of Thio-S/α-syn in CTR3wt MOs following injection of α-syn from data shown in F. n = 4 organoids per condition; **P < 0.01, Student’s two-tailed unpaired t-test. In BE and G, data are mean ± standard error of the mean. A.U. = arbitrary units; SAA = seed amplification assay; UNTR = untreated.
Figure 5
Figure 5
Rescue of glucocerebrosidase pathway and α-synuclein pathology with ambroxol and GZ667161. (AD) Representative western blots and relative densitometry of glucocerebrosidase (GCase) levels in control (CTRwt), Parkinson’s disease with heterozygous L444P GBA1 mutation (PDL444P) and Gaucher's disease (GD)/PDL444P midbrain organoids (MOs) at 100 days in vitro (DIV), with and without treatment with ambroxol (AMBR) (100 μM for 10 days; A and B) or GZ667161 (100 nM for 14 days; C and D), calculated as percentage changes with respect to untreated. n = 4–16 organoids per condition; ****P < 0.0001, **P < 0.01, *P < 0.05, Student’s two-tailed unpaired t-test. (E and F) Glucosylceramide (GlcCer) levels of CTRwt, PDL444P and GD/PDL444P MOs at 100 DIV with and without treatment with AMBR or GZ667161, evaluated by metabolic labelling at the steady state using [1-3H]sphingosine. n = 4 biological replicates per line per condition in E; n = 3–5 biological replicates per line per condition in F; ****P < 0.0001, ***P < 0.001, two-way ANOVA with Tukey’s post hoc test. (G) Co-localization percentage of LAMP1 and GCase in PDL444P and GD/PDL4444P MOs at 100 DIV from immunofluorescence images shown in Supplementary Fig. 10C. n = 3 biological replicates per line; ***P < 0.001, **P < 0.01, *P < 0.05, one-way ANOVA with Dunnett’s post hoc test. (H and I) Representative immunofluorescence images of proteinase K (PK)-resistant insoluble α-synuclein (α-syn) immunoreactivity in CTRwt, PDL444P and GD/PDL444P MOs at 100 DIV with and without treatment with AMBR or GZ667161 (H), and quantification of α-syn aggregates number per field and relative percentage changes in α-syn area with respect to untreated (I). n = 3 organoids for each line were analysed by examining an average of five fields per condition from different sections; ****P < 0.0001, ***P < 0.001, **P < 0.01, *P < 0.05, one-way ANOVA with Dunnett’s post hoc test. Scale bar = 25 µm. In B, DG and I, data are mean ± standard error of the mean. UNTR = untreated.

References

    1. Feigin VL, Nichols E, Alam T, et al. Global, regional, and national burden of neurological disorders, 1990–2016: A systematic analysis for the global burden of disease study 2016. Lancet Neurol. 2019;18:459–480. - PMC - PubMed
    1. GBD 2016 Parkinson's Disease Collaborators. Global, regional, and national burden of Parkinson's disease, 1990–2016: a systematic analysis for the Global Burden of Disease Study 2016 [published correction appears in Lancet Neurol. 2021;20:e7.]. Lancet Neurol. 2018;17:939-953. - PMC - PubMed
    1. Goedert M, Spillantini MG, Del Tredici K, Braak H. 100 years of Lewy pathology. Nat Rev Neurol. 2013;9:13–24. - PubMed
    1. Spillantini MG, Schmidt ML, Lee VM, Trojanowski JQ, Jakes R, Goedert M. α-Synuclein in Lewy bodies. Nature. 1997;388:839–840. - PubMed
    1. Shahmoradian SH, Lewis AJ, Genoud C, et al. Lewy pathology in Parkinson’s disease consists of crowded organelles and lipid membranes. Nat Neurosci. 2019;22:1099–1109. - PubMed

MeSH terms