. 2024 Nov 21;19(11):e0313867.
doi: 10.1371/journal.pone.0313867. eCollection 2024.

Single-cell sequencing reveals transcriptional dynamics regulated by ERα in mouse ovaries

Affiliations

Single-cell sequencing reveals transcriptional dynamics regulated by ERα in mouse ovaries

Qicai Hu et al. PLoS One. .

Abstract

Context: Estrogen receptor α (ERα) is a key regulator of reproductive function, particularly in ovarian development and function, yet the specifics of its role at the molecular level remain unclear.

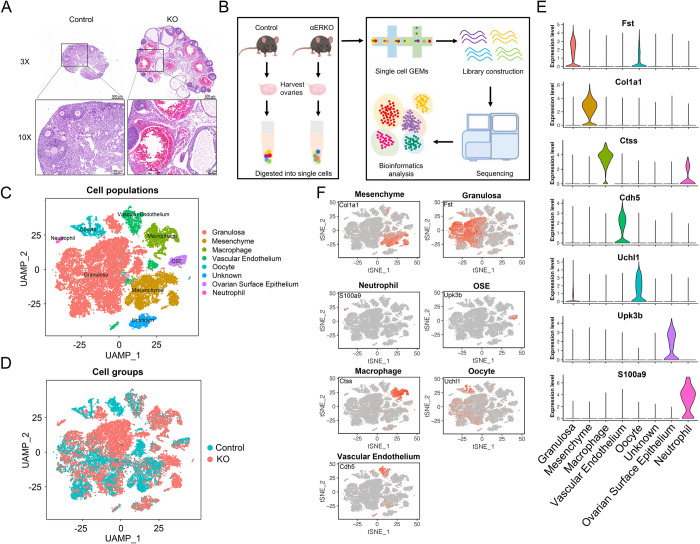
Aims: The study aims to elucidate the molecular mechanisms of ERα-regulated transcriptional dynamics in ovarian cells using ERα knockout (αERKO) mice created via CRISPR/Cas9.

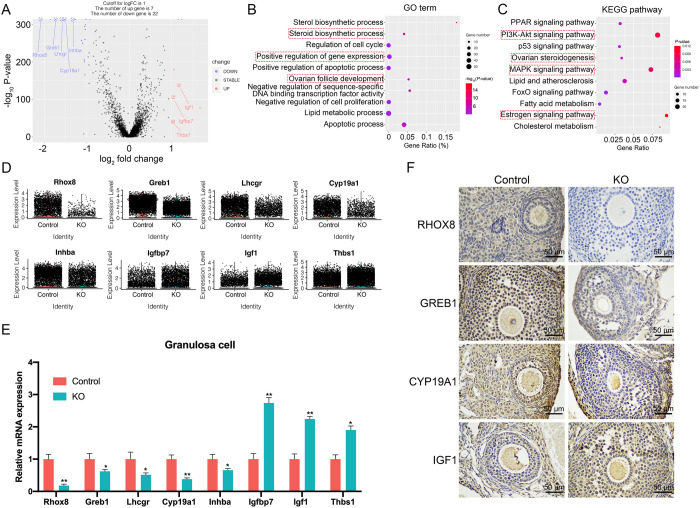
Methods: Single-cell RNA sequencing (scRNA-seq) was used to compare transcriptomes from individual ovarian cells in both wild type and αERKO mice. Bioinformatics analyses identified distinct cell populations and their transcriptional profiles post ERα deletion.

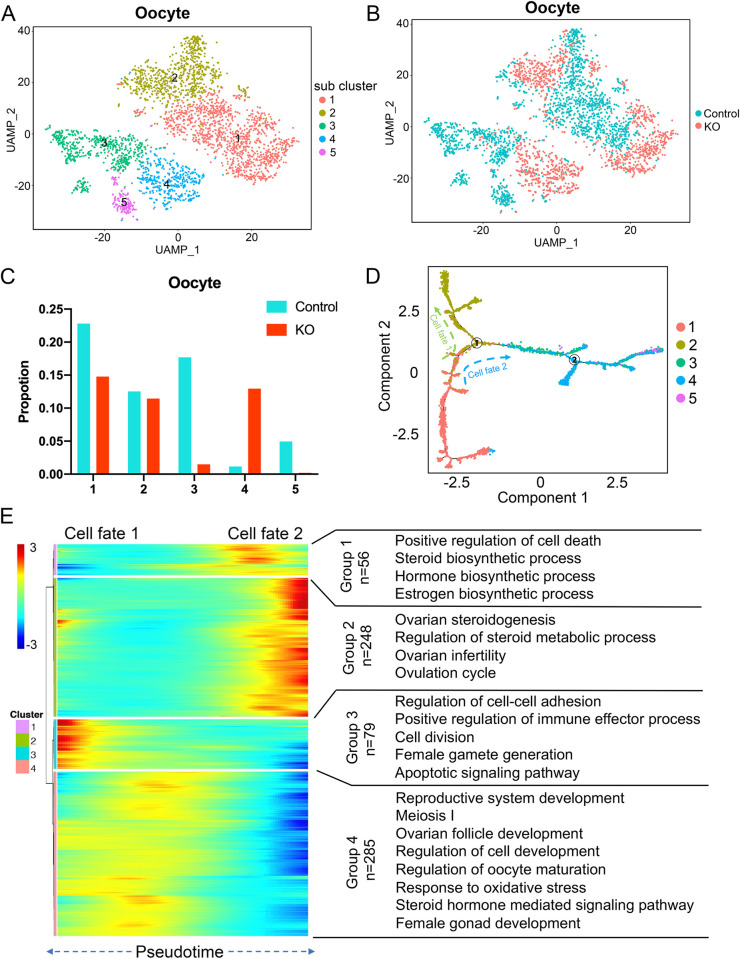
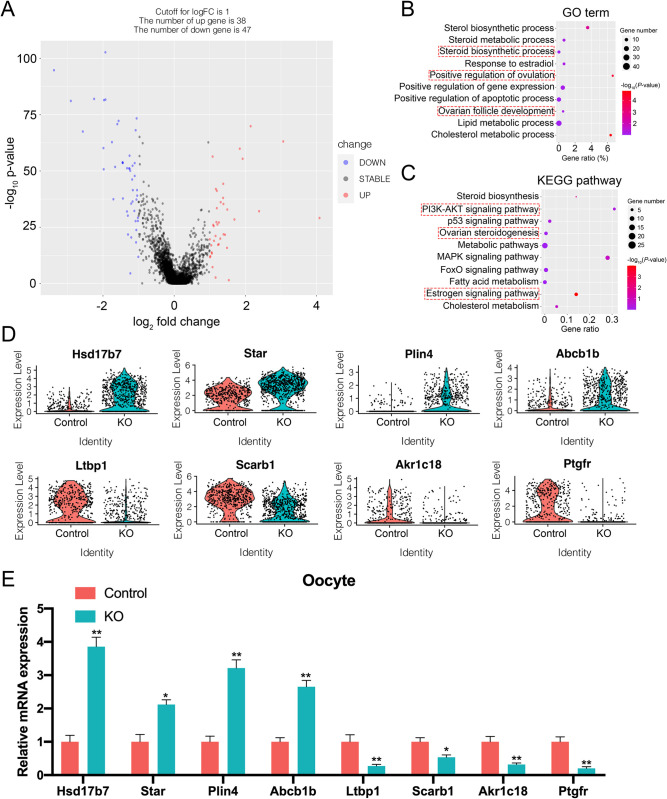
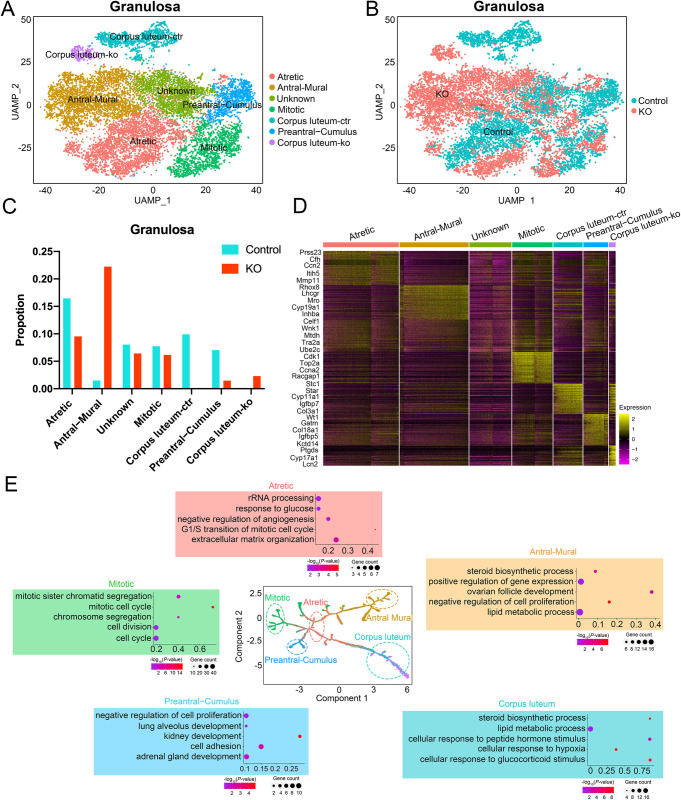
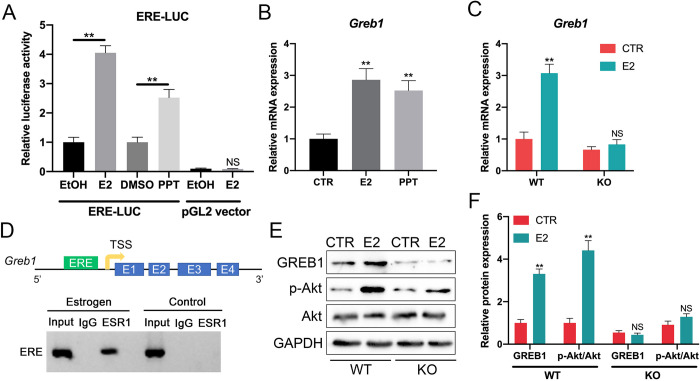
Key results: Distinct oocyte and granulosa cell populations were identified, with ERα deletion disrupting the regulation of genes linked to ovarian infertility, the ovulation cycle, and steroidogenesis. Greb1 expression in granulosa cells was found to be ERα-dependent.

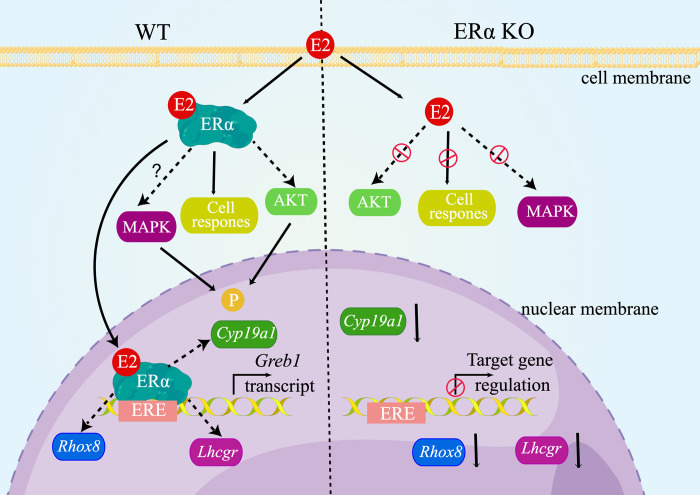
Conclusions: ERα deletion significantly alters the transcriptional landscape of ovarian cells, affecting genes and pathways central to ovarian function and the ovulation process.

Implications: The findings provide an in-depth, single-cell view of ERα's role in the reproductive system, offering insights that may lead to novel treatments for ovarian disorders.


Conflict of interest statement

The authors have declared that no competing interests exist.

Figures

Fig 1
Fig 1. Single-cell RNA sequencing of control and ERα KO mouse ovaries.
(A) Hematoxylin and eosin (H&E)-stained sections of control and ERα KO mice ovaries. (B) Schematic diagram illustrating the experimental pipeline for scRNA-seq analysis of control and ERα KO mice ovaries. Single-cell transcriptomes were obtained based on the 10 × Chromium platform. (C-D) Uniform manifold approximation and projection (UMAP) plot featuring the different clusters of the ovary (C) and their composition by control and KO mice (D). (E) Violin chart showing the expression of specific marker genes in different cell types. (F) Expression of marker genes on UMAP map in different cell types.
Fig 2
Fig 2. Analysis of the heterogeneity of oocyte subsets.
(A) UMAP plot featuring the different cell subclusters belonging to the oocyte cluster. (B) UMAP diagram of the oocyte subpopulations of control and KO groups. (C) Proportion of the five cell subclusters of the oocytes in control and KO groups. (D) Single-cell pseudotime developmental trajectory of oocytes, which are colored according to cell development state. (E) The heatmap shows the gene expression changes of oocytes of four genomes in the two cell fate branches at point 1 (left). GO term enrichment results of the four gene sets (right).
Fig 3
Fig 3. Analysis of DEGs of oocytes between control and KO groups.
(A) Volcano plot of genes differentially expressed in oocytes between control and KO groups. (B) Bubble chart shows the GO enrichment results of differentially expressed genes in oocytes between control and KO groups. (C) KEGG enrichment results of DEGs in oocytes. Bubble chart shows the KEGG enrichment results of differentially expressed genes in oocytes between control and KO groups. (D) Vlnplots of the expression level of representative DEGs in oocytes between control and KO groups. (E) RT-qPCR validation of representative DEGs in oocytes between control and KO groups. *p < 0.05, **p < 0.01.
Fig 4
Fig 4. Identification of the different cell types in the granulosa cluster.
(A) UMAP plot featuring the different cell subclusters belonging to the granulosa cluster. (B) UMAP diagram of the granulosa cell subpopulations of control and KO groups. (C) Proportion of the seven cell subclusters of the granulosa cells in control and KO groups. (D) Heatmap of the top five markers of each subcluster in granulosa cells by fold change. (E) Developmental trajectories of different granulosa cell subclusters in pseudotime. Representative GO terms for stage-specific genes are shown.
Fig 5
Fig 5. Analysis of DEGs of granulosa cells between control and KO groups.
(A) Volcano plot of genes differentially expressed in granulosa cells between control and KO groups. (B) Bubble chart shows the GO enrichment results of differentially expressed genes in granulosa cells between control and KO groups. (C) Bubble chart shows the KEGG enrichment results of differentially expressed genes in granulosa cells between control and KO groups. (D) Vlnplots of the expression level of representative DEGs in granulosa cells between control and KO groups. (E) RT-qPCR validation of representative DEGs in granulosa cells between control and KO groups. (F) IHC validation of representative DEGs in granulosa cells between control and KO groups. *p < 0.05, **p < 0.01.
Fig 6
Fig 6. GREB1 is induced by ERα binding to ERE upstream of the GREB1 promoter.
(A) Relative luciferase activity of ERE-LUC vector or pGL2 vector (backbone) in granulosa cells treated for 24 h with E2 (10 nM), PPT (10 nM) orrelated vehicles (ethanol and DMSO). (B) Relative expression levels of Greb1 mRNA in granulosa cells treated with either control vehicle (CTR), E2 (10 nM) or PPT (10 nM). (C) Relative expression levels of Greb1 mRNA in WT or ERα KO granulosa cells treated for 24 h with either control vehicle (CTR) or E2 (10 nM). (D) Chromatin immunoprecipitation-PCR shows ligand-dependent ESR1 binding to ERE associated with the Greb1 promoter. (E-F) Western blot shows the protein levels of GREB1 and p-AKT in WT or ERα KO granulosa cells treated for 24 h with either control vehicle (CTR) or E2 (10 nM). *p < 0.05, **p < 0.01.
Fig 7
Fig 7. Proposed mechanisms of action of ERα in mouse ovary.

Similar articles

Cited by

References

    1. Cui J, Shen Y, Li R. Estrogen synthesis and signaling pathways during aging: from periphery to brain. Trends Mol Med. 2013;19(3):197–209. Epub 2013/01/26. doi: 10.1016/j.molmed.2012.12.007 ; PubMed Central PMCID: PMC3595330. - DOI - PMC - PubMed
    1. Aranda A, Pascual A. Nuclear hormone receptors and gene expression. Physiol Rev. 2001;81(3):1269–304. Epub 2001/06/28. doi: 10.1152/physrev.2001.81.3.1269 . - DOI - PubMed
    1. Gibson DA, Saunders PT. Estrogen dependent signaling in reproductive tissues—a role for estrogen receptors and estrogen related receptors. Mol Cell Endocrinol. 2012;348(2):361–72. Epub 2011/10/04. doi: 10.1016/j.mce.2011.09.026 . - DOI - PubMed
    1. Hewitt SC, Winuthayanon W, Korach KS. What’s new in estrogen receptor action in the female reproductive tract. J Mol Endocrinol. 2016;56(2):R55–71. Epub 2016/01/31. doi: 10.1530/JME-15-0254 ; PubMed Central PMCID: PMC4733493. - DOI - PMC - PubMed
    1. Germain P, Staels B, Dacquet C, Spedding M, Laudet V. Overview of nomenclature of nuclear receptors. Pharmacol Rev. 2006;58(4):685–704. Epub 2006/11/30. doi: 10.1124/pr.58.4.2 . - DOI - PubMed

Substances

LinkOut - more resources