. 2024 Nov 21;22(11):e3002911.
doi: 10.1371/journal.pbio.3002911. eCollection 2024 Nov.

Turnover of retroelements and satellite DNA drives centromere reorganization over short evolutionary timescales in Drosophila

Affiliations

Turnover of retroelements and satellite DNA drives centromere reorganization over short evolutionary timescales in Drosophila

Cécile Courret et al. PLoS Biol. .

Abstract

Centromeres reside in rapidly evolving, repeat-rich genomic regions, despite their essential function in chromosome segregation. Across organisms, centromeres are rich in selfish genetic elements such as transposable elements and satellite DNAs that can bias their transmission through meiosis. However, these elements still need to cooperate at some level and contribute to, or avoid interfering with, centromere function. To gain insight into the balance between conflict and cooperation at centromeric DNA, we take advantage of the close evolutionary relationships within the Drosophila simulans clade-D. simulans, D. sechellia, and D. mauritiana-and their relative, D. melanogaster. Using chromatin profiling combined with high-resolution fluorescence in situ hybridization on stretched chromatin fibers, we characterize all centromeres across these species. We discovered dramatic centromere reorganization involving recurrent shifts between retroelements and satellite DNAs over short evolutionary timescales. We also reveal the recent origin (<240 Kya) of telocentric chromosomes in D. sechellia, where the X and fourth centromeres now sit on telomere-specific retroelements. Finally, the Y chromosome centromeres, which are the only chromosomes that do not experience female meiosis, do not show dynamic cycling between satDNA and TEs. The patterns of rapid centromere turnover in these species are consistent with genetic conflicts in the female germline and have implications for centromeric DNA function and karyotype evolution. Regardless of the evolutionary forces driving this turnover, the rapid reorganization of centromeric sequences over short evolutionary timescales highlights their potential as hotspots for evolutionary innovation.


Conflict of interest statement

The authors have declared that no competing interests exist.

Figures
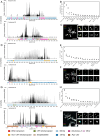
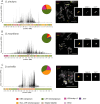
Fig 1
Fig 1. Centromeres of chromosomes 2 and 3 in D. simulans, D. sechellia, and D. mauritiana are predominantly 500-bp satellite.
(A, D, G) CENP-A CUT&Tag enrichment on the centromere candidates for the major autosomes (2 and 3) of D. simulans (A), D. mauritiana (D), and D. sechellia (G). The label “Autosome 2/3” indicates that we cannot distinguish between the second and third chromosome centromeres. The y-axis represents normalized CENP-A enrichment in RPM. Black and gray plotted lines represent the enrichment based on uniquely mapping and all reads (including multi-mappers), respectively. The black and gray tracks below each plot correspond to MACS2 peaks showing significantly enriched regions based on the uniquely mapping and all reads (including multi-mappers), respectively. The precise locations of all peaks are listed in S1 Table. The colored cytoband track at the bottom of the plot shows the repeat organization. The color code is shown in the legend at the bottom of the figure. (B, E, H) Assembly-free analysis showing the normalized enrichment score (in RPM) of CENP-A for complex repeats, including TEs and complex satellites across all centromeres. The Top 20 most enriched repeats are represented for D. simulans (B), D. mauritiana (E), and D. sechellia (H). (C, F, I) IF-FISH on mitotic chromosomes from larval brains with CENP-C antibody and 500-bp and dodeca probes, for D. simulans (C) and D. mauritiana (F) or 500-bp and Rsp-like probes for D. sechellia (I). The insets represent a zoom on each major autosome centromere. Bars represent 5 μm. The data underlying this figure can be found at https://doi.org/10.5061/dryad.1zcrjdg2g [40]. RPM, reads per million; TE, transposable element.
Fig 2
Fig 2. X chromosome centromeres in D. simulans and D. mauritiana are enriched in 500-bp satellite.
The left panel shows the CENP-A CUT&Tag enrichment on the X centromere candidate in D. simulans (A) and D. mauritiana (B). The y-axis represents the normalized CENP-A enrichment in RPM. Black and gray plotted lines represent the enrichment based on uniquely mapping and all reads (including multi-mappers), respectively. The black and gray tracks below each plot correspond to MACS2 peaks showing significantly enriched regions based on the uniquely mapping and all reads (including multi-mappers), respectively. The precise locations of all peaks are listed in S1 Table. The colored cytoband at the bottom of the plot shows the repeat organization. The color code is shown in the legend at the bottom of the figure. The right panel shows IF-FISH on mitotic chromosomes from larval brains with CENP-C antibody and 500-bp and Rsp-like probes. The inset represents a zoom on each X chromosome centromere. Bars represent 5 μm. The data underlying this figure can be found at https://doi.org/10.5061/dryad.1zcrjdg2g [40]. RPM, reads per million.
Fig 3
Fig 3. Dot chromosome centromeres in D. simulans and D. mauritiana are enriched in 365-bp satellite.
The left panel represents the CENP-A CUT&Tag enrichment in D. simulans (A) and D. mauritiana (B). The y-axis represents the normalized CENP-A enrichment in RPM. Black and gray plotted lines represent the enrichment based on uniquely and multi-mapping reads, respectively. Black and gray plotted lines represent the enrichment based on uniquely mapping and all reads (including multi-mappers), respectively. The black and gray tracks below each plot correspond to MACS2 peaks showing significantly enriched regions based on the uniquely mapping and all reads (including multi-mappers), respectively. The precise locations of all peaks are listed in S1 Table. The colored cytoband track at the bottom of the plot shows the repeat organization. The color code is shown in the legend at the bottom of the Fig. The right panel represents the IF-FISH on mitotic chromosomes from the larval brain with CENP-C antibody and 365-bp and AATAT probes. The insets represent a zoom on each dot chromosome centromere. Bars represent 5 μm. The data underlying this figure can be found at https://doi.org/10.5061/dryad.1zcrjdg2g [40]. HTT, Het-A, TART, and TAHRE; RPM, reads per million.
Fig 4
Fig 4. The Dot and X chromosome centromere in D. sechellia are telocentric.
CENP-A CUT&Tag enrichment along the X (A) and dot (B) chromosome centromeres. The y-axis represents the normalized CENP-A enrichment in RPM. Black and gray plotted lines represent the enrichment based on uniquely and multi-mapping reads, respectively. Black and gray plotted lines represent the enrichment based on uniquely mapping and all reads (including multi-mappers), respectively. The black and gray tracks below each plot correspond to MACS2 peaks showing significantly enriched regions based on the uniquely mapping and all reads (including multi-mappers), respectively. The precise locations of all peaks are listed in S1 Table. The colored cytoband track at the bottom of the plot shows the repeat organization. The color code is shown in the legend at the bottom of the figure. (C) IF-FISH on mitotic chromosomes from the larval brain with CENP-C antibody and 500-bp and HTT probes. The inset represents a zoom on the X and dot chromosome centromeres. Bar represents 5 μm. (D) IF-FISH on chromatin fibers from the larval brain with CENP-A antibody and 500-bp and HTT probes, representing the telocentric X chromosome of D. sechellia. Bar represents 5 μm. The data underlying this figure can be found at https://doi.org/10.5061/dryad.1zcrjdg2g [40]. HTT, Het-A, TART, and TAHRE; RPM, reads per million.
Fig 5
Fig 5. The Y chromosome centromeres of D. simulans, D. mauritiana, and D. sechellia are rich in transposable elements.
The left panel shows the CENP-A CUT&Tag enrichment for the Y centromere of D. simulans (A), D.mauritiana (B), and D. sechellia (C). The y-axis represents the normalized CENP-A enrichment in RPM. Black and gray plotted lines represent the enrichment based on uniquely mapping and all reads (including multi-mappers), respectively. The black and gray tracks below each plot correspond to MACS2 peaks showing significantly enriched regions based on the uniquely mapping and all reads (including multi-mappers), respectively. The precise locations of all peaks are listed in S1 Table. The colored cytoband track at the bottom of the plot shows the repeat organization. The pie chart on the top represents the repeat composition of the CENP-A domain. The color code of the cytoband and pie chart is shown in the legend at the bottom of the figure. The right panel shows the IF-FISH on mitotic chromosomes from the larval brain with CENP-C antibody and cenY Oligopaints specific to each species’ centromere. The insets represent a zoom on each Y chromosome centromere. Bar represents 5 μm. The data underlying this figure can be found at https://doi.org/10.5061/dryad.1zcrjdg2g [40]. HTT, Het-A, TART, and TAHRE; RPM, reads per million.
Fig 6
Fig 6. G2/Jockey-3 is associated with the centromeres within the D. simulans clade.
(A) Maximum likelihood phylogenetic tree of G2/Jockey-3 ORF2 from D. melanogaster, D. simulans, D. sechellia, D. mauritiana, D. yakuba, and D. erecta. G2/Jockey-3 within the simulans clade species diverged into 2 different clades, one that is more closely related to the D. melanogaster elements (clade “A”) and one that is more divergent (clade “B”). Centromeric insertions are indicated by a pink * at the tip of the branch. We do not know centromere identity in D. yakuba and D. erecta. (B) ORF2 conservation analyses of the clade “A” G2/Jockey-3 centromere-associated clade. The circles below the species name represent each centromere. Centromeres containing G2/Jockey-3 insertions (based on CUT&Tag and FISH) are shown in black. The pie chart represents the proportion of centromeric (black) and non-centromeric (white) insertions among the clade “A” G2/Jockey-3 within each species’ genome, where we indicate the number of insertions within the pie charts. The consensus sequence of G2/Jockey-3 ORFs is schematized below the pie chart, indicating that only D. melanogaster and D. simulans consensus sequences have an intact ORF2. (C) IF-FISH on mitotic chromosomes from the larval brain with CENP-C antibody and G2/Jockey-3 probes showing consistent centromere-association in D. simulans, but not in D. mauritiana and D. sechellia. In D. simulans, the G2/Jockey-3 insertions on the X chromosome are adjacent to the CENP-A domain, rather than within. The inset represents a zoom on each centromere. Bars represent 5μm. The data underlying this figure can be found at https://doi.org/10.5061/dryad.1zcrjdg2g [40]. ORF, open reading frame.
Fig 7
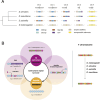
Fig 7. Shifting centromere composition in the D. simulans clade species and D. melanogaster.
(A) Schematic illustration of the centromere structure and composition in the melanogaster clade. Each chromosome’s structure is depicted in gray above each column. Below, we provide a detailed view of the centromeric and pericentromeric regions for each species. The centromere is represented as a circle. Each region is color-coded based on the dominant repeat composition, with the legend at the bottom of the figure explaining the color scheme. (B) An evolutionary model for the centromere sequence turnover in the melanogaster clade species representing the cycling between retroelement-rich and satellite-rich centromeres in the D. melanogaster clade species. Retroelements and satellites may be engaged in their own conflicts and thus indirectly compete to occupy centromeres. Representative examples of specific replacement events in different stages of the conflicts are depicted in the outside circles. For example, while D. melanogaster centromeres are rich in TEs, D. simulans clade centromeres are now primarily occupied by satellite DNA. The satellite-rich centromeres of D. simulans are still targeted by G2/Jockey-3 retroelements and D. sechellia’s X and dot (fourth) chromosome centromeres shifted to the specialized telomeric HTT retroelements. The Y chromosome centromeres do not cycle between retroelements and satellite DNAs in the simulans clade species. Despite satellite DNAs being a major component of these Y chromosomes, their centromeres remain rich in retroelements. We speculate that this is because the dynamic turnover of centromere content is driven by female-specific selection like centromere drive in female meiosis. HTT, Het-A, TART, and TAHRE; TE, transposable element.

Similar articles

Cited by

References

    1. Barra V, Fachinetti D. The dark side of centromeres: types, causes and consequences of structural abnormalities implicating centromeric DNA. Nat Commun. 2018;9:4340. doi: 10.1038/s41467-018-06545-y - DOI - PMC - PubMed
    1. Karpen GH, Allshire RC. The case for epigenetic effects on centromere identity and function. Trends Genet. 1997;13:489–496. doi: 10.1016/s0168-9525(97)01298-5 - DOI - PubMed
    1. Mendiburo MJ, Padeken J, Fülöp S, Schepers A, Heun P. Drosophila CENH3 is sufficient for centromere formation. Science. 2011;334:686–690. doi: 10.1126/science.1206880 - DOI - PubMed
    1. Mellone BG, Fachinetti D. Diverse mechanisms of centromere specification. Curr Biol. 2021;31:R1491–R1504. doi: 10.1016/j.cub.2021.09.083 - DOI - PMC - PubMed
    1. Kasinathan S, Henikoff S. Non-B-Form DNA Is Enriched at Centromeres. Mol Biol Evol. 2018;35:949–962. doi: 10.1093/molbev/msy010 - DOI - PMC - PubMed

LinkOut - more resources