. 2024 Nov 4;16(5):3204-3218.
doi: 10.14336/AD.2024.1094.

Normal Bone Matrix Mineralization but Altered Growth Plate Morphology in the LmnaG609G/G609G Mouse Model of Progeria

Affiliations

Normal Bone Matrix Mineralization but Altered Growth Plate Morphology in the LmnaG609G/G609G Mouse Model of Progeria

Stéphane Blouin et al. Aging Dis. .

Abstract

Hutchison-Gilford progeria syndrome (HGPS) is a rare genetic disease caused by a mutation in LMNA, the gene encoding A-type lamins, leading to premature aging with severely reduced life span. HGPS is characterized by growth deficiency, subcutaneous fat and muscle issues, wrinkled skin, alopecia, and atherosclerosis. Patients also develop a bone phenotype with reduced bone mineral density, osteolysis and striking demineralization of long bones. To further clarify the tissue modifications in HGPS, we characterized bone mineralization in the LmnaG609G/G609G progeria mouse model. Femurs from 8-week-old mice and humeri from 15-week-old mice were analyzed using quantitative backscattered electron imaging to assess bone mineralization density distribution, osteocyte lacunae sections and structural bone histomorphometry. Tissue sections were stained with Giemsa and Goldner trichrome for histologic evaluation. Bone tissue from Lmna+/+ and LmnaG609G/G609G mice had similar mineral content at 3 different bone sites with specific tissue ages. The osteocyte lacunae features were not statistically different, but more empty lacunae were found in LmnaG609G/G609G at both animal ages. Bone histomorphometry and histology demonstrated decreased bone volume per tissue volume in primary (8W: -23%, p=0.001; 15W: -38%, p=0.002) and secondary spongiosa (8W: -36%, p=0.001; 15W: -49 %, ns), as well as growth plate dysplasia with thinner unmineralized resting and proliferative zones in the LmnaG609G/G609G mice versus controls (8W: -18%, p=0.006; 15W: -25%, p=0.001). Overall, the LmnaG609G/G609G mouse develops chondrodysplasia with reduced trabecular bone volume. Mineral content findings at several tissue sites and ages suggest that bone dysplasia results from impaired bone formation with normal bone turnover.


Conflict of interest statement

The authors declare no conflict of interest.

Figures
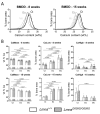
Figure 1.
Figure 1.
Bone matrix mineralization results. (A) Representative Bone Mineralization Density Distribution (BMDD) curves obtained with quantitative back scattered electron imaging on metaphysis (Ms), epiphysis (Es) and cortex (Ct) from Lmna+/+ (solid line) and LmnaG609G/G609G (dashed line) mice. (B) Parameters CaMean, CaLow and CaHigh characterizing the BMDD. Percent calcium content by weight is denoted as wt %Ca. The data are presented as mean ± standard deviation. Significant differences based on post-hoc Tukey’s multiple comparisons tests after two-way ANOVA with site and genotype as factors are indicated. The BMDD and its parameters were obtained on (top) femurs from 8-week-old (20 Lmna+/+, 18 LmnaG609G/G609G) and (bottom) humeri from 15-week- old (7 Lmna+/+,7 LmnaG609G/G609G) mice. Male and female data were pooled. For numerical values, see Suppl. Table 1.
Figure 2.
Figure 2.
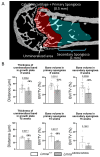
Histomorphometry performed on mineralized tissue. (A) Regions of analysis on an overview image of a femur obtained with qBEI. (B) Thickness of the unmineralized zone representing the resting and proliferative zone of the growth plate and volume fraction (bone volume per tissue volume - BV/TV) in the primary and secondary spongiosa. The data are presented as mean ± standard deviation. Significant differences based on student’s t-tests for unpaired data (or Mann-Whitney tests if normality was not verified) are indicated. The results were obtained on (top) femurs from 8-week-old (19 Lmna+/+, 18 LmnaG609G/G609G) and (bottom) humeri from 15-week-old (7 Lmna+/+,7 LmnaG609G/G609G) mice. Male and female data were pooled.
Figure 3.
Figure 3.
Osteocyte lacunae. (A) qBEI image of a representative femoral cortex with the unmineralized osteocyte lacunae section (OLS) (black) embedded in the mineralized bone tissue. (B) OLS results obtained from such images on femurs from 8-week-old (top) and humeri from 15-week-old (bottom) Lmna+/+ and LmnaG609G/G609G mice. The data are presented as mean ± standard deviation. T-test for unpaired data (or Mann-Whitney tests if normality was not verified) showed no significant differences between groups. (C) Optical image of a section from a paraffin embedded demineralized sample stained with haematoxylin and eosin where empty lacunae (black arrowhead) and filled osteocyte lacunae (white arrowhead) are indicated. (d) Measurement of empty lacunae on femurs from (top) 8-week-old (4 Lmna+/+, 5 LmnaG609G/G609G) and (bottom) 15 week-old (3 Lmna+/+, 3 LmnaG609G/G609G) mice. The data are presented as mean ± standard deviation. Significant differences based on t-test for unpaired data are indicated.
Figure 4.
Figure 4.
Histological sections stained with Goldner’s trichrome showing the growth plate of the humeri of 15 weeks old Lmna+/+ and LmnaG609G/G609G mice. The mineralized bone tissue appears in blue/green, the non-mineralized bone tissue appears in red, the mineralized cartilage appears in light green and the non-mineralized cartilage is not stained. The epiphysis (Es) is located to the left of the growth plate and the metaphysis (Ms) to the right. In both Lmna+/+ and LmnaG609G/G609G mice, a columnar proliferative zone and hypertrophic chondroblasts (cc) can be observed. However, both non mineralized (blue bracket) and mineralized cartilage (red bracket) appear to be thinner in LmnaG609G/G609G mice compared to control. Images size = 354 µm x 265 µm.

References

    1. Hennekam RC (2006). Hutchinson-Gilford progeria syndrome: review of the phenotype. Am J Med Genet A, 140:2603-2624. - PubMed
    1. Ullrich NJ, Gordon LB (2015). Hutchinson-Gilford progeria syndrome. Handb Clin Neurol, 132:249-264. - PubMed
    1. Eriksson M, Brown WT, Gordon LB, Glynn MW, Singer J, Scott L, et al. (2003). Recurrent de novo point mutations in lamin A cause Hutchinson-Gilford progeria syndrome. Nature, 423:293-298. - PMC - PubMed
    1. De Sandre-Giovannoli A, Bernard R, Cau P, Navarro C, Amiel J, Boccaccio I, et al. (2003). Lamin a truncation in Hutchinson-Gilford progeria. Science, 300:2055. - PubMed
    1. Machiels BM, Zorenc AH, Endert JM, Kuijpers HJ, van Eys GJ, Ramaekers FC, et al. (1996). An alternative splicing product of the lamin A/C gene lacks exon 10. J Biol Chem, 271:9249-9253. - PubMed

LinkOut - more resources