. 2025 Jan:51:102202.
doi: 10.1016/j.tranon.2024.102202. Epub 2024 Nov 20.

The 7-Methylguanosine (m7G) methylation METTL1 acts as a potential biomarker of clear cell renal cell carcinoma progression

Affiliations

The 7-Methylguanosine (m7G) methylation METTL1 acts as a potential biomarker of clear cell renal cell carcinoma progression

Yi Liu et al. Transl Oncol. 2025 Jan.

Abstract

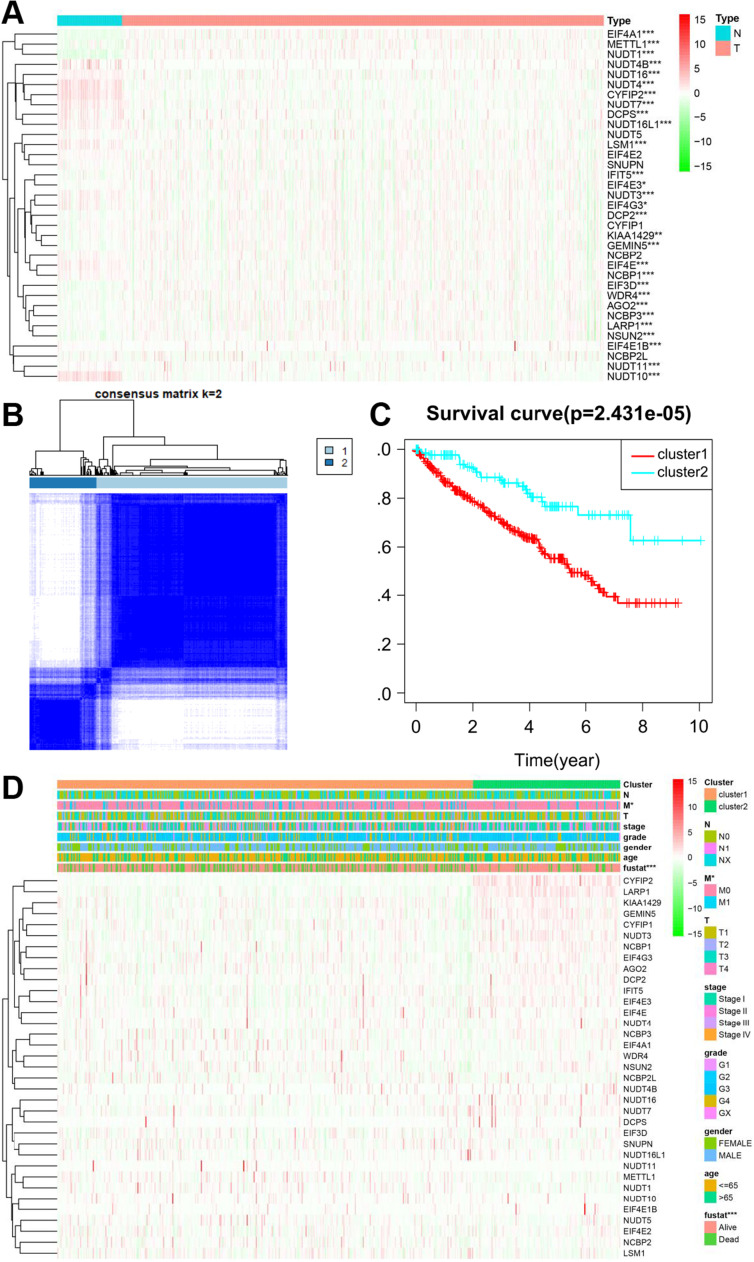
Background: Clear cell renal cell carcinoma (ccRCC) is the most common subtype of renal cancer. 7-Methylguanosine (m7G), one of the most prevalent RNA modifications, has been reported to play an important role in ccRCC progression; however, the specific regulators of m7G modification that are involved in this function remain unclear. This study aimed to explore the correlation between regulators of m7G methylation and ccRCC progression using unsupervised machine learning methods.

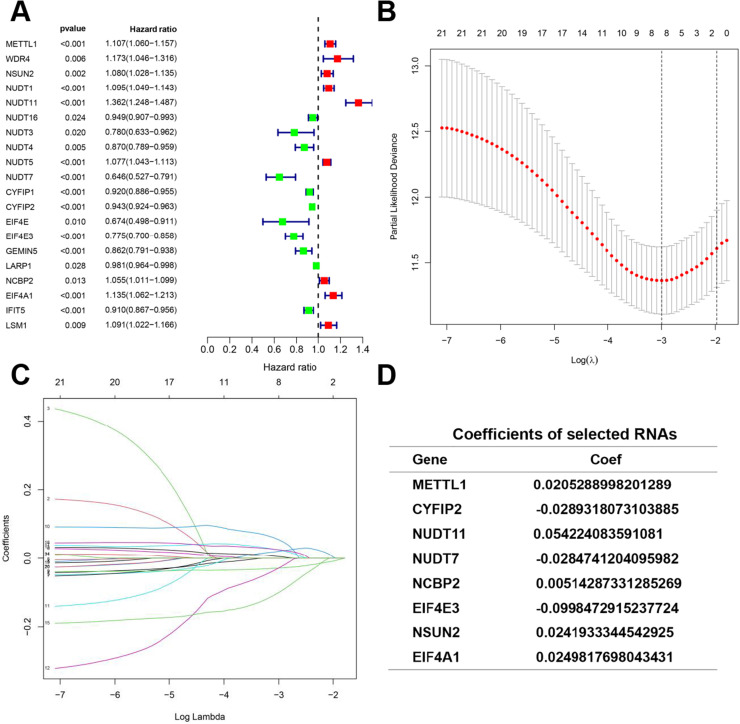
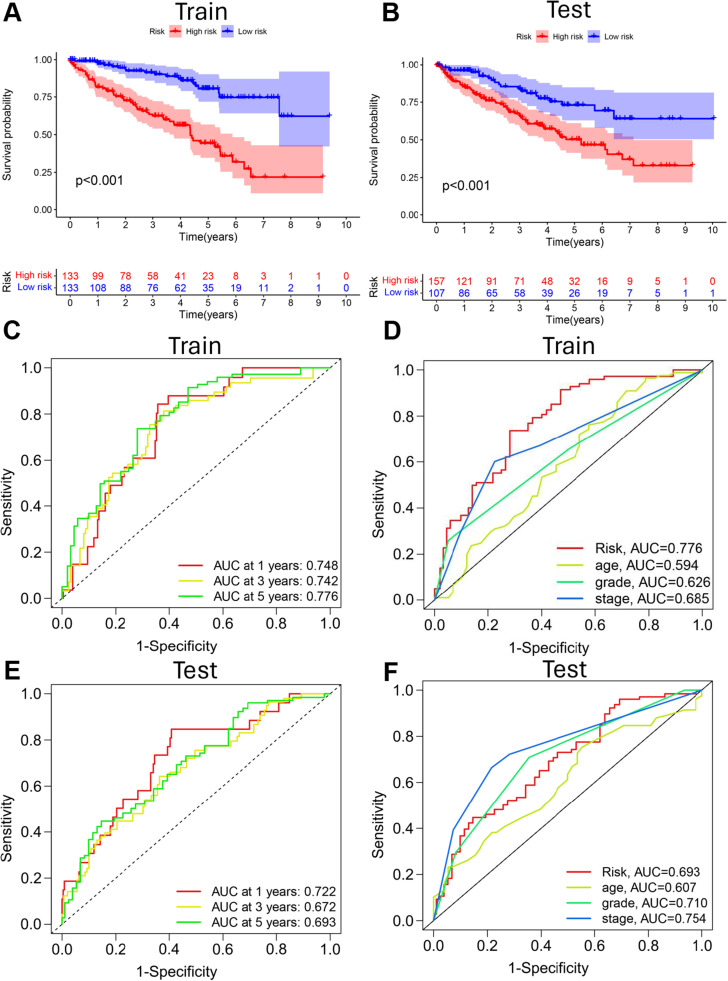
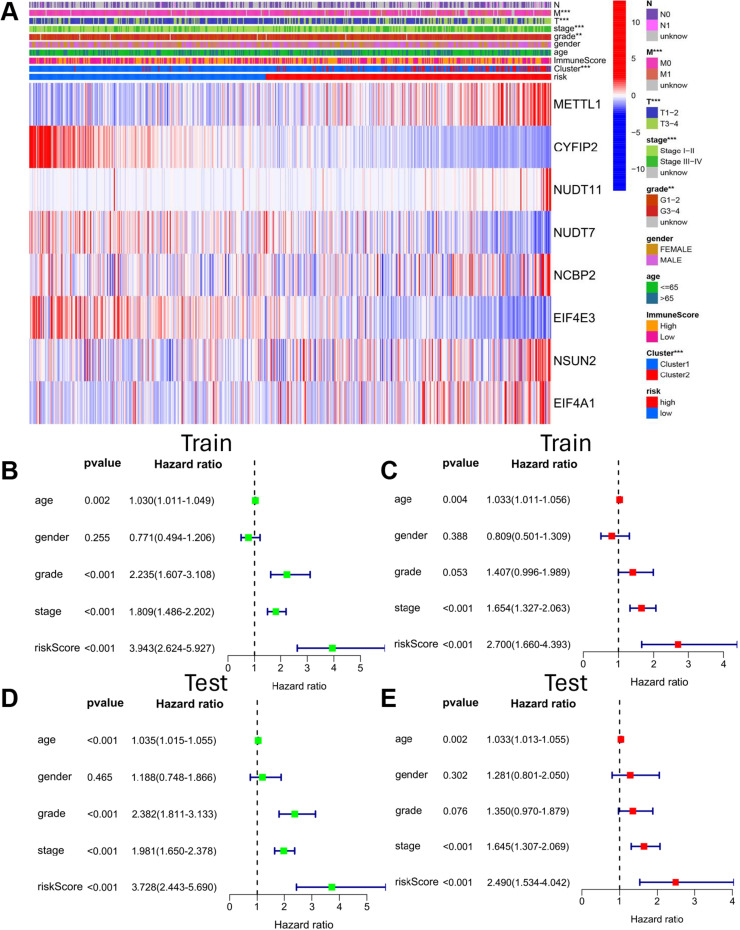
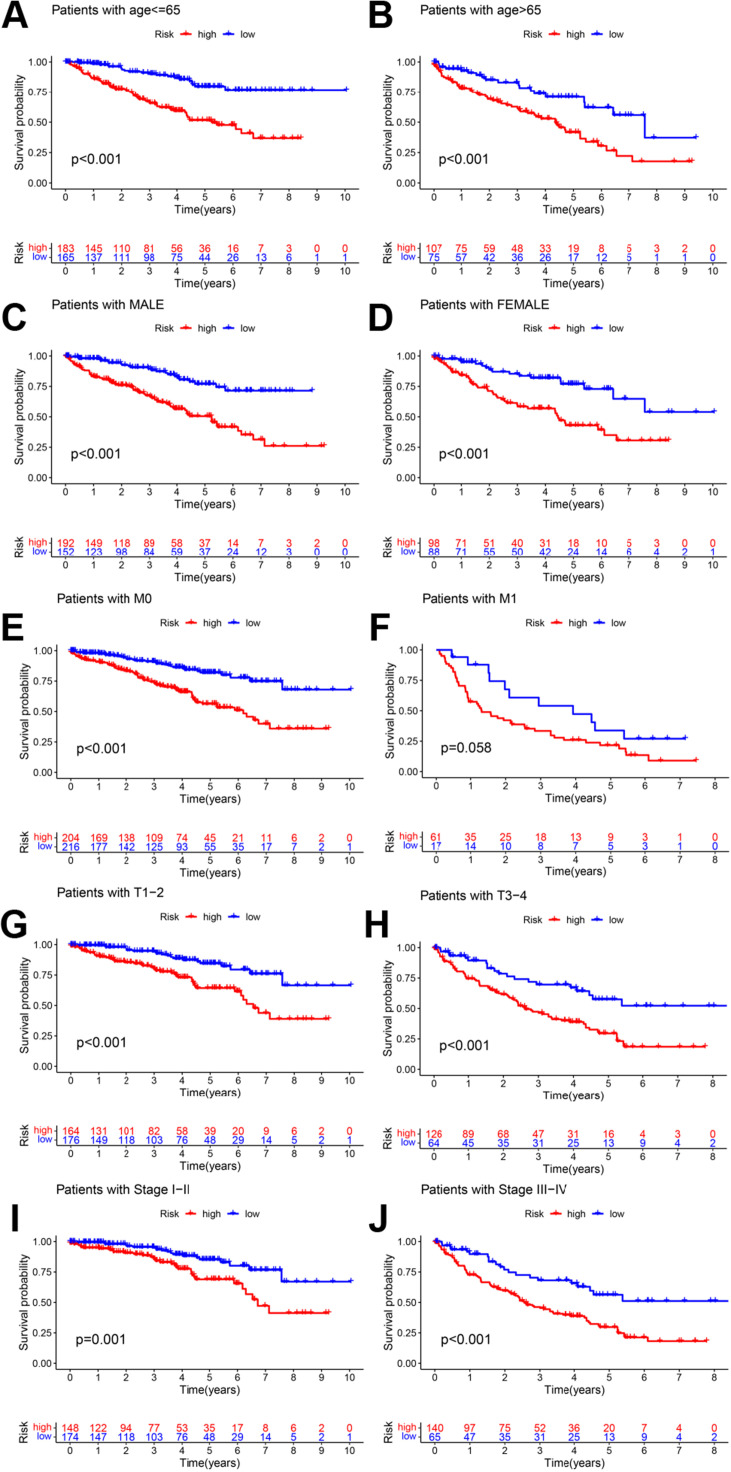
Methods: Transcriptome and clinical data of ccRCC were retrieved from The Cancer Genome Atlas (TCGA) database to identify differentially expressed m7G-related genes associated with the overall survival of patients with ccRCC. To construct and validate a prognostic risk model, TCGA dataset samples were divided into training and test sets. A multiple-gene risk signature was constructed using least absolute shrinkage and selection operator Cox regression analysis, and its prognostic significance was assessed using Cox regression and survival analyses. Finally, immunohistochemistry was performed to verify the prognostic significance of this signature.

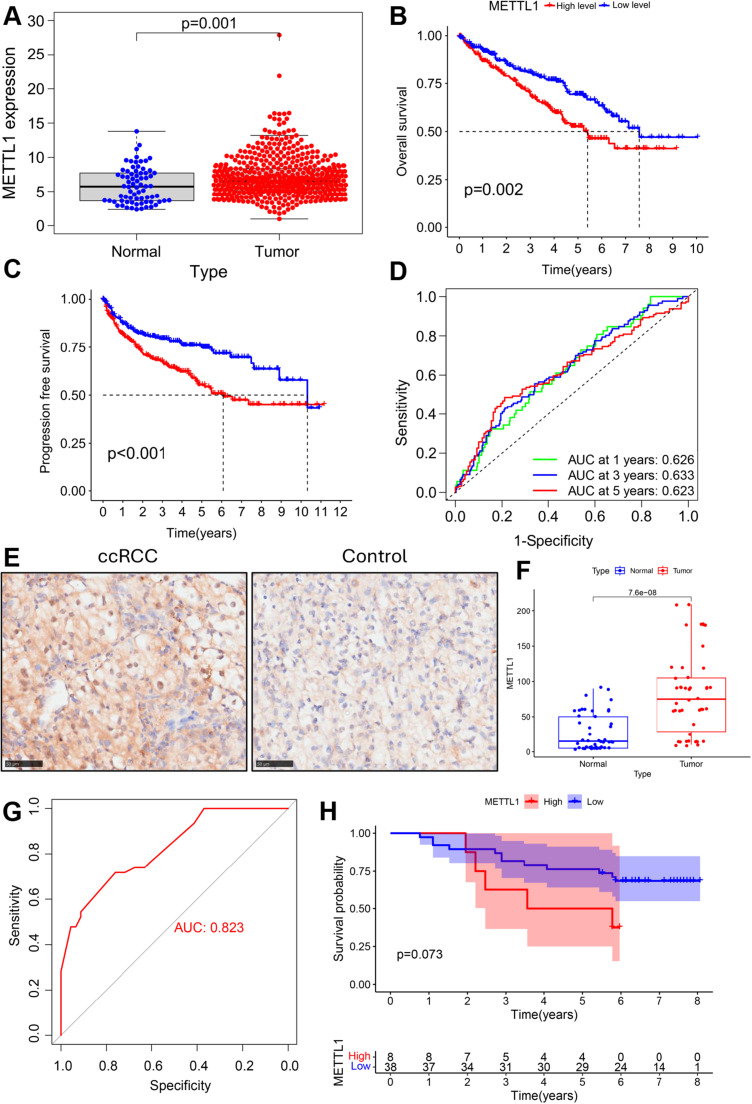
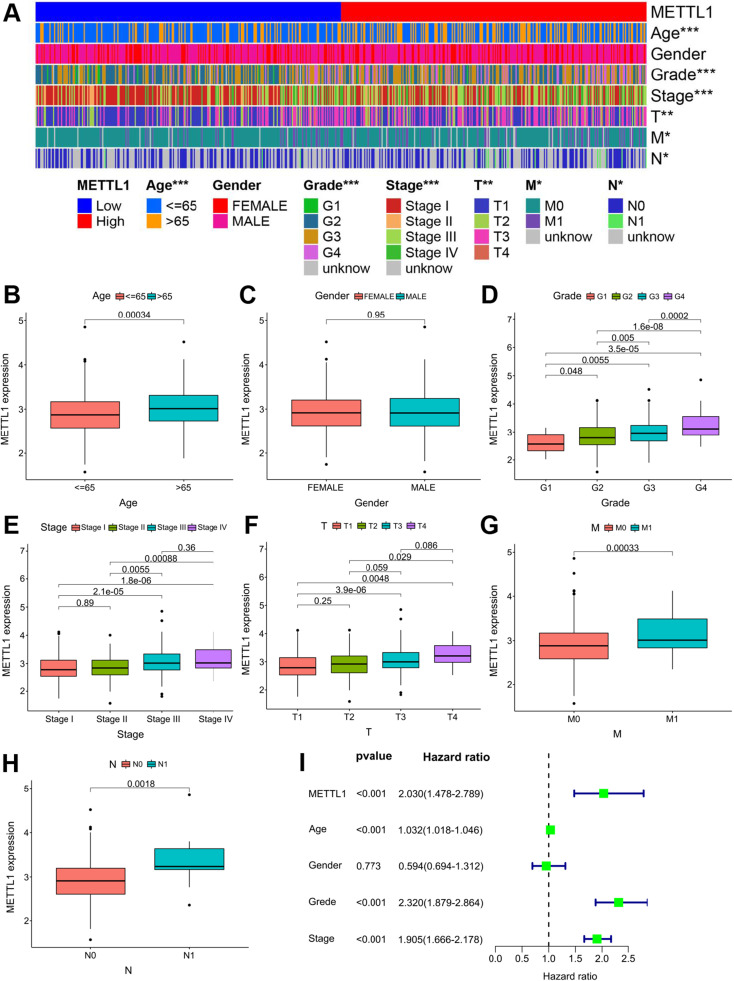
Results: In total, 537 patients with ccRCC were included in this study. We found that 26 m7G RNA methylation regulators that were significantly differentially expressed. Univariate and multifactorial Cox regression analyses revealed that METTL1 expression was associated with ccRCC progression.

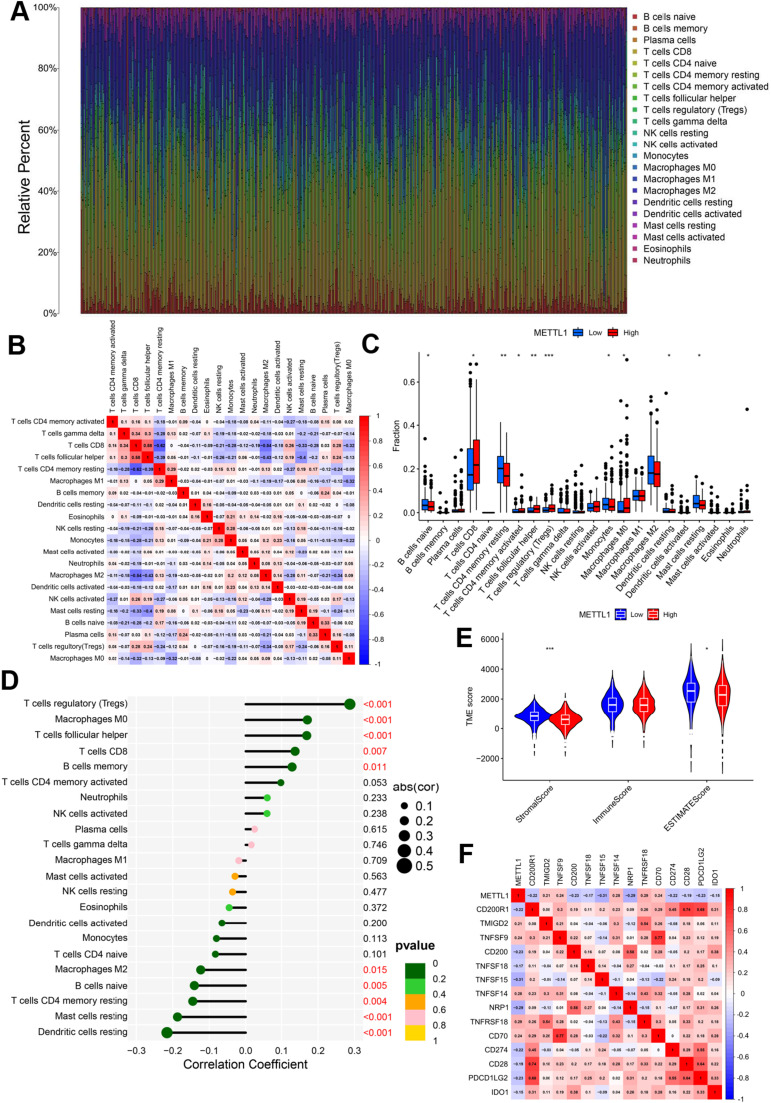
Conclusions: METTL1 associated with m7G may serve as a potential biomarker for ccRCC prognosis and diagnosis. Moreover, it may affect the prognosis of ccRCC by regulating the tumor immune microenvironment, providing a potential therapeutic target for immunotherapy. These results provide a new perspective on the role of M7G-related RNAs in ccRCC pathogenesis.

Keywords: 7-methylguanosine (m7G); Clear cell renal cell carcinoma; METTL1; Prognosis; Tumor immune microenvironment.


Conflict of interest statement

Declaration of competing interest The authors declared that they have no competing interests.

Figures

Fig 1
Fig. 1
Consensus clustering of m7G regulators. (A) Heatmap of the expression of 34 m7G RNA methylation regulators in ccRCC tissues compared. Red indicates upregulation, while green indicates downregulation. Notably, 12 genes, including METTL1 and WDR4, were significantly upregulated, while 14 genes, such as DCPS and NUDT10, were significantly downregulated (P < 0.05).(B) The ccRCC patients were divided into two clusters for k = 2. (C) Kaplan-Meier curves of overall survival of ccRCC patients reveals that patients in cluster 1 had significantly poorer overall survival compared to those in cluster 2 (P < 0.001).(D) The heatmap illustrates the associations between clinicopathological characteristics and the expression of each m7G RNA methylation regulator in the two clusters. The M stage and survival status showed significant associations with the clustering, suggesting that these m7G regulators may play a role in ccRCC progression and patient outcomes.*P < 0.05, **P < 0.01, and ***P < 0.001.
Fig 2
Fig. 2
Identification of m7G RNA methylation regulators associated with prognosis in ccRCC. A) Univariate Cox regression results showing the hazard ratios and 95 % confidence intervals for each m7G RNA methylation regulator. Eight genes, including METTL1 and WDR4, were significantly associated with poor prognosis (HR > 1, P < 0.05), while 11 genes, such as NUDT16 and NUDT3, were negatively associated with ccRCC progression (HR < 1, P < 0.05). (B-C) The least absolute shrinkage and selection operator (LASSO) regression was used to select the most prognostic-related genes. (D) The coefficients of selected RNAs identified eight genes (METTL1, CYFIP2, NUDT11, NUDT7, NCBP2, EIF4E3, NSUN2, and EIF4A1) as key predictors in the prognostic model.
Fig 3
Fig. 3
Evaluates the prognostic risk model for overall survival in ccRCC patients. (A-B) The Kaplan-Meier curves of overall survival for patients in high- and low-risk groups in the training and test sets, respectively. In both sets, patients in the high-risk group demonstrated significantly poorer overall survival (P < 0.001). (C, E) Receiver operating characteristic (ROC) curves and their AUC value for 1, 3, and 5year survival predictions in the training and test sets. The model showed good predictive performance, with AUC values ranging from 0.672 to 0.776 across different timepoints and datasets. (D, F) The ROC curves for prognostic risk score against other clinicopathologic characteristics in the training and test sets. The risk score showed higher AUC values (0.766 in the training set and 0.693 in the test set) compared to age, grade, and stage, indicating its superior predictive power for patient outcomes.
Fig 4
Fig. 4
Assesses the prognostic value of the m7G-related RNAs prognostic risk signature in ccRCC patients. (A) The heatmap showing associations between the expression of the eight m7G-related RNAs in the high- and low-risk groups, clinicopathological features, immune score, and clusters. This visualization reveals distinct expression patterns between the risk groups and their correlation with clinical characteristics. (B) Univariate and (C) multivariate Cox analyses of the risk score model with clinicopathological features (including age, gender, grade, and stage) in the training set. Similarly, (D) Univariate and (E) multivariate Cox analyses show these analyses in the test set. In both sets, the risk score remained an independent prognostic factor after adjusting for other clinical variables, underscoring its robust predictive power.
Fig 5
Fig. 5
Survival outcomes of high- and low-risk score subgroups among ccRCC patients, stratified by various clinicopathological features and METTL1 expression in ccRCC tissues. (A, B) Kaplan-Meier survival curves for patients stratified by age (>60 years vs. ≤60 years), demonstrating that the risk score maintains its prognostic value across age groups. (C, D) The survival differences between risk groups when stratified by gender. (E, F) The survival curves stratified by M stage. (G, H) The survival curves stratified by T stage. (I, J) The survival outcomes for TNM stages (stage I–II vs. stage III–IV). Across all these clinicopathological subgroups, patients in the high-risk group consistently showed poorer survival outcomes compared to those in the low-risk group, highlighting the robustness of the risk score as a prognostic indicator.
Fig 6
Fig. 6
The prognostic value of METTL1 in ccRCC patients. A) METTL1 expression in ccRCC (n = 537) compared to normal tissues (n = 72) in the TCGA dataset, revealing significantly higher expression in tumor tissues (P = 0.001). (B-C) The Kaplan-Meier curves illustrating overall survival and progression-free survival among high-risk and low-risk groups, stratified by METTL1 expression. Patients with high METTL1 expression consistently showed poorer survival outcomes. (D) The receiver operating characteristic (ROC) curves with corresponding AUC value for 1-, 3-, and 5-year survival predictions based on METTL1 expression in the TCGA dataset. The AUC values (0.626, 0.633, and 0.623 for 1-, 3-, and 5-year predictions, respectively) indicate moderate predictive performance. (E-F) The immunohistochemistry results of METTL1 in ccRCC compared to normal tissues and its expression in ccRCC tissue microarrays. (F) The ROC curve for METTL1 expression in ccRCC tissue microarrays, corresponding AUC value 0.823, suggesting strong diagnostic potential for METTL1. (H) The survival probability assessments of METTL1 expression in ccRCC tissue microarrays further confirming its prognostic value.
Fig 7
Fig. 7
Comprehensive analysis of METTL1 expression and its prognostic value in ccRCC A) The heatmap illustrating the associations between METTL1 expression levels and key clinicopathological characteristics. This visualization reveals distinct patterns of METTL1 expression across different patient subgroups, highlighting its potential role in ccRCC progression. (B-H) The box plots that depict the METTL1 expression in specific clinicopathological features. I) The univariate Cox regression analyses, displaying hazard ratios with 95 % confidence intervals for METTL1 expression and various clinicopathological features. This forest plot illustrates that elevated METTL1 expression, along with other factors such as advanced age, higher grade, and later stage, are associated with poorer prognosis in ccRCC patients
Fig 8
Fig. 8
METTL1 expression and its relationship with tumor-infiltrating immune cells and the tumor microenvironment in ccRCC. (A) The stacked bar chart showing the relative proportions of 22 different tumor-infiltrating immune cell (TIC) types across individual ccRCC samples. This visualization provides an overview of the immune cell composition within the tumor microenvironment, highlighting the heterogeneity among patients. (B) The correlation heatmap among the 22 TIC types. The color intensity and size of the circles indicate the strength and direction of correlations between different immune cell populations, offering insights into potential interactions within the tumor immune microenvironment (C) The box plots comparing the infiltration levels of the 22 immune cell types between high and low METTL1 expression groups. These plots reveal significant differences in immune cell compositions based on METTL1 expression levels. (D) The correlation between METTL1 expression and the infiltration levels of various immune cell types. (E) The violin plots comparing tumor microenvironment (TME) scores between high and low METTL1 expression groups. The plots depict differences in stromal scores, immune scores, and overall ESTIMATE scores, providing insights into how METTL1 expression might influence the composition of the tumor microenvironment. (F) The correlation heatmap between METTL1 expression and various immune checkpoint molecules. This visualization helps identify potential relationships between METTL1 and key regulators of the immune response in ccRCC.

Similar articles

Cited by

References

    1. Miller KD, Nogueira L, Mariotto AB, Rowland JH, Yabroff KR, Alfano CM, et al. Cancer treatment and survivorship statistics, 2019. CA A Cancer J. Clin. 2019;69:363–385. - PubMed
    1. Sun Z, Jing C, Xiao C, Li T, Wang Y. Prognostic risk signature based on the expression of three m6A RNA methylation regulatory genes in kidney renal papillary cell carcinoma. Aging. 2020;12:22078–22094. - PMC - PubMed
    1. Siegel RL, Miller KD, Jemal A. Cancer statistics, 2017. CA Cancer J. Clin. 2017;67:7–30. - PubMed
    1. Aweys H, Lewis D, Sheriff M, Rabbani RD, Lapitan P, Sanchez E, et al. Renal cell cancer – insights in drug resistance mechanisms. Anticancer Res. 2023;43:4781–4792. - PubMed
    1. Xu T, Gao S, Ruan H, Liu J, Liu Y, Liu D, et al. METTL14 acts as a potential regulator of tumor immune and progression in clear cell renal cell carcinoma. Front. Genet. 2021;12 - PMC - PubMed

LinkOut - more resources