. 2025 Jan;24(1):100882.
doi: 10.1016/j.mcpro.2024.100882. Epub 2024 Nov 20.

Single-Cell Multi-Omics Analysis of In Vitro Post-Ovulatory-Aged Oocytes Revealed Aging-Dependent Protein Degradation

Affiliations

Single-Cell Multi-Omics Analysis of In Vitro Post-Ovulatory-Aged Oocytes Revealed Aging-Dependent Protein Degradation

Yueshuai Guo et al. Mol Cell Proteomics. 2025 Jan.

Abstract

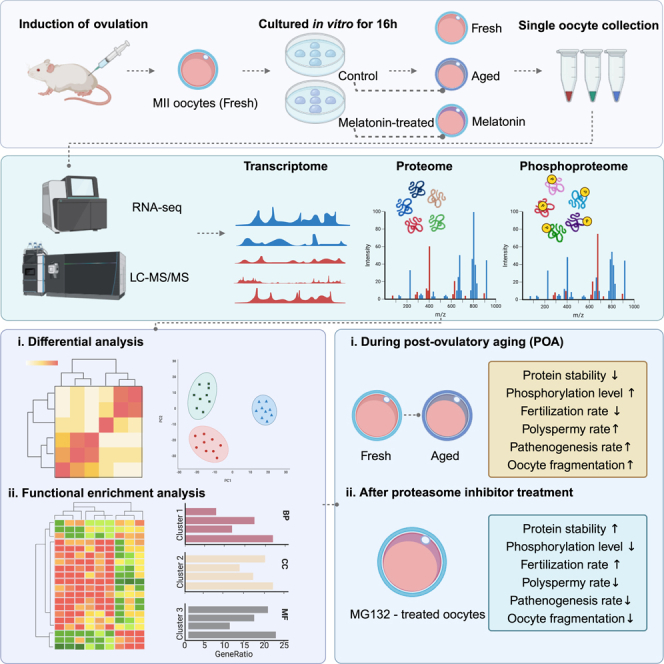
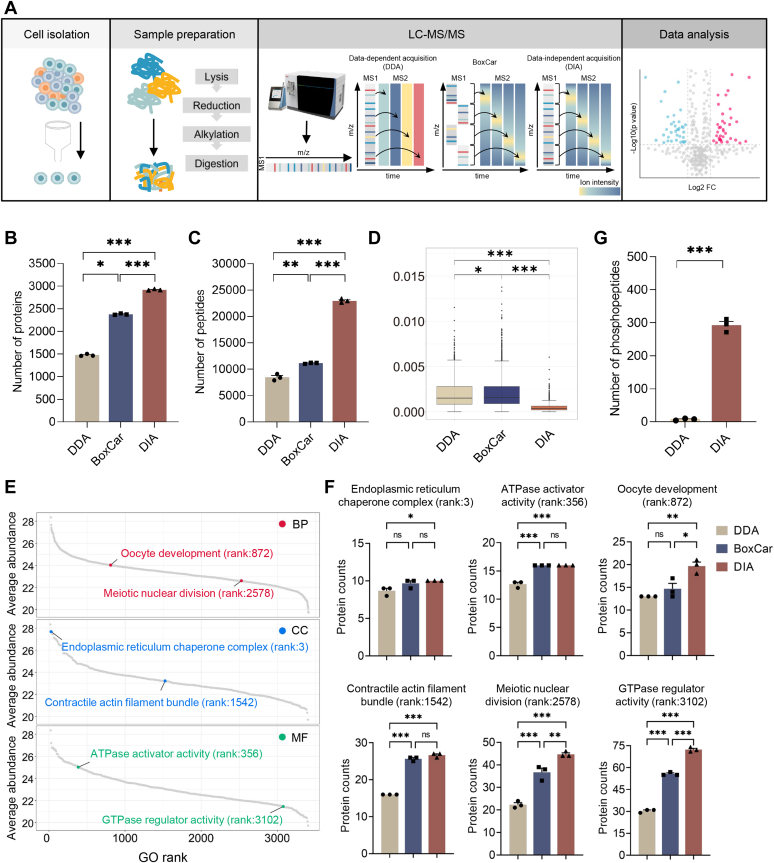
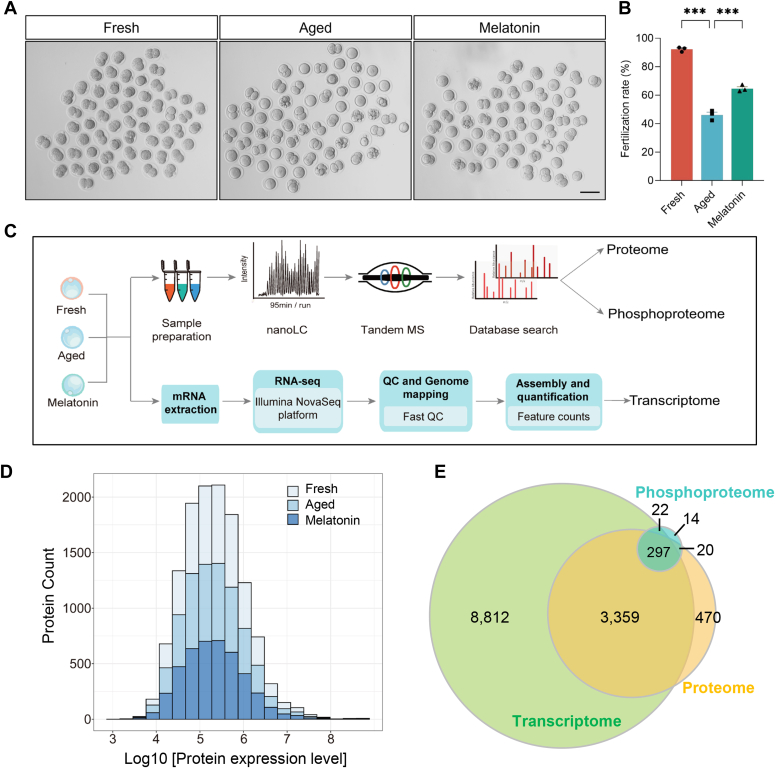
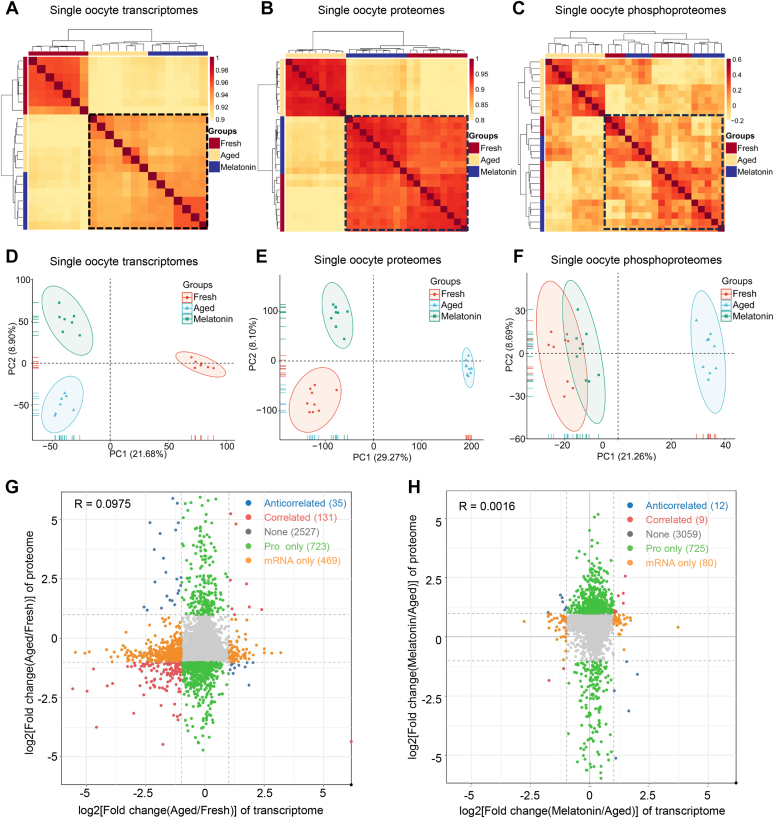
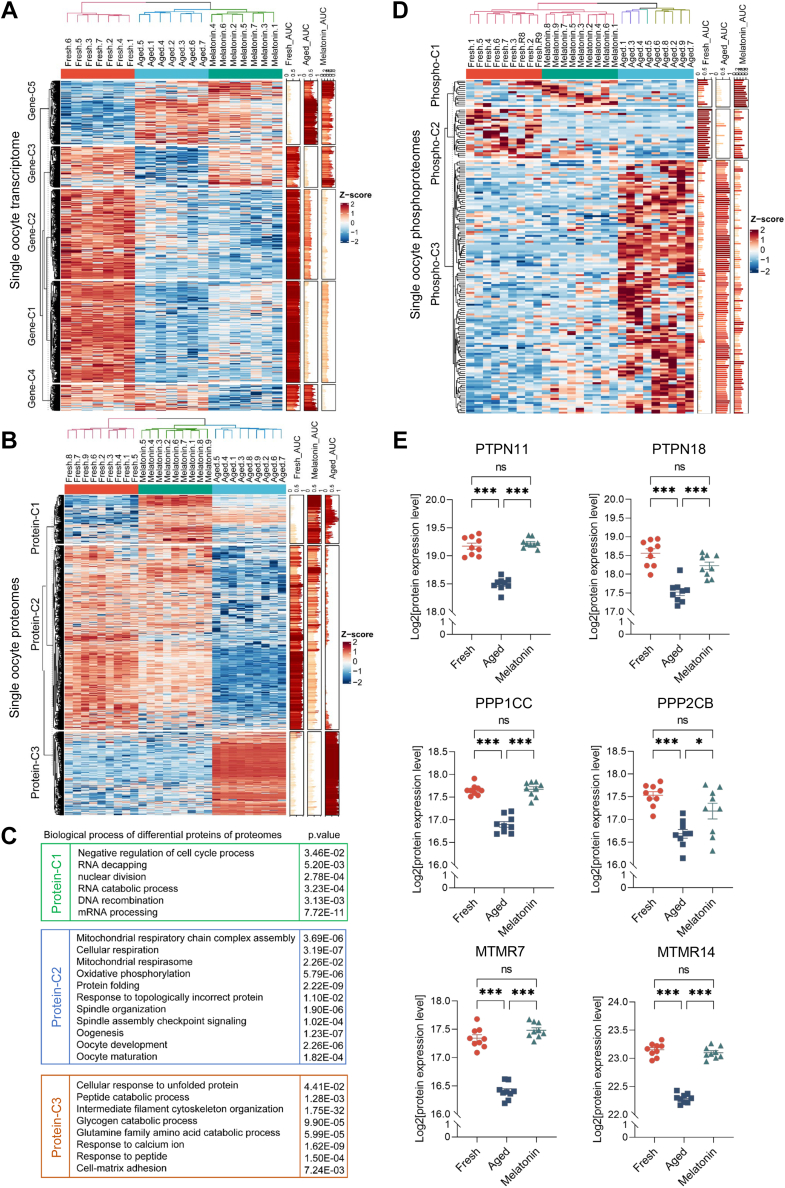
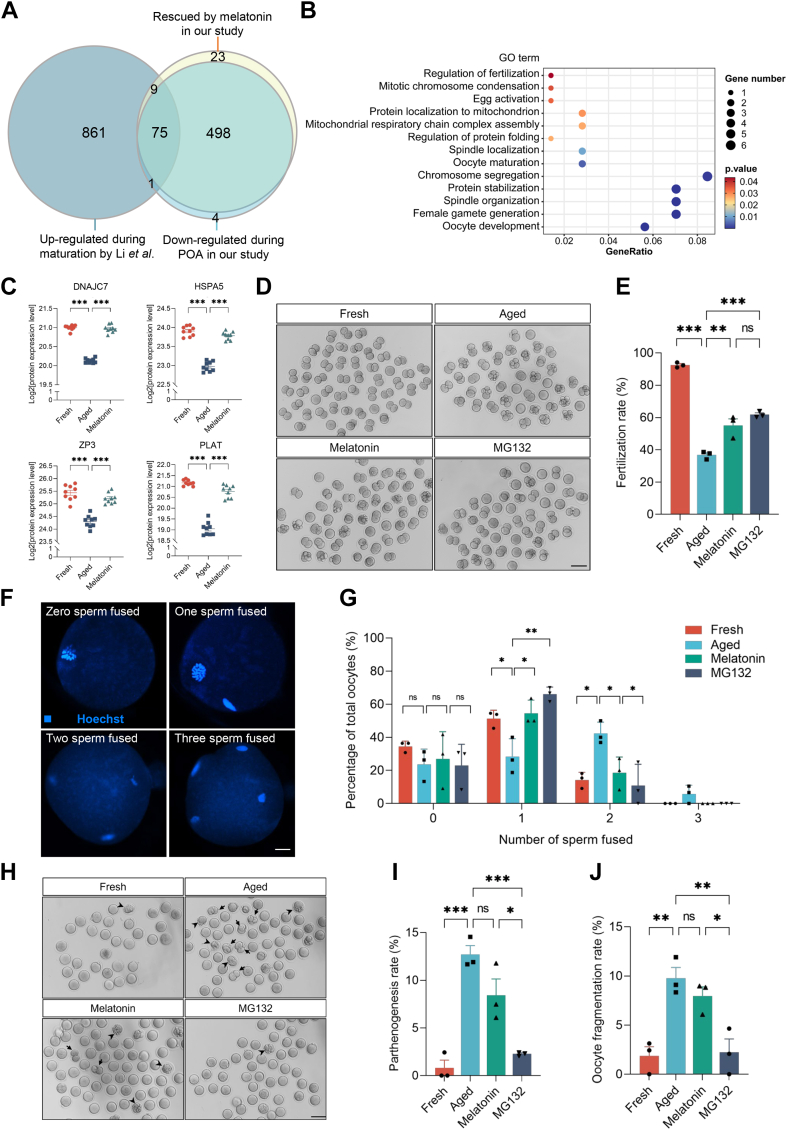
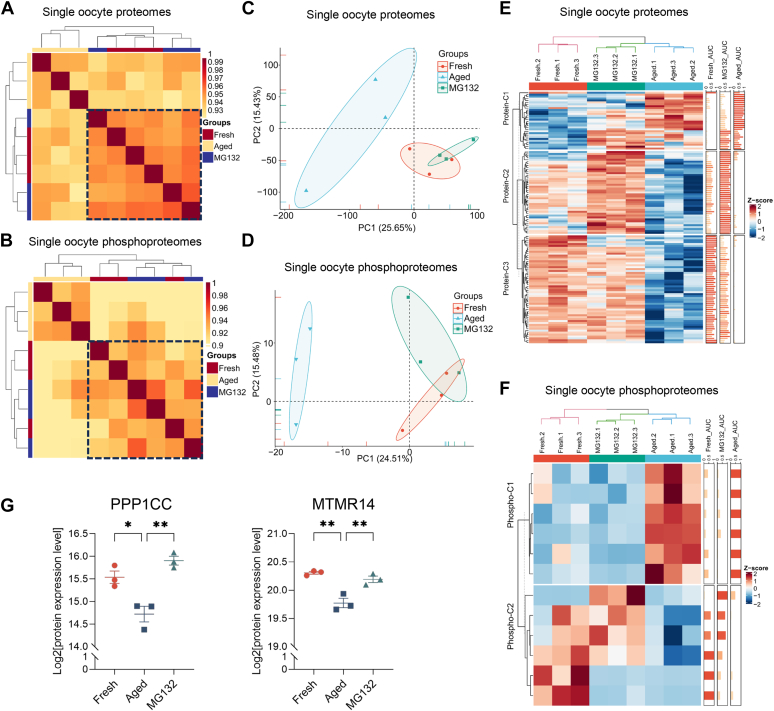
Once ovulated, the oocyte has to be fertilized in a short time window or it will undergo post-ovulation aging (POA), whose underlying mechanisms are still not elucidated. Here, we optimized single-cell proteomics methods and performed single-cell transcriptomic, proteomic, and phosphoproteomic analysis of fresh, POA, and melatonin-treated POA oocytes. POA oocytes showed downregulation of most differentially expressed proteins, with little correlation with mRNA expression, and the protein changes can be rescued by melatonin treatment. MG132 treatment rescued the decreased fertilization and polyspermy rates and upregulated fragmentation and parthenogenesis rates of POA oocytes. MG132-treated oocytes displayed health status at proteome, phosphoproteome, and fertilization ability similar to fresh oocytes, suggesting that protein stabilization might be the underlying mechanism for melatonin to rescue POA. The important roles of proteasome-mediated protein degradation during oocyte POA revealed by single-cell multi-omics analyses offer new perspectives for increasing oocyte quality during POA and improving assisted reproduction technologies.

Keywords: melatonin; mouse; multi-omics; oocyte; post-ovulation aging; single cell.


Conflict of interest statement

Conflict of Interest The authors declare no competing interests.

Figures

None
Graphical abstract
Fig. 1
Fig. 1
Performance comparison of DDA, BoxCar, and DIA methods in single-cell proteomics.A, schematic overview of the workflow of single-cell proteomics analysis using DDA, BoxCar, or DIA methods. B and C, the number of proteins (B) and peptides (C) quantified (n = 3) using DDA, BoxCar, and DIA. D, coefficient of variation of log2-transformed quantification values of proteins commonly identified by DDA, BoxCar, and DIA (n = 3) (Independent Student’s t test). E, GO enrichment ranking of the proteome of mouse GV/MII oocyte and zygote spectra library, with the ranking order determined by the average abundance (log2 iBAQ) of proteins contained in each GO term. F, the number of proteins identified by DDA, BoxCar, and DIA in GO terms with proteins of different abundances (one-way ANOVA, Tukey’s multiple comparison test). G, the number of phosphopeptides identified by DDA and DIA in a single mouse MII oocytes (n = 3) (Two-tailed Student’s t test). ∗p < 0.05; ∗∗p < 0.01; ∗∗∗p < 0.001.
Fig. 2
Fig. 2
Single-cell multi-omics profiling of fresh, POA, and melatonin-treated oocytes.A, representative images of in vitro–fertilized oocytes in fresh (fresh), POA (aged), and melatonin-treated (melatonin) oocytes. Scale bar represents 100 μm. B, in vitro fertilization rates of the oocytes in fresh (n = 169), aged (n = 162), and melatonin (n = 172) groups. Data are presented as mean ± SEM in three independent experiments. ∗∗∗p < 0.001 by one-way ANOVA, Tukey’s multiple comparison test. C, schematic workflow of the RNA-seq, proteomic, and phosphoproteomic profiling of fresh, aged, and melatonin-treated oocytes at single-cell level. D, dynamic range of protein quantification values without imputation in the oocytes of fresh, aged, and melatonin groups. E, Venn diagram showing the overlap among quantified genes in single-cell proteome, transcriptome, and phosphoproteome.
Fig. 3
Fig. 3
Correlation analysis on fresh, POA, and melatonin-treated oocytes at different single-cell omics levels.AC, hierarchical clustering and Pearson correlation analyses of quantitative transcriptomic (A), proteomic (B), and phosphoproteomic (C) data of single-cell oocytes in fresh, aged, and melatonin groups. DF, PCA analyses of quantitative single-cell transcriptomic (D), proteomic (E), and phosphoproteomic (F) data of oocytes in fresh, aged, and melatonin groups. G, scatter plot of the log2-transformed fold changes (aged/fresh) between the single-cell proteome and transcriptome of oocytes. H, scatter plot of the log2-transformed fold changes (melatonin/aged) between the single-cell proteome and transcriptome of oocytes.
Fig. 4
Fig. 4
Heatmap and functional enrichment analysis of differentially expressed oocyte proteins among groups.A and B, K-means clustering and heatmap of differentially expressed genes (A) and differentially expressed proteins (B) among fresh, aged, and melatonin groups. C, the enriched biological processes analysis of differentially expressed proteins from C1, C2, and C3 clusters. D, K-means clustering and heatmap of phosphopeptides with differential levels among fresh, aged, and melatonin groups. E, the protein expression levels of phosphatases PTPN11, PTPN18, PPP1CC, PPP2CB, MTMR7, and MTMR14 in oocytes from fresh, aged, and melatonin groups. ∗p < 0.05, ∗∗∗p < 0.001 by one-way ANOVA with Tukey’s multiple comparison test.
Fig. 5
Fig. 5
MG132 treatment improved the quality of POA oocytes.A, numbers of rescued proteins by melatonin among proteins upregulated during meiotic maturation according to Li et al.’s study but downregulated during POA. B, column diagram of enriched GO terms of 75 rescued proteins by melatonin referred in (A). C, the protein expression levels of DNAJC7, HSPA5, ZP3, and PLAT in oocytes from fresh, aged, and melatonin groups. D, representative images of in vitro–fertilized oocytes in fresh, aged, melatonin and MG132 groups. Scale bar represents 100 μm. E, in vitro fertilization rates of the oocytes in fresh (n = 159), aged (n = 136), melatonin (n = 156), and MG132 (n = 152) groups. F, representative confocal images of in vitro–fertilized zona pellucida–free oocytes with zero, one, two, or three sperm fused. Scale bars represent 10 μm. G, percentage of oocytes with different numbers of fused sperm in fresh (n = 35), aged (n = 50), melatonin (n = 34), and MG132 (n = 35) groups. The x-axis indicates the number of sperm fused and the y-axis shows the percentage of oocytes with distinct numbers of fused sperm. H, representative images of parthenogenetic and fragmented oocytes in fresh, aged, melatonin, and MG132 groups. Arrows indicate the parthenogenetic oocytes and arrowheads indicate the fragmented oocytes. Scale bar represents 100 μm. I and J, the percentage of parthenogenetic (I) and fragmented (J) oocytes in fresh, aged, melatonin, and MG132 groups. Data are presented as mean ± SEM in three independent experiments. ∗p < 0.05, ∗∗p < 0.01, ∗∗∗p < 0.001 by one-way ANOVA with posthoc Tukey’s multiple comparison test.
Fig. 6
Fig. 6
Heatmap and functional enrichment analysis of differentially expressed oocyte proteins among fresh (fresh), post-ovulatory aged (aged), and MG132-treated (MG132) groups.A and B, hierarchical clustering and Pearson correlation analysis of quantitative proteomic (A) and phosphoproteomic (B) data of single-cell oocytes in fresh, aged, and MG132 groups. C and D, PCA analysis of quantitative proteomic (C) and phosphoproteomic (D) data of single-cell oocytes in fresh, aged, and MG132 groups. E and F, K-means clustering and heatmap of differentially expressed proteins (E) and phosphopeptides with differential levels among fresh, aged, and MG132 groups. G, the protein expression levels of phosphatases PPP1CC and MTMR14 in oocytes from fresh, aged, and MG132 groups. ∗p < 0.05, ∗∗p < 0.01 by one-way ANOVA with Tukey’s multiple comparison test.

Similar articles

References

    1. Yuan Y., Li L., Cheng Q., Diao F., Zeng Q., Yang X., et al. In vitro testicular organogenesis from human fetal gonads produces fertilization-competent spermatids. Cell Res. 2020;30:244–255. - PMC - PubMed
    1. Bentov Y., Casper R.F. The aging oocyte--can mitochondrial function be improved? Fertil. Steril. 2013;99:18–22. - PubMed
    1. Di Nisio V., Antonouli S., Damdimopoulou P., Salumets A., Cecconi S. In vivo and in vitro postovulatory aging: when time works against oocyte quality? J. Assist. Reprod. Genet. 2022;39:905–918. - PMC - PubMed
    1. Qiang W., Sun Q.-Y. Evaluation of oocyte quality morphological, cellular and molecular predictors.pdf. Reprod. Fertil. Dev. 2007;19:1–12. - PubMed
    1. Telfer E.E., Grosbois J., Odey Y.L., Rosario R., Anderson R.A. Making a good egg: human oocyte health, aging, and in vitro development. Physiol. Rev. 2023;103:2623–2677. - PMC - PubMed

LinkOut - more resources