

Immune microenvironment of Epstein-Barr virus (EBV)-negative compared to EBV-associated gastric cancers: implications for immunotherapy
- PMID: 39572160
- PMCID: PMC11580252
- DOI: 10.1136/jitc-2024-010201
Immune microenvironment of Epstein-Barr virus (EBV)-negative compared to EBV-associated gastric cancers: implications for immunotherapy
Abstract
Background: Gastric carcinomas (GC) are aggressive malignancies, and only ~15% of patients respond to anti-programmed cell death (ligand) 1 (PD-(L)1) monotherapy. However, Epstein-Barr virus (EBV)-associated GCs (~5-10% of GCs) often harbor PD-L1 and PD-L2 chromosomal amplifications and robust CD8+ T cell infiltrates, and respond at a high rate to anti-PD-1. The current study compares the tumor immune microenvironments (TiMEs) of EBV+ versus EBV(-) GCs.
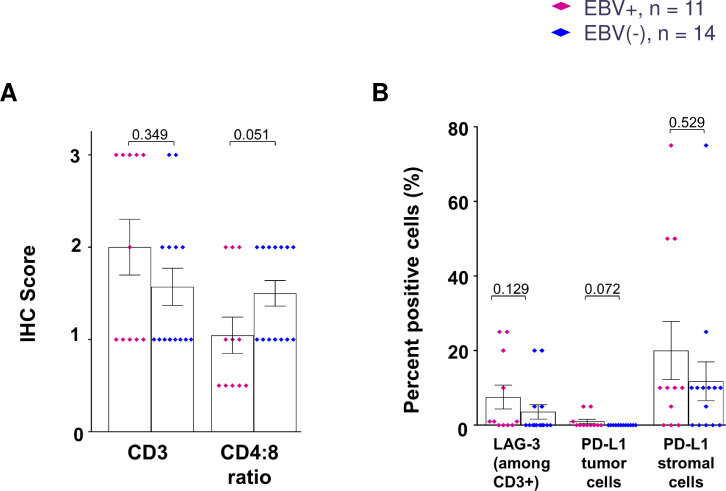
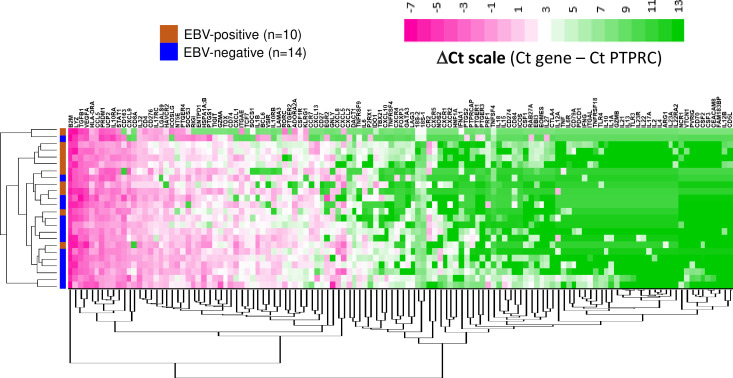
Methods: Over 1000 cases of primary invasive GCs were screened to identify 25 treatment-naïve specimens for study (11 EBV+, 14 EBV(-)). Quantitative immunohistochemistry (IHC) was conducted for markers of immune cell subsets and co-regulatory molecules. Gene expression profiling (GEP) was performed on RNAs isolated from macrodissected areas of CD3+ T cell infiltrates abutting PD-L1+ stromal/tumor cells, using multiplex quantitative reverse transcriptase PCR for a panel of 122 candidate immune-related genes.
Results: IHC revealed that 17/25 GCs contained PD-L1+ stromal cells, with no significant difference between EBV+/- specimens; however, only 3/25 specimens (all EBV+) contained PD-L1+ tumor cells. CD8+ T cell densities were higher in EBV+ versus EBV(-) tumors (p=0.044). With GEP normalized to the pan-leukocyte marker PTPRC/CD45, EBV+ GCs overexpressed ITGAE (CD103, marking intraepithelial T cells and a dendritic cell subset) and the interferon-inducible genes CXCL9 and IDO1. In contrast, EBV(-) tumors overexpressed several functionally-related gene groups associated with myeloid cells (CD163, IL1A, NOS2, RIGI), immunosuppressive cytokines/chemokines (CXCL2, CXCR4, IL10, IL32), coinhibitory molecules (HAVCR2/TIM-3 and VSIR/VISTA), and adenosine pathway components (ENTPD1/ CD39 and NT5E/CD73). Notably, compared with EBV+ GCs, EBV(-) GCs also overexpressed components of the cyclooxygenase 2 (COX-2)/prostaglandin E2 (PGE2) pathway associated with cancer-promoting inflammation, including PTGS2/COX-2 (most highly upregulated gene, 32-fold, p=0.005); prostaglandin receptors PTGER1 (EP1; up 21-fold, p=0.015) and PTGER4 (EP4; up twofold, p=0.022); and the major COX-2-inducing cytokine IL1B (up 11-fold, p=0.019). Consistent with these findings, COX-2 protein expression trended higher in EBV(-) versus EBV+ GCs (p=0.068).
Conclusions: While certain markers of immunosuppression are found in the GC TiME regardless of EBV status, EBV(-) GCs, which are much more common than EBV+ GCs, overexpress components of the COX-2/PGE2 pathway. These findings provide novel insights into the immune microenvironments of EBV+ and EBV(-) GC, and offer potential targets to overcome resistance to anti-PD-(L)1 therapies.
Keywords: Gastric Cancer; Gene expression profiling - GEP; Immunotherapy; Tumor microenvironment - TME.
© Author(s) (or their employer(s)) 2024. Re-use permitted under CC BY-NC. No commercial re-use. See rights and permissions. Published by BMJ.
Conflict of interest statement
Competing interests: MY receives grant/research support (to Johns Hopkins University) from Bristol Myers Squibb, Exelixis, Incyte, and Genentech; receives honoraria and consulting fees from Genentech, Incyte, Exelixis, AstraZeneca, Replimune, Hepion, and Lantheus; is a cofounder with equity in Adventris Pharmaceuticals and has patents related to cancer vaccines, outside of the submitted work. KU-K has received stock from Bristol Myers Squibb, Pfizer, and BioNTech. KX has received stock from Bristol Myers Squibb. JMT receives consulting fees from Bristol Myers Squibb, Merck & Co, AstraZeneca, Elephas, Regeneron, Roche, Compugen, and Akoya Biosciences; has patents related to the AstroPath imaging suite; has received institutional research grants from Bristol Myers Squibb and Akoya Biosciences; and has received equipment and stock from Akoya Biosciences. RAA reports grants from RAPT Therapeutics, and personal fees from Bristol Myers Squibb, AstraZeneca, Merck, and JAZZ Oncology. SLT receives consulting fees from Bristol Myers Squibb, Dragonfly Therapeutics, PathAI, and (spouse) Amgen, Compugen, Janssen Pharmaceuticals, Normunity, RAPT Therapeutics, Regeneron, Takeda Pharmaceuticals, and Tizona LLC; receives research grants from Bristol Myers Squibb, and (spouse) Compugen and Immunomic Therapeutics; has stock options or stock in Atengen Inc., Dragonfly Therapeutics, and (spouse) DNAtrix, Dracen, ManaT Bio, RAPT Therapeutics, and Tizona LLC; and has patents related to the treatment of MSI-high cancers with anti-PD-1 and (spouse) related to T-cell regulatory molecules including LAG-3. The following authors declare no potential conflicts of interest: SB, TLM, QZ, JL, FB, LLE, and AEB.
Figures


References
-
- Kang YK, Boku N, Satoh T, et al. Nivolumab in patients with advanced gastric or gastro-oesophageal junction cancer refractory to, or intolerant of, at least two previous chemotherapy regimens (ONO-4538-12, ATTRACTION-2): a randomised, double-blind, placebo-controlled, phase 3 trial. Lancet. 2017;390:2461–71. doi: 10.1016/S0140-6736(17)31827-5. - DOI - PubMed
Publication types
MeSH terms
Grants and funding
LinkOut - more resources
Full Text Sources
Medical
Research Materials
Miscellaneous