. 2024 Dec 13;11(12):ENEURO.0326-24.2024.
doi: 10.1523/ENEURO.0326-24.2024. Print 2024 Dec.

Striatal Interneuron Imbalance in a Valproic Acid-Induced Model of Autism in Rodents Is Accompanied by Atypical Somatosensory Processing

Affiliations

Striatal Interneuron Imbalance in a Valproic Acid-Induced Model of Autism in Rodents Is Accompanied by Atypical Somatosensory Processing

Dayna N Ibáñez-Sandoval et al. eNeuro. .

Abstract

Autism spectrum disorder (ASD) is characterized by deficits in social interaction and communication, cognitive rigidity, and atypical sensory processing. Recent studies suggest that the basal ganglia, specifically the striatum (NSt), plays an important role in ASD. While striatal interneurons, including cholinergic (ChAT+) and parvalbumin-positive (PV+) GABAergic neurons, have been described to be altered in animal models of ASD, their specific contribution remains elusive. Here, we combined behavioral, anatomical, and electrophysiological quantifications to explore if interneuron balance could be implicated in atypical sensory processing in cortical and striatal somatosensory regions of rats subjected to a valproic acid (VPA) model of ASD. We found that VPA animals showed a significant decrease in the number of ChAT+ and PV+ cells in multiple regions (including the sensorimotor region) of the NSt. We also observed significantly different sensory-evoked responses at the single-neuron and population levels in both striatal and cortical regions, as well as corticostriatal interactions. Therefore, selective elimination of striatal PV+ neurons only partially recapitulated the effects of VPA, indicating that the mechanisms behind the VPA phenotype are much more complex than the elimination of a particular neural subpopulation. Our results indicate that VPA exposure induced significant histological changes in ChAT+ and PV+ cells accompanied by atypical sensory-evoked corticostriatal population dynamics that could partially explain the sensory processing differences associated with ASD.

Keywords: autism spectrum disorder; sensory processing; striatal interneurons; valproic acid.


Conflict of interest statement

The authors declare no competing financial interests.

Figures

Figure 1.
Figure 1.
VPA-exposed animals exhibited the main characteristics of ASD. A, Schematic representation of the box with three chambers (left). The “test rat” was placed in the center compartment and the novel rat was placed in a lateral compartment. The average times spent in each compartment during the habituation session (A1), the time spent in the “novel compartment” during the experimental session (A2), the number of contacts with the novel animal (A3), and the total interaction time with the novel animal (A4) are displayed in the right bar plots summarizing eighteen experiments which show that VPA animals exhibited significantly lower levels of interaction with the novel animal than with the control group. B, Schematic representation of the open field apparatus (left). Total traveled distance (B1), number of events (B2), and total time spent in grooming behavior (B3) are summarized in the right bar blots showing that VPA animals expressed significantly increased levels of stereotyped behavior than the control animals. C, Schematic representation of the hole-board apparatus (left). The latency to the first entrance (C1), the total number of crossings through the hole (C2), and the total accumulated time spent inside the hole (C3) are displayed in the right panels; these findings suggest increased attentional levels in the VPA animals. *p < 0.05; ***p < 0.01; ***p < 0.001.
Figure 2.
Figure 2.
Decrease of striatal ChAT+ cells in VPA animals. Representative microphotographs of the NSt from control (A) and VPA (B) animals. Note the homogeneous distributions of ChAT+ cells throughout the NSt in control animals (A) and a significant reduction of ChAT+ cells in VPA animals (B). Formal quantification of immune-positive cells was performed in the dorsomedial (A2, B2) and dorsolateral (A3, B3) regions of the striatum, indicated by squares in A1 and B1. The reduction of ChAT+ cells was greater in the dorsolateral striatum (DLSt; compare A2 and B2) than in the dorsomedial striatum (DMSt; see A3 vs B3). C, Summary plots of seven brains from each group of animals (control, black; VPA, blue). *p < 0.05; **p < 0.01; ***p < 0.001.
Figure 3.
Figure 3.
Decrease of striatal PV+ cells in VPA-exposed animals. Representative microphotographs of the NSt from control (A) and VPA (B) animals showing the distribution of PV+ cells. Formal quantification of immune-positive cells was performed in the dorsomedial (A2, B2) and dorsolateral (A3, B3) regions of the striatum, indicated by squares in A1 and B1. The reduction in the PV labeling of cells was greater in the DLSt (see A2 vs B2) than in the DMSt (see A3 vs B3). C, Summary plots of seven brains from each group of animals (control, black; VPA, blue). *p < 0.05; **p < 0.01; ***p < 0.001.
Figure 4.
Figure 4.
Spontaneous activity in S1 and DLSt neurons in anesthetized animals. A, Schematic representation of the acute preparation for recordings in deeply anesthetized rats fixed on a stereotaxic frame. Stimulation consisted of 50 trains of five 5 ms electrical pulses (3.3 Hz) applied to the forepaw contralateral to the recording sites in S1 or DLSt (B, C). For the rest of the figure, control and VPA groups are presented in black and blue, respectively (Swanson, 2018). D, Firing rates for all cells recorded and grouped by animal in the S1 and DLSt. E, H, Average autocorrelograms for all cells belonging to the specific subgroups recorded in the S1 (E) and DLSt (H). F, I, Percentage of occurrence of each autocorrelogram type for neurons recorded in the S1 (F) and DLSt (I; K–W and Bonferroni’s post hoc test). G, J, Relative contribution of specific band frequencies to the total autocorrelogram power for neurons recorded in the S1 (G) and DLSt (J). Wilcoxon rank sum test, all p values >0.07. Boxplots depict median and the 25th and 75th percentiles; significant differences are indicated by asterisks.
Figure 5.
Figure 5.
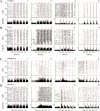
Sensory-evoked response in S1 in VPA animals. A–D, Spike rasters (top) and average peri-event histograms (bottom) for representative neurons with different response patterns recorded in the S1 (A, B) and DLSt (C, D) of control (A, C) and VPA (B–D) animals; red dots and dashed lines indicate somesthetic stimulations. Four different representative cells (patterns) are depicted for each structure and condition.
Figure 6.
Figure 6.
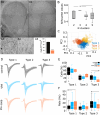
S1 population dynamics in control and VPA animals. A, Representative microphotographs of S1 from control (left) and VPA (right) animals showing the distribution of PV+ cells. B, Formal quantification of immune-positive cells in S1. For the entire figure, control and VPA groups are presented in black and blue, respectively. C, Averaged firing rates for cells recorded in S1 of control (top) and VPA (bottom) animals, expressed as Z-score (range value, −1 to 3) and sorted according to the time they reached the highest (bottom to top) or lowest (top to bottom) activity after somesthetic stimulation (indicated by red dots and lines). Bottom traces represent averaged histograms of the population response for all cells recorded. D, Response latencies to the first stimulus of the train; latencies under 50 ms are compared in the inset panel. E, Percentage of neurons classified as facilitating (solid color) or depressing (gray) based on their linear growth (or decay) profile of adaptation to the progression of the stimulation train. F, Comparison of the response amplitude for the long-latency increase component of the sensory-evoked responses (example with squared area in C). Top asterisk and lines indicate intra-group statistical differences between the first stimulus of the train (asterisk) and the corresponding subsequent stimuli (joined by lines). Asterisks at the bottom represent inter-group statistical differences for the corresponding stimulus. G, Amplitude of the average general population's joint response to the five stimuli of the trains (S1–S5). H, Silhouette values for 1,000 iterations in 3–8 k-means projections from the PCA on the peri-event histograms of the sensory-evoked spiking activity. I, Best PC projection corresponding to 4 clusters (color coded). J, Averaged sensory-evoked responses for cells classified as part of specific sensory-evoked patterns in control and VPA animals. Solid lines and shaded areas represent the median and the 25th and 75th percentiles, respectively. K, Percentages of cells belonging to the different classified patterns in J. L, Low-dimensional PC-3D projection of the population activity in S1 evoked by 50 stimulation trains for control and VPA recordings. PC-2D projections for PCs 1–3 (M–O) versus time. Gray lines represent 1,000 surrogate PC projections obtained from shuffling spike trains. Comparison of the trajectory speed (P) and amplitude (Q) for each PC in control and VPA recordings. For corresponding panels, boxplots indicate median and 75th and 25th percentiles. Statistical differences are indicated by asterisks and lines joining specific comparisons and were obtained with K–W (as indicated in the main text) and the Bonferroni’s post hoc test (*p < 0.05; ***p < 0.01).
Figure 7.
Figure 7.
DLSt population dynamics in control and VPA animals. A, Averaged firing rates for cells recorded in the DLSt of control (top) and VPA (bottom) animals expressed as z-score (range value, −1 to 1.5) and sorted according to the time they reached the highest (bottom to top) or lowest (top to bottom) activity after somesthetic stimulation (indicated by red dots and lines). Bottom traces represent averaged histograms of the population responses. B, Response latencies to the first stimulus of the train; latencies under 50 ms are compared in the inset panel. For the entire figure, control and VPA groups are presented in black and blue, respectively. C, D, Amplitude of the general population responses for a 200 ms window starting 80 ms after the onset of the stimuli and for the joint five stimuli of the trains (left, S1–S5) or for each stimulus of the train. E, Linear growth (left panel) or decay (right panel) rates for striatal train responses. F, Percentage of neurons classified as facilitating or (solid color) or depressing (gray) based on their linear growth (or decay) adaptation profile to the progression of the stimulation train. G, Comparison of the response amplitude for the long-latency increase component the sensory-evoked responses. Top asterisk and lines indicate intra-group statistical differences between the first stimulus of the train (asterisk) and the corresponding subsequent ones (joined by lines). H, Silhouette values for 1,000 iterations in 3–8 k-means projections from the PCA on the peri-event histograms of the sensory-evoked spiking activity. I, Best PC projection corresponding to six clusters (color coded). J, Averaged sensory-evoked responses for cells classified as part of specific sensory-evoked patterns in control and VPA animals. Solid lines and shaded areas represent the median and the 25th and 75th percentiles, respectively. K, Percentages of cells belonging to the different classified patterns in J. L, Low-dimensional PCA-3D projection of the population activity in S1 evoked by 50 stimulation trains for control, and VPA recordings. PC-2D projections for PC 1–3 (M–O) versus time. Gray lines represent 1,000 surrogate PCA projections obtained from shuffling spike trains. Comparison of the trajectory speed (P) and amplitude (Q) for each PC. For corresponding panels, boxplots indicate median and 75th and 25th percentiles. Statistical differences are indicated by asterisks and lines joining specific comparisons and obtained with K–W (as indicated in the main text) and the Bonferroni’s post hoc test (*p < 0.05; ***p < 0.001).
Figure 8.
Figure 8.
S1-DLSt correlations. Spearman correlation plots between cortical S1 (Y axis) and DLSt (X axis) for the amplitude of the short-latency increase (left column) and decrease activity (middle column) and the amplitude of the long-latency increase component (right column) of the sensory-evoked responses in the control (top row) and VPA animals (bottom row). Correlation and probability values are displayed for each comparison (significant comparisons are highlighted in red).
Figure 9.
Figure 9.
Baseline activity in subpopulations of striatal neurons. Representative microphotographs (A1–A4) and quantifications (A5; control 78.64 ± 3.831 and PV + Cree-Casp 21.16 ± 1.657) of the NSt from control (A1, A3) and PV + Cre-Casp (A2, A4) animals showing the distribution of PV labeling; ***p < 0.001. B, Silhouette values for 1,000 iterations in 5–5 k-means projections from the PCA on the spike-wave shapes for striatal neurons. C, Best PC projection corresponding to three clusters (color coded). D, Average spike waves from all cells classified as belonging to specific subpopulations in control (black code for the entire figure), VPA (blue code for the entire figure), and PV + Cre-Casp animals (orange code for the entire figure) recorded in the DLSt. E, Percentage of cells classified as belonging to each subpopulation. F, Firing rates for all cells recorded in the DLSt belonging to each subpopulation.
Figure 10.
Figure 10.
Correlations between striatal subpopulations and behavioral variables. Spearman correlation plots between the number of Type 1 (A), Type 2 (B), and Type 3 (C) neurons and different behavioral variables used to confirm the VPA model for the control (black, top row) and VPA animals (blue, bottom row). Correlation and probability values are displayed for each comparison (significant comparisons highlighted in red).

Similar articles

References

    1. Abudukeyoumu N, Hernandez-Flores T, Garcia-Munoz M, Arbuthnott GW (2019) Cholinergic modulation of striatal microcircuits. Eur J Neurosci 49:604–622. 10.1111/ejn.13949 - DOI - PMC - PubMed
    1. Apicella P (2017) The role of the intrinsic cholinergic system of the striatum: what have we learned from TAN recordings in behaving animals? Neuroscience 360:81–94. 10.1016/j.neuroscience.2017.07.060 - DOI - PubMed
    1. Assous M (2021) Striatal cholinergic transmission. Focus on nicotinic receptors’ influence in striatal circuits. Eur J Neurosci 53:2421–2442. 10.1111/ejn.15135 - DOI - PMC - PubMed
    1. Assous M, Kaminer J, Shah F, Garg A, Koós T, Tepper JM (2017) Differential processing of thalamic information via distinct striatal interneuron circuits. Nat Commun 8:15860. 10.1038/ncomms15860 - DOI - PMC - PubMed
    1. Báez-Cordero AS, Pimentel-Farfan AK, Peña-Rangel T, Rueda-Orozco PE (2020) Unbalanced inhibitory/excitatory responses in the substantia nigra pars reticulata underlie cannabinoid-related slowness of movements. J Neurosci 40:5769–5784. 10.1523/JNEUROSCI.0045-20.2020 - DOI - PMC - PubMed

MeSH terms

LinkOut - more resources