. 2024 Nov 21;15(1):10089.
doi: 10.1038/s41467-024-54138-9.

Integrated molecular and functional characterization of the intrinsic apoptotic machinery identifies therapeutic vulnerabilities in glioma

Affiliations

Integrated molecular and functional characterization of the intrinsic apoptotic machinery identifies therapeutic vulnerabilities in glioma

Elizabeth G Fernandez et al. Nat Commun. .

Abstract

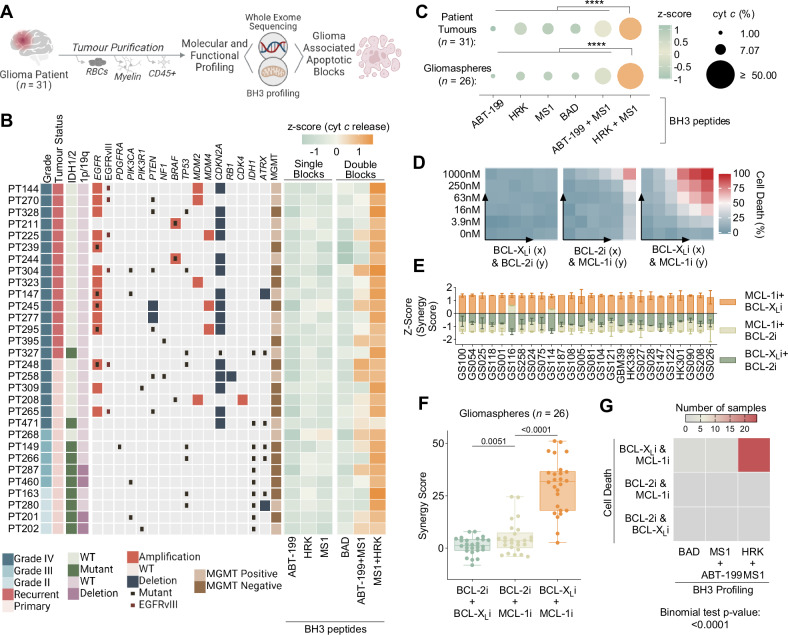
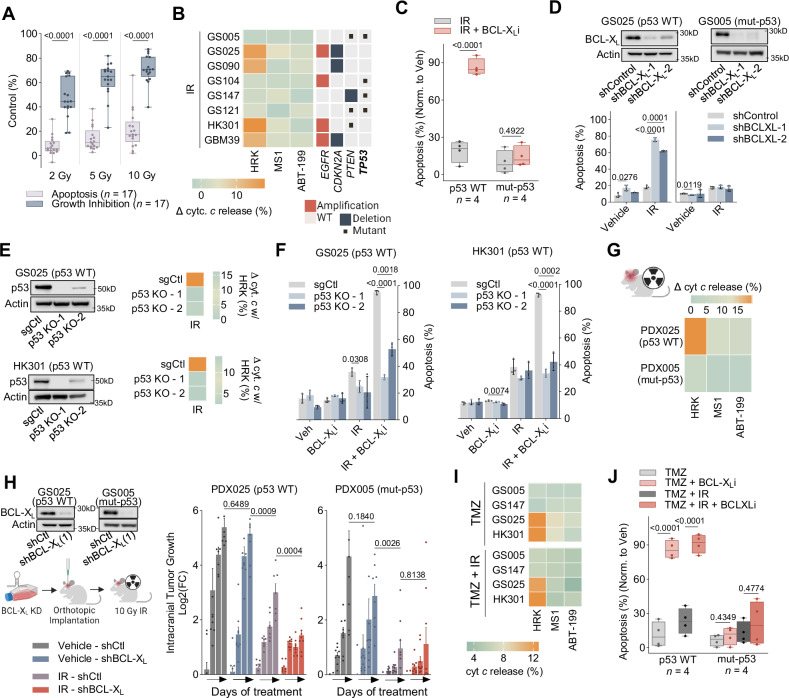
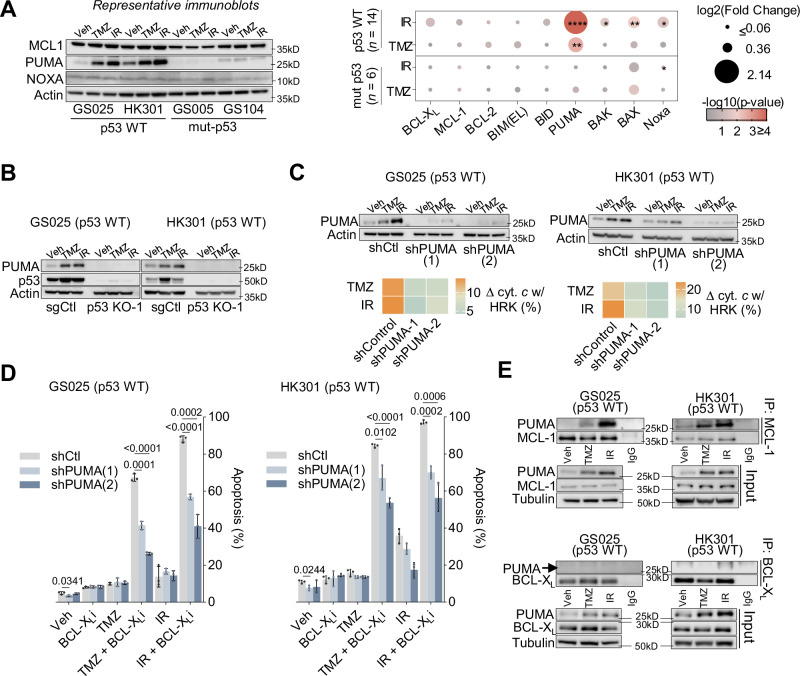
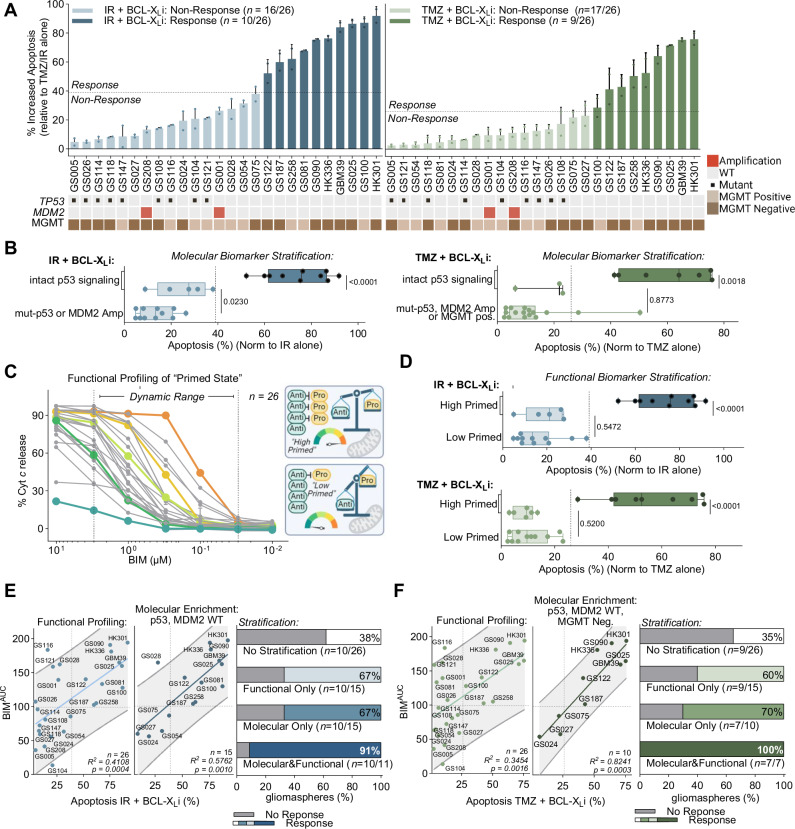
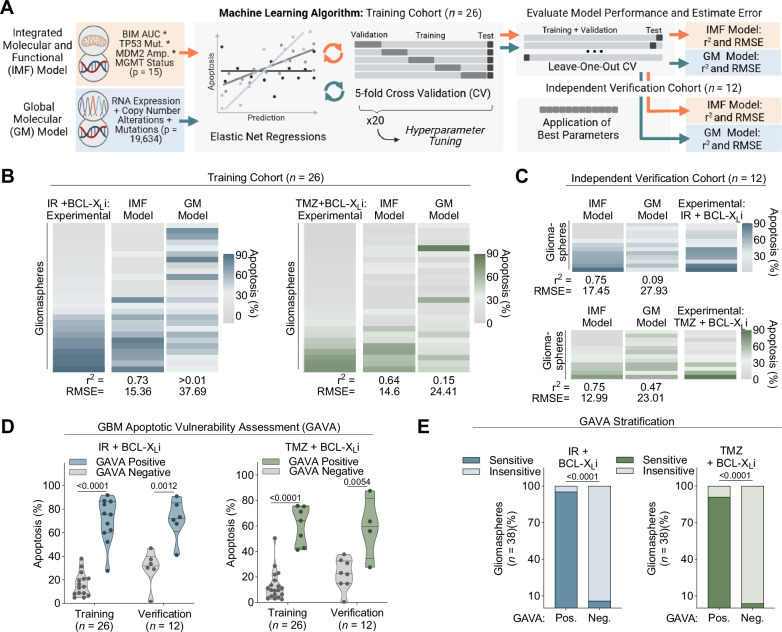
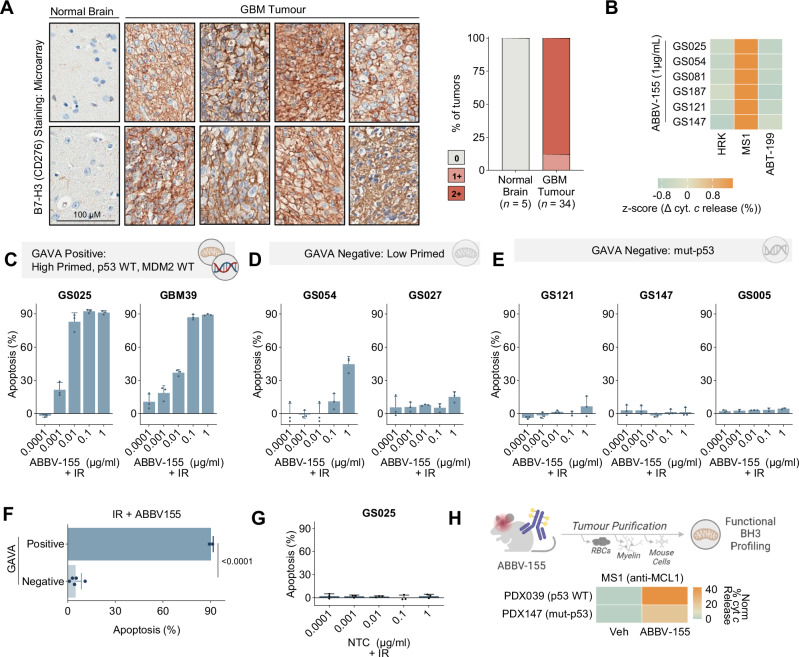
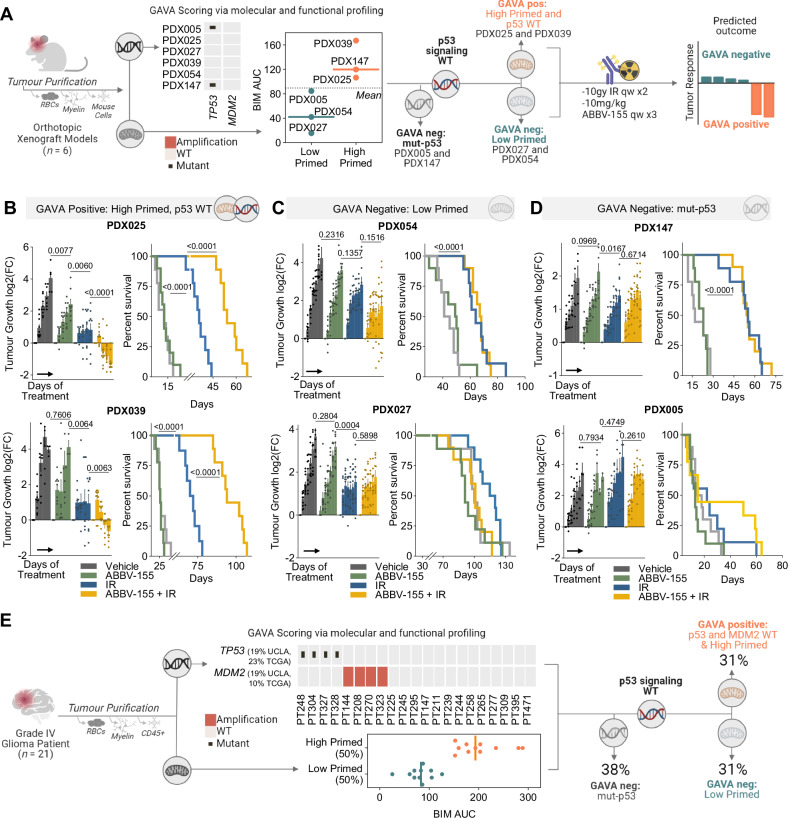
Genomic profiling often fails to predict therapeutic outcomes in cancer. This failure is, in part, due to a myriad of genetic alterations and the plasticity of cancer signaling networks. Functional profiling, which ascertains signaling dynamics, is an alternative method to anticipate drug responses. It is unclear whether integrating genomic and functional features of solid tumours can provide unique insight into therapeutic vulnerabilities. We perform combined molecular and functional characterization, via BH3 profiling of the intrinsic apoptotic machinery, in glioma patient samples and derivative models. We identify that standard-of-care therapy rapidly rewires apoptotic signaling in a genotype-specific manner, revealing targetable apoptotic vulnerabilities in gliomas containing specific molecular features (e.g., TP53 WT). However, integration of BH3 profiling reveals high mitochondrial priming is also required to induce glioma apoptosis. Accordingly, a machine-learning approach identifies a composite molecular and functional signature that best predicts responses of diverse intracranial glioma models to standard-of-care therapies combined with ABBV-155, a clinical drug targeting intrinsic apoptosis. This work demonstrates how complementary functional and molecular data can robustly predict therapy-induced cell death.


Conflict of interest statement

Competing interests: The authors declare the following competing interests, D.A.N. is a co-founder of Trethera Corporation and has equity in the company. D.A.N. and T.F.C. are co-founders of Katmai Pharmaceuticals and have equity in the company. T.G.G. has consulting and equity agreements with Auron Therapeutics, Boundless Bio, Coherus BioSciences and Trethera Corporation. E.G.F., W.X.M., K.S., N.A.B., J.K., H.Z., M.P., P.Y., C.L.A., D.C., L.M.L., G.L., W.H.Y., F.J.R., S.J.D., A.J.S., and J.J.L. have no competing interests to declare.

Figures

Fig. 1
Fig. 1. Multiomic characterisation of the intrinsic apoptotic machinery in glioma patient and patient-derived samples.
A Workflow describing tumour purification and subsequent molecular (whole-exome sequencing) and functional (BH3 profiling) characterisation of glioma patient samples (n = 31). Also see Supplementary Table 1. B Heat maps describing patient sample clinical characteristics, copy number alterations and mutations of gene frequently alerted in GBM and BH3 profiling of the apoptotic blocks. C BH3 profiling is plotted as a z-score across the sample. Peptide concentrations are as follows: ABT-199: 1 µM (anti BCL-2), MS1: 10 µM (anti MCL-1), HRK: 100 µM (anti BCL-XL), BAD: 10 µM (anti BCL-2 and BCL-XL). BH3 profiling of anti-apoptotic blocks in patient tumours and gliomaspheres. Dot plot displays % cytochrome c release as dot size and z-score as dot color (n = 31 and n = 26, two-tailed, paired t test compares HRK + MS1 to all conditions). Also see Supplementary Fig. 1B. D Example heatmaps of cell viability (Cell Titer Glo) after 48 hours. of treatment with combinations of ABT-199 (BCL-2i), A-1155463 (BCL-XLi), and S63856 (MCL-1i) in gliomaspheres GS028. BH3 mimetics concentrations are as follows: 0 nM, 3.9 nM, 15.6 nM, 62.5 nM, 250 nM, 1000 nM. E Bar graphs (mean ± s.d.) of zip synergy scores plotted as a z-scores for gliomaspheres (n = 26). Synergy scores calculated from cell viability (Cell Titer Glo) experiments with combinations of BH3 mimetics: ABT-199 (BCL-2i), A1155463 (BCL-XLi), and S63856 (MCL-1i) (mean ± s.d., n = 2 experimental replicates). F Box and whiskers plot (mean, hinges at 25th and 75th percentiles, ± min to max) of synergy scores for each gliomasphere (n = 26), grouped by combinations of BH3 mimetics (two-tailed, paired t test). G Heat map displays summarizes highest scoring combination of cell death and BH3 profiling data for the 26 gliomaspheres. Statistics calculated using the binomial test. p > 0.05 = ns; p < 0.05 = *p < 0.01 = **p < 0.001 = ***p < 0.0001 = ****. See also Table S1 and Figure S1.
Fig. 2
Fig. 2. IR creates an exclusive survival dependency on BCL-XL in p53 wild-type GBM.
A Box plots of radiation induced growth inhibition and apoptosis, each dot represents an individual gliomasphere and the mean of three biological replicates (mean ± s.d., two tailed, paired t test). B DBP post IR treatment of gliomaspheres. Heatmap displays copy number and mutations for EGFR, CDKN2A, PTEN and TP53. C Box plots show apoptosis post IR and/or BCL-XLi. Each dot represents a gliomasphere. Data were normalized to vehicle (median ± quartiles, two-tailed, unpaired t test). D shRNA used to reduce expression of BCL-XL. Apoptosis assessed after treatment with IR (mean ± s.d., unpaired t test with Welch correction, n = 3 biological replicates). E CRISPR guides were used to KO p53. DBP of KOs after IR treatment, shows change in precent cytochrome c release with HRK (mean ± s.d., unpaired t test with Welch correction, n = 2 biological replicates). F Apoptosis evaluated in p53 KOs, 5 days after treatment with BCL-XLi and/or IR (mean ± s.d., unpaired t test with Welch correction, n = 3 biological replicates). G Heat map shows change in precent cytochrome c release between mice irradiated with 10 Gy and untreated mice with HRK, MS1 and ABT-199 (n = 2 independent replicates). H shRNA KD of BCL-XL before cells were orthotopically implanted and irradiated with 10 Gy IR 3 days post injection. Bar plots display log2(fold-change) of tumour burden over time (mean ± SEM, n = 9 mice). Grouped comparisons made were made with two-tailed, unpaired t tests. I DBP post TMZ or TMZ + IR treatment of gliomaspheres. J Box plots show apoptosis with TMZ or TMZ + IR in combination with BCL-Xli (mean ± s.d., two tailed, paired t test). IR (5gy), TMZ (50 µM), BCL-XLi (A1155463: 0.5 µM). DBP Assessed at 48 hours, peptide concentrations: ABT-199: 1 µM, MS1: 10 µM, HRK: 100 µM. Apoptosis (Annexin V/PI) assessed at five days. All box plots: mean, hinges at 25th and 75th percentiles, ± min to max.
Fig. 3
Fig. 3. p53-mediated induction of PUMA ablates the MCL-1 block following IR or TMZ therapy.
A Immunoblots of MCL-1, PUMA and Noxa expression 48 hours post IR (5 Gy) or TMZ (50 µM) treatment, in 4 out the 20 gliomasphere lines assessed, all blots shown in Supplementary Fig. 3A. Dot plot of quantified immunoblots across p53 WT (n = 14) and mut-p53 (n = 6) gliomaspheres. One sample t test compares if p53 WT or mut-p53 changed relative to their vehicle gliomaspheres for all proteins assessed. Colors represent -log10 transformed p-values and dot sizes represent log2 transformed fold changes. log2 fold changes less than or equal 0.06 were set as the minimum for point sizes, and maximum -log10 p-value was set to 4 (p-value = 0.0001). For full immunoblots of all lines see Supplementary Fig. 3. These results were independently repeated. B PUMA expression in p53 KO models in GS025 and HK301, 48 hours post TMZ and IR treatment. C Immunoblots of GS025-shControl, shPUMA-1, and shPUMA-2, 48 hours after TMZ (50 µM) or IR (5 Gy) treatment. DBP of GS025-shControl, shPUMA-1, and shPUMA-2, 48 hours after TMZ (50 µM) or IR (5 Gy) treatment, shows change in precent cytochrome c release with HRK (100 µM) (mean ± s.d., unpaired t test with Welch correction, n = 2 biological replicates). D Apoptosis (Annexin V/PI + ) was evaluated in GS025-shControl, shPUMA-1, and shPUMA-2, 5 days after treatment with A1155463 (BCL-XLi: 0.5 µM), TMZ (50 µM), IR (5 Gy), TMZ + A1155463, or IR + A1155463 (mean ± s.d., unpaired t test with Welch correction, n = 3 biological replicates). E Co-immunoprecipitation of p53 WT gliomaspheres of BCL-XL or MCL-1 with PUMA following TMZ or IR. Gliomaspheres were treated for 48 hours with TMZ (50 µM) or IR (5 Gy). Signal quantification of PUMA determined relative to signal of MCL-1 or BCL-XL that was pulled down. These results were independently repeated. p > 0.05 = ns; p < 0.05 = *p < 0.01 = **p < 0.001 = ***p < 0.0001 = ****.
Fig. 4
Fig. 4. p53 genetic status alone cannot predict response to TMZ/IR in combination with BCL-XLi.
A Apoptosis (Annexin V/PI +) of gliomaspheres (n = 26) 5 days post IR (5 Gy) or TMZ (50 µM) and BCL-XLi (A1155463: 0.5 µM) treatment normalized to either IR or TMZ alone (mean ± s.d., n = 2 independent replicates). Response cutoff determined by taking the mean. Heat map below displays mutations or copy number alterations in TP53 or MDM2, respectively. MGMT status is determined using MGMT methylation and expression, see methods. B Grouped analysis of apoptosis visualized with box plots (mean, hinges at 25th and 75th percentiles, ± min to max) of all molecular biomarker positive vs negative gliomaspheres, sub-divided by response (n = 26), (two-tailed, unpaired t test). Darker coloring signifies responders identified in 4 A. C Basal BH3 profiling of gliomaspheres (n = 26) preformed with a titration of the BIM peptide (0 µM, 0.01 µM, 0.03 µM, 0.1 µM, 0.3 µM, 1 µM, 3 µM, 10 µM). Data points in the dynamic range (0.03 µM − 3 µM BIM, defined by peptides with the greatest range in responses) used to calculate area the AUC. Diagram depicts simplified examples of high and low primed gliomaspheres. D Grouped analysis of apoptosis visualized with box plots (mean, hinges at 25th and 75th percentiles, ± min to max) of all functional biomarker positive vs negative gliomaspheres, sub-divided by response (n = 26), (two-tailed, unpaired t test). Darker coloring signifies responders identified in 4 A. Correlations of BIMAUC with a simple linear regression between cell death induced by IR (E) or TMZ (F) and BCL-XLi, grey band represents with 95% confidence interval. Line represents simple linear regression, used to calculate p-value and r-squared. Summary bar plots describing the percent of correctly identified gliomaspheres sensitive to with the different biomarker stratification.
Fig. 5
Fig. 5. Development and predictability of integrated genomic and functional biomarker.
A Schematic outlining the machine learning algorithm developed to compare the Integrated Molecular and Functional (IMF) model with the Global Molecular (GM) model through elastic net regression subject to cross validation (methods section). B Training Cohort (n = 26 gliomaspheres): Heatmaps display experimental (IR(5 Gy) or TMZ(50 µM) + BCL-Xli(0.5 µM) and predicted values for either IMF or GM models, for each gliomasphere. R2 and RSME, used to estimate error of the model calculated for each model (methods section). C Independent Verification Cohort (n = 12 gliomaspheres): Heatmaps display experimental (IR or TMZ + BCL-Xli) and predicted values for either IMF or GM models, for each gliomasphere. R2 and RSME, used to estimate error of the model calculated for each model (methods section). D Grouped analysis of all GAVA positive vs GAVA negative gliomaspheres, for both the training and verification cohorts. IR (5 Gy) or TMZ (50 µM) + BCL-Xli(0.5 µM) cell death plotted as violon plots (two-tailed, unpaired t test). E GAVA stratification applied to both training and verification gliomaspheres (n = 38) (Fischer’s exact test).
Fig. 6
Fig. 6. ABBV-155 (Clezutoclax-B7-H3 ADC) targets BCL-XL in GBM.
A Immunohistochemistry staining for B7-H3 (CD276) in GBM (n = 34) and normal brain (n = 5) microarray. Representative images of two out of five normal brains and 8 out of 33 GBMs. Staining was scored as, 0 (negative in glial cells), 1+ (weakly positive) and 2+ (strongly positive). B DBP 72 hours post ABBV-155 (1 µg/mL) treatment of gliomaspheres (n = 6). Data plotted as z-score across sample showing change with treatment with single peptides relative to the double block (ΔHRK + MS1-ΔHRK/ΔMS1/ΔABT-199). Peptide concentrations are as follows: ABT-199: 1 µM, MS1: 10 µM, HRK: 100 µM. C Apoptosis (Annexin V/PI +) of GAVA positive gliomaspheres (p53 and MDM2 WT and high primed), GS025 and GBM39, 5 days post IR (5 Gy) and ABBV-155 titration. Concentration range: 0.0001 µg/mL, 0.001 µg/mL, 0.01 µg/mL, 0.1 µg/mL, 1 µg/mL. Data are normalized to R alone (n = 3 biological replicates). D Apoptosis (Annexin V/PI +) of GAVA negative gliomaspheres (low primed), GS054 and GS027, 5 days post IR (5 Gy) and ABBV-155 titration. Concentration range: 0.0001 µg/mL, 0.001 µg/mL, 0.01 µg/mL, 0.1 µg/mL, 1 µg/mL. Data are normalized to R alone (n = 3 biological replicates). E Apoptosis (Annexin V/PI +) of GAVA negative gliomaspheres (mut-p53), GS121, GS147 and GS005, 5 days post IR (5 Gy) and ABBV-155 titration. Concentration range: 0.0001 µg/mL, 0.001 µg/mL, 0.01 µg/mL, 0.1 µg/mL, 1 µg/mL. Data are normalized to R alone (n = 3 biological replicates). F Grouped analysis by GAVA status of all IR + 0.1 µg/mL ABBV-155 cell death data (mean ± s.d., two-tailed, n = 7 gliomaspheres). G Apoptosis (Annexin V/PI +) of p53 WT gliomaspheres, GS025, 5 days post IR (5 Gy) and Non-Targeting Control (NTC). Concentration range: 0.0001 µg/mL, 0.001 µg/mL, 0.01 µg/mL, 0.1 µg/mL, 1 µg/mL. Data are normalized to IR alone (n = 3 biological replicates). H PDX039 (p53WT) and PDX147 (mut-p53) were treated with ABBV-155 (10 mg/kg, i.p., qw). 10 days later purified tumour cells were used to perform ex-vivo DBP. Data indicate a change in cytochrome c release between ABBV-155 treated and vehicle untreated mice with MS1(MCL1 - 10 µM) (n = 2 xenografts).
Fig. 7
Fig. 7. Integration of genomic and functional profiling predicts tumour response to IR + ABBV-155.
A Workflow describing GAVA application of GBM orthotopic xenografts (n = 6) to predict response to IR and ABBV-155. Scatter dot plots show the BIMAUC from ex vivo basal BH3 profiling of indicated untreated orthotopic xenografts. Designation as high and low primed determined by the median of the ex vivo samples. The following schematic details experiment workflow and treatment schedule, followed by predicted response by GAVA status. B, C Assessment of changes in GAVA positive (B), GAVA Negative (low primed) (C), and GAVA Negative (p53 mutant) (D) PDX tumour growth of mice treated with vehicle, ABBV-155 (10 mg/kg, i.p. qw x 3), IR (10 Gy, qw x 2), or the combination of ABBV-155 and IR. Fold change in tumour burden relative to size at enrollment displayed for all models (mean ± SEM, n = 10 SDX025, SDX054, SDX027, SDX147, SDX005, n = 9 SDX-GBM39). Grouped comparisons made were made with two-tailed,unpaired t tests using data sets from the last measurements. Percentage survival of orthotopic xenografts after the indicated treatments. Comparisons made using Log-rank (Mantel-Cox) test. E Workflow describing GAVA application on grade 4 patient samples (n = 21). Heat map shows mutations and amplifications for TP53 and MDM2. Scatter dot plots show the BIMAUC from the ex-vivo basal BH3 profiling of patient tumours. Designation as high and low primed determined using the median of the patient tumour samples.

References

    1. Vogelstein, B. et al. Cancer genome landscapes. Science (1979)340, 1546–1558 (2013). - PMC - PubMed
    1. Uhlen, M. et al. A pathology atlas of the human cancer transcriptome. Science (1979)357, (2017). - PubMed
    1. Poeta, M. L. et al. TP53 Mutations and Survival in Squamous-Cell Carcinoma of the Head and Neck. N. Engl. J. Med.357, 2552–2561 (2007). - DOI - PMC - PubMed
    1. Rosell, R. et al. Erlotinib versus standard chemotherapy as first-line treatment for European patients with advanced EGFR mutation-positive non-small-cell lung cancer (EURTAC): A multicentre, open-label, randomised phase 3 trial. Lancet Oncol.13, 239–246 (2012). - DOI - PubMed
    1. le Tourneau, C. et al. Molecularly targeted therapy based on tumour molecular profiling versus conventional therapy for advanced cancer (SHIVA): A multicentre, open-label, proof-of-concept, randomised, controlled phase 2 trial. Lancet Oncol.16, 1324–1334 (2015). - DOI - PubMed

Publication types

MeSH terms

Substances