. 2024 Nov 21;15(1):10091.
doi: 10.1038/s41467-024-54376-x.

Astrocytic inhibition of lateral septal neurons promotes diverse stress responses

Affiliations

Astrocytic inhibition of lateral septal neurons promotes diverse stress responses

Kain Seo et al. Nat Commun. .

Abstract

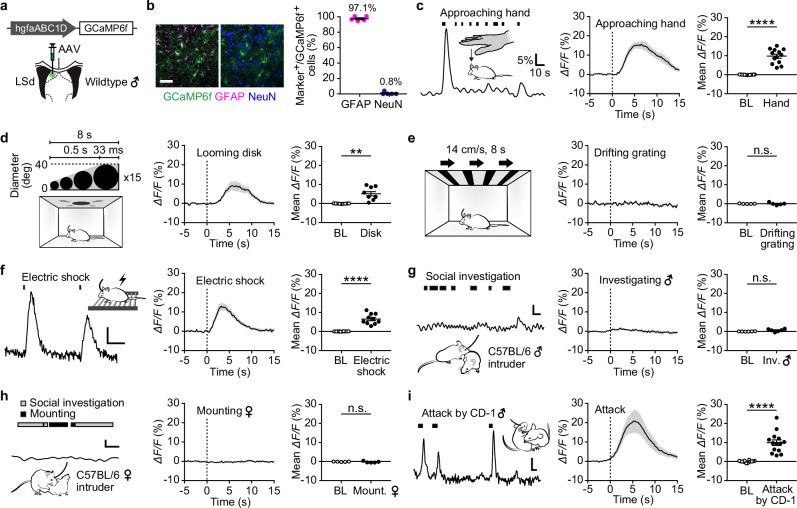
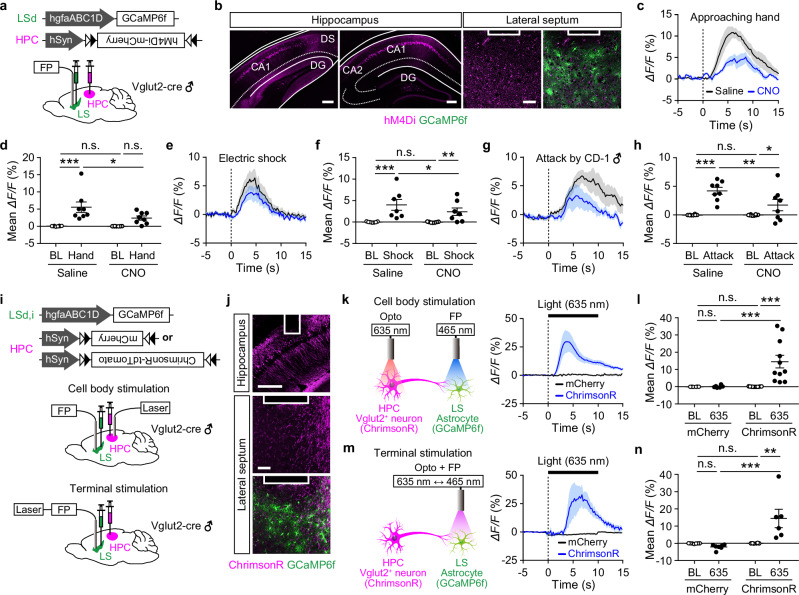
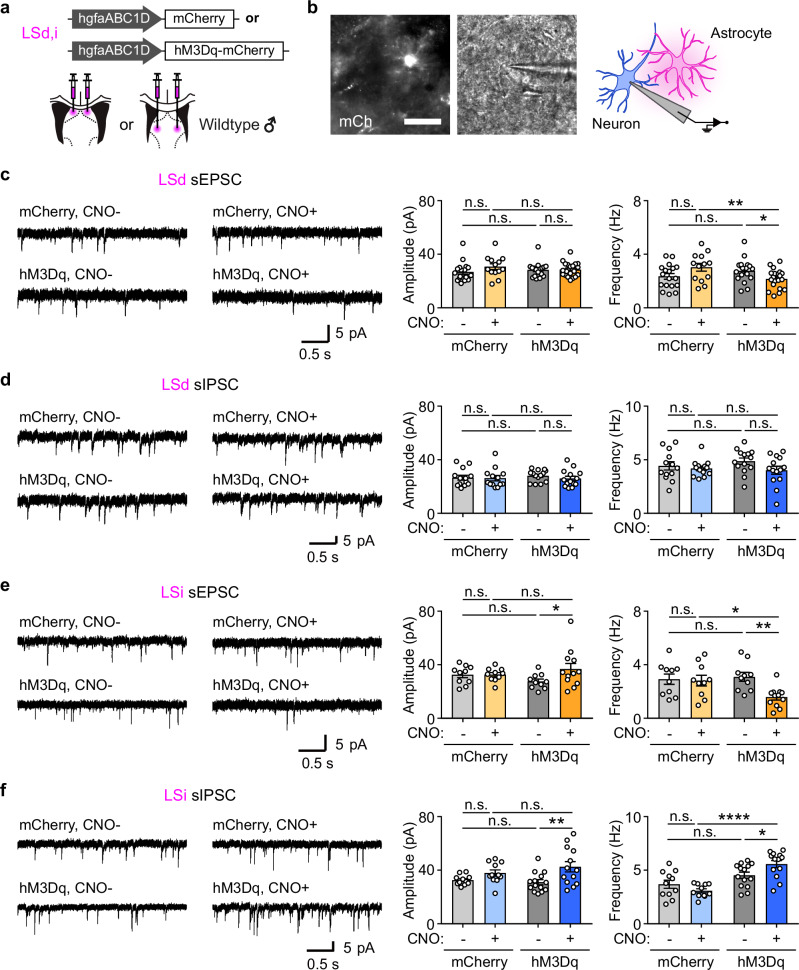
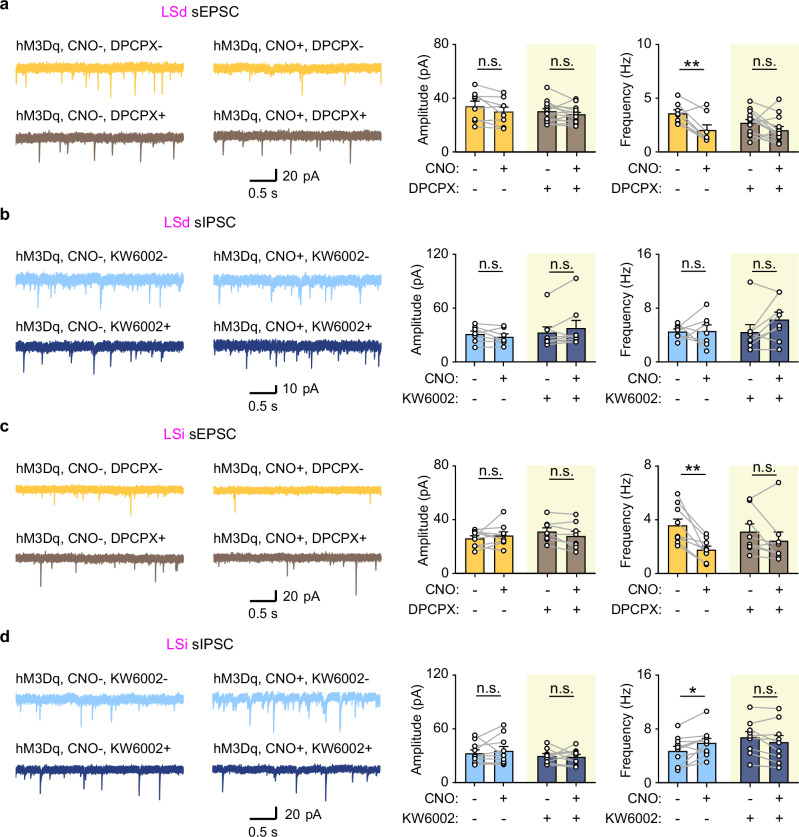
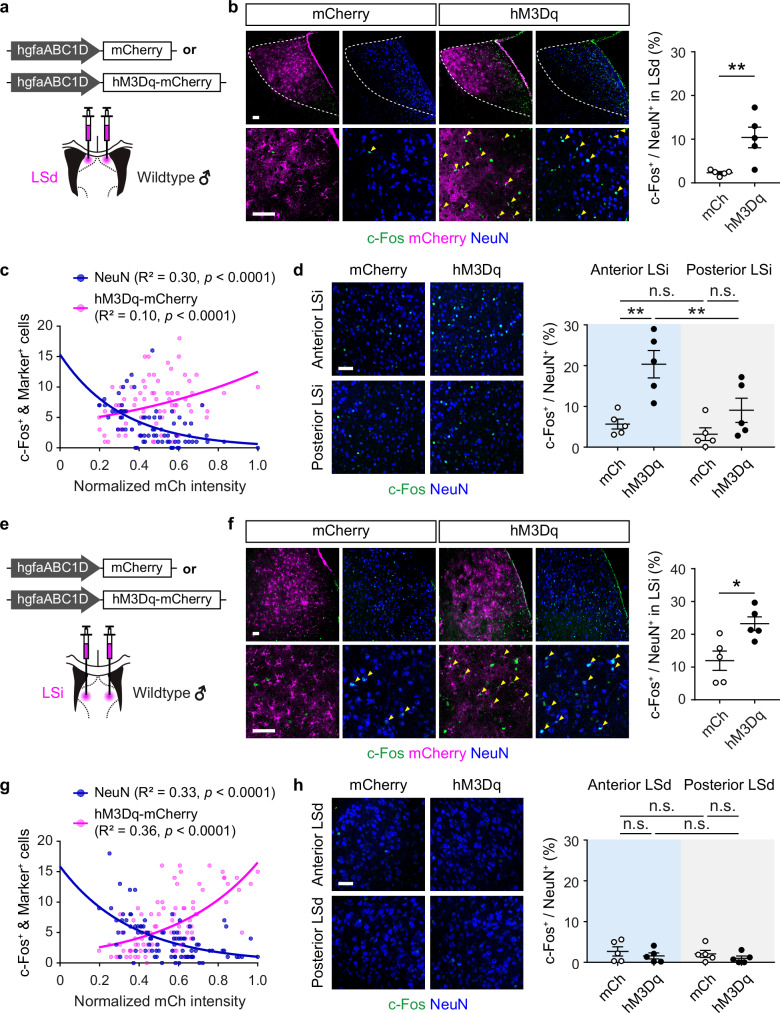
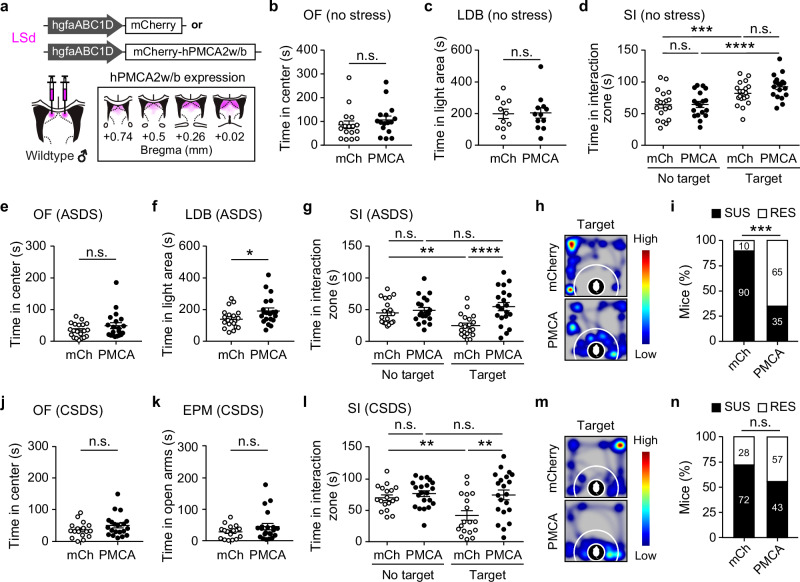
Inhibitory neuronal circuits within the lateral septum (LS) play a key role in regulating mood and stress responses. Even though glial cells can modulate these circuits, the impact of astrocytes on LS neural circuits and their functional interactions remains largely unexplored. Here, we demonstrate that astrocytes exhibit increased intracellular Ca²⁺ levels in response to aversive sensory and social stimuli in both male and female mice. This astrocytic Ca²⁺ elevation inhibits neighboring LS neurons by reducing excitatory synaptic transmissions through A1R-mediated signaling in both the dorsal (LSd) and intermediate LS (LSi) and enhancing inhibitory synaptic transmission via A2AR-mediated signaling in the LSi. At the same time, astrocytes reduce inhibitory tone on distant LS neurons. In the LSd, astrocytes promote social avoidance and anxiety, as well as increased heart rate in socially stressed male mice. In contrast, astrocytes in the LSi contribute to elevated heart rate and heightened blood corticosterone levels in unstressed male mice. These results suggest that the dynamic interactions between astrocytes and neurons within the LS modulate physiological and behavioral responses to stressful experiences.


Conflict of interest statement

Competing interests: The authors declare no competing interests.

Figures

Fig. 1
Fig. 1. LS astrocytes respond to specific aversive sensory and social stimuli in vivo.
An AAV expressing GCaMP6f under the control of the hgfaABC1D promoter was injected into the LS of wildtype mice resulting in the selective expression of GCaMP6f (green) in GFAP+ astrocytes (magenta) but not in NeuN+ neurons (blue) (a). Quantification of overlap obtained from 3 sections per mouse, across 5 mice (b). Intracellular Ca2+ levels in LSd astrocytes in response to various stimuli: an approaching hand (c), looming disk (d), drifting grating (e), electric shock (f), investigation of a male intruder (g), investigation and mounting of a female intruder (h), and attack by a CD-1 male intruder (i). In each set of panels, the first panel includes a representative Ca2+ trace (c, fi) or a stimulus protocol (d, e). The second panel displays an averaged Ca2+ trace with the stimulus applied at 0 s, indicated by a vertical dotted line. The third panel shows the mean ΔF/F at baseline (BL, open circles) and after the stimulus (filled circles). Scale bar, 50 μm. The number of samples and the associated statistical details are listed in Supplementary Data 1. Source data are available in the Source Data file. **p  <  0.01, ****p  <  0.0001, n.s., not significant. The data are presented as the mean ± SEM.
Fig. 2
Fig. 2. Hippocampal inputs to the LS are required for Ca2+ responses in LS astrocytes.
Fiber photometric recording (FP) of LS astrocytes in Vglut2-cre mice expressing cre-dependent hM4Di-mCherry in the hippocampus (HPC) and GCaMP6f in LS astrocytes (a). The native fluorescence of hM4Di-mCherry in neuronal cell bodies in the hippocampus and their nerve terminals in the LS (magenta) and that of GCaMP6f in LS astrocytes (green). The experiment was repeated independently 8 times. b The white box in the images indicates cannula damage. Averaged Ca2+ traces and the mean ΔF/F of LS astrocytes elicited by an approaching hand (c, d), electric shock (e, f), or attack by a CD-1 male (g, h) at baseline (BL) and during-after the application of the indicated stimulus. Saline or CNO was administered 30 min before the onset of the stimulus at 0 s. Fiber photometric recordings of Vglut2-cre mice expressing cre-dependent mCherry or ChrimsonR-tdTomato (ChrimsonR) in the hippocampus and GCaMP6f in LS astrocytes (i). ChrimsonR expression in neuronal cell bodies in the hippocampus and in their nerve terminals in the LS (magenta) and GCaMP6f expression in LS astrocytes (green). The experiment was repeated independently 11 times. (j). The white box in the images indicates cannula damage. An averaged Ca2+ trace and the mean ΔF/F of LS astrocytes before (BL) and during photostimulation of the hippocampal cell bodies (k, l) or nerve terminals in the LS (m, n) with red light at 635 nm starting at 0 s. Scale bars, 200 μm (HPC) and 50 μm (LS). The number of samples and the associated statistical details are listed in Supplementary Data 1. Source data are available in the Source Data file. *p  <  0.05, **p  <  0.01, ***p  <  0.001, n.s., not significant. The data are presented as the mean ± SEM.
Fig. 3
Fig. 3. Astrocytes exert inhibitory influences on neighboring neurons by regulating synaptic transmissions in the LS.
Voltage-clamp recordings of LS neurons in acute septal slices expressing mCherry or hM3Dq in LS astrocytes. Schematic showing AAV injection into either LSd or LSi (a). A brain slice displaying an astrocyte expressing mCherry alongside a neuron recorded using a patch pipette. The experiment was repeated independently 20 times (b). Representative traces and quantification of the amplitude and frequency of sEPSCs and sIPSCs recorded from neighboring LSd neurons (c, d) and LSi neurons (e, f). Scale bars, 50 μm. The number of samples and the associated statistical details are listed in Supplementary Data 1. Source data are available in the Source Data file. *p  <  0.05, **p <  0.01, ****p <  0.0001, n.s., not significant. The data are presented as the mean ± SEM.
Fig. 4
Fig. 4. Astrocytic modulation of synaptic transmissions in the LS is mediated by adenosine receptors.
Voltage-clamp recordings of LS neurons in acute septal slices expressing hM3Dq in LS astrocytes. Representative traces, along with quantification of the amplitude and frequency of sEPSCs and sIPSCs, were recorded from LSd neurons (a, b) and LSi neurons (c, d) adjacent to hM3Dq-expressing astrocytes. Note that DPCPX, the A1R antagonist, reduces the astrocytic manipulation-induced reduction in sEPSC frequency in LSd and LSi neurons (a, c), while KW6002, the A2AR antagonist, prevents the astrocytic manipulation-induced increase in sIPSC frequency in LSi neurons only (b, d). The number of samples and the associated statistical details are listed in Supplementary Data 1. Source data are available in the Source Data file. *p  <  0.05, **p <  0.01, n.s., not significant. The data are presented as the mean ± SEM.
Fig. 5
Fig. 5. LS astrocytes induce neuronal c-Fos in LS regions where hM3Dq expression is low or absent.
The AAV hgfaABC1D-mCherry (mCh) or hM3Dq-mCherry (hM3Dq) was injected into either the LSd (a) or LSi (e) of wild-type mice. c-Fos expression elicited by astrocytic manipulation in targeted regions (b, f). Native fluorescence of mCherry and hM3Dq-mCherry in LS astrocytes (magenta) and immunoreactivities of c-Fos (green) and NeuN (blue) in the LSd (b, left) and LSi (f, left). Arrows indicate c-Fos+ cells that overlapped with mCherry or NeuN. Quantification of c-Fos+ neurons in the whole LSd (b, right) and LSi (f, right). The correlation between hM3Dq-mCherry fluorescence intensity and the number of c-Fos+ astrocytes (hM3Dq-mCherry, magenta) or neurons (NeuN, blue) was assessed via Poisson regression modeling (c, g). R2 is the coefficient of determination. Neuronal c-Fos was induced in the neighboring region that was not targeted by the virus (d, h). Note that only chemogenetic manipulation of LSd astrocytes induced c-Fos expression in the LSi, not vice versa. Anterior LSi or LSd (bregma 0.8-0.4 mm), posterior LSi or LSd (bregma 0.4-0.0 mm). Scale bars, 50 μm. The number of samples and the associated statistical details are listed in Supplementary Data 1. Source data are available in the Source Data file. *p  <  0.05, **p <  0.01, n.s., not significant. The data are presented as the mean ± SEM.
Fig. 6
Fig. 6. Astrocytes contribute to specific aspects of stress responses depending on their subregional localization in the LS.
The AAV hgfaABC1D-mCherry (mCh) or hM3Dq-mCherry (hM3Dq) was injected into the LSi or LSd of wild-type mice (a, i). The representative viral expression of hM3Dq is indicated in the brain images (a, i, magenta). Heart rate (b, j), blood corticosterone level (c, k), and marble burying behavior (d, l) in unstressed mice. Anxiety-like behaviors (e, f, m, n) and social interaction (SI, g, h, o, p) were assessed in mice previously subjected to subthreshold social defeat stress (SSDS). The percentage of mice exhibiting an SI ratio < 1 (susceptible, SUS) or an SI ratio ≥ 1 (resilient, RES) among mice treated with SSDS (h, p). c-Fos was induced by hM3Dq-mediated manipulation of LSd astrocytes in the absence (Control) or presence (SSDS) of SSDS (q, left). Quantification of c-Fos (green) expression in neurons (NeuN, blue) (q, right). The correlation between mCherry fluorescence intensity (SSDS only, mCherry in LSd astrocytes, black; hM3Dq in LSd astrocytes, cyan; SSDS and hM3Dq, magenta) and the number of c-Fos+ neurons, as determined by Poisson regression modeling (r). R2 is the coefficient of determination. Scale bars, 50 μm. The number of samples and the associated statistical details are listed in Supplementary Data 1. Source data are available in the Source Data file. *p  <  0.05, **p  <  0.01, ***p  <  0.001, ****p  <  0.0001, n.s., not significant. The data are presented as the mean ± SEM.
Fig. 7
Fig. 7. Astrocytes in the LSd are necessary for social avoidance caused by acute and chronic social defeat stress.
hPMCA2w/b (PMCA) or control mCherry (mCh) was expressed in LSd astrocytes (a). The representative hPMCA2w/b-expressing area is depicted in magenta in the brain images. The behavioral effects of hPMCA2w/b expression in unstressed mice (bd, no stress) and mice subjected to acute social defeat stress (ei, ASDS) or chronic social defeat stress (jn, CSDS) were assessed via the open field test (OF, b, e, j), light-dark box test (LDB, c, f), elevated plus maze test (EPM, k), and social interaction test (SI, d, gi, ln). A representative heatmap illustrating the time a subject mouse spent in compartments in the social interaction test (h, m). The percentage of mice susceptible (SUS) or resilient (RES) to social defeat stress (i, n). The number of samples and the associated statistical details are listed in Supplementary Data 1. Source data are available in the Source Data file. *p  <  0.05, **p  <  0.01, ***p  <  0.001, ****p  <  0.0001, n.s., not significant. The data are presented as the mean ± SEM.

References

    1. O’Connor, D. B., Thayer, J. F. & Vedhara, K. Stress and health: A review of psychobiological processes. Annu. Rev. Psychol.72, 663–688 (2021). - PubMed
    1. Ménard, C., Hodes, G. E. & Russo, S. J. Pathogenesis of depression: Insights from human and rodent studies. Neurosci.321, 138–162 (2016). - PMC - PubMed
    1. Pitman, R. K. et al. Biological studies of post-traumatic stress disorder. Nat. Rev. Neurosci.13, 769–787 (2012). - PMC - PubMed
    1. De Kloet, E. R., Joëls, M. & Holsboer, F. Stress and the brain: from adaptation to disease. Nat. Rev. Neurosci.6, 463–475 (2005). - PubMed
    1. Sheehan, T. P., Chambers, R. A. & Russell, D. S. Regulation of affect by the lateral septum: implications for neuropsychiatry. Brain Res. Rev.46, 71–117 (2004). - PubMed

Publication types