. 2024 Nov 21;15(1):10079.
doi: 10.1038/s41467-024-54501-w.

An evolutionarily conserved metabolite inhibits biofilm formation in Escherichia coli K-12

Affiliations

An evolutionarily conserved metabolite inhibits biofilm formation in Escherichia coli K-12

Jingzhe Guo et al. Nat Commun. .

Abstract

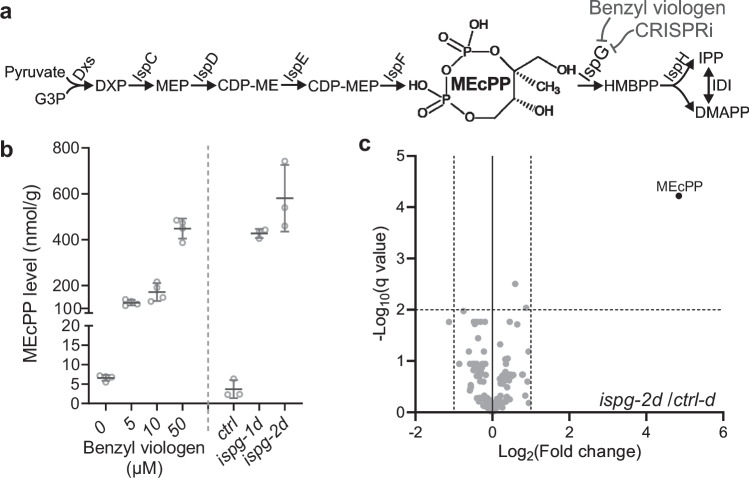
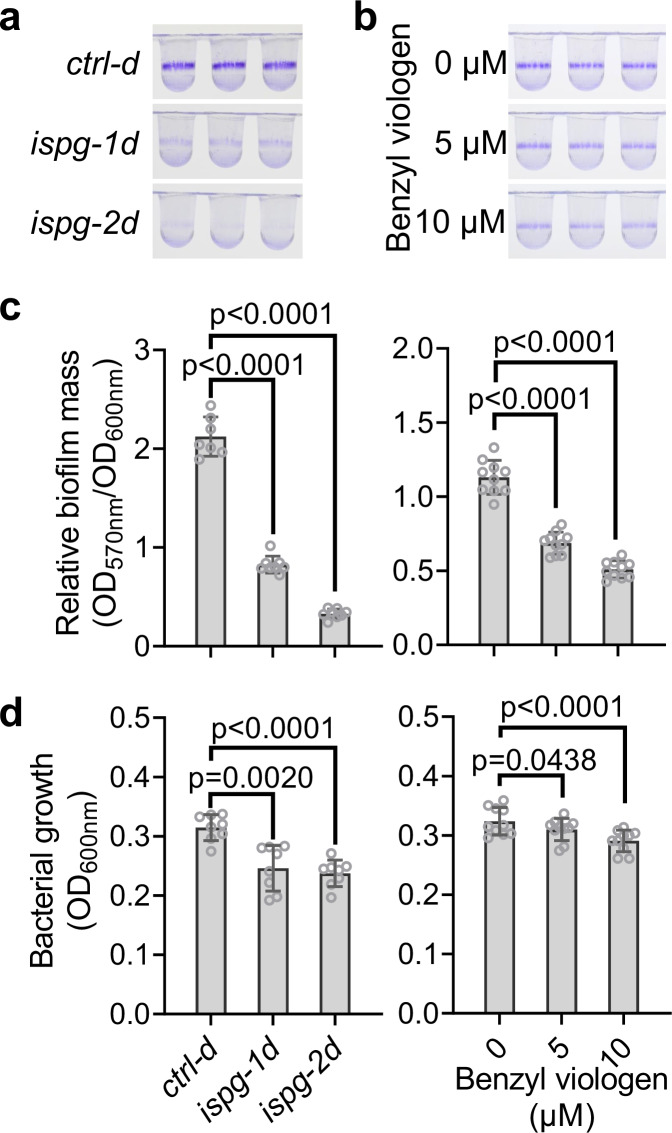
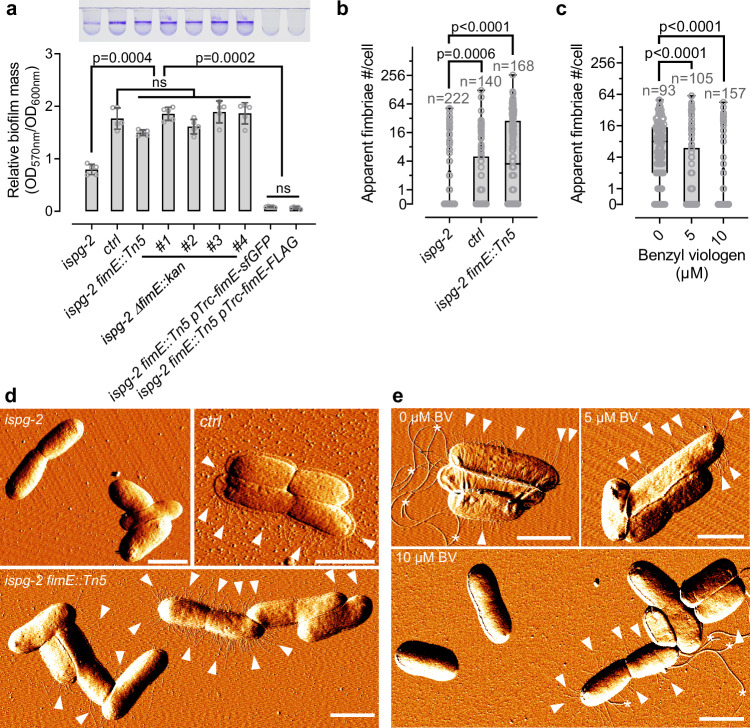
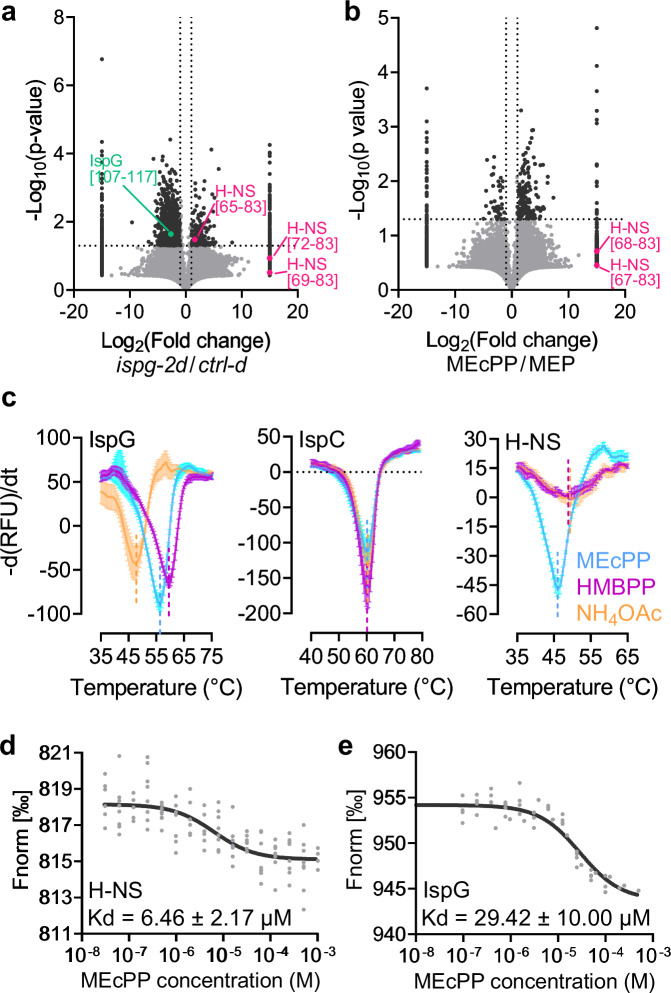
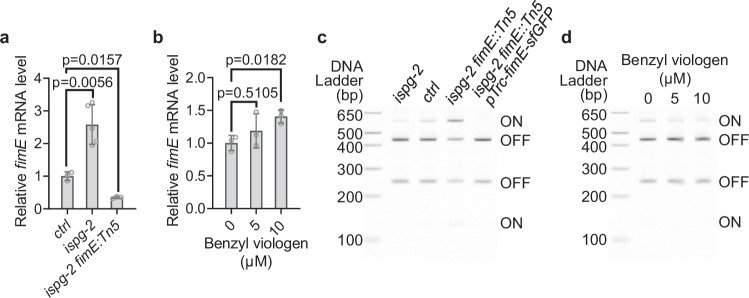
Methylerythritol cyclodiphosphate (MEcPP) is an intermediate in the biosynthesis of isoprenoids in plant plastids and in bacteria, and acts as a stress signal in plants. Here, we show that MEcPP regulates biofilm formation in Escherichia coli K-12 MG1655. Increased MEcPP levels, triggered by genetic manipulation or oxidative stress, inhibit biofilm development and production of fimbriae. Deletion of fimE, encoding a protein known to downregulate production of adhesive fimbriae, restores biofilm formation in cells with elevated MEcPP levels. Limited proteolysis-coupled mass spectrometry (LiP-MS) reveals that MEcPP interacts with the global regulatory protein H-NS, which is known to repress transcription of fimE. MEcPP prevents the binding of H-NS to the fimE promoter. Therefore, our results indicate that MEcPP can regulate biofilm formation by modulating H-NS activity and thus reducing fimbriae production. Further research is needed to test whether MEcPP plays similar regulatory roles in other bacteria.


Conflict of interest statement

Competing interests: The authors declare no competing interests.

Figures

Fig. 1
Fig. 1. Enhanced MEcPP levels in E. coli via genetic manipulation and oxidative stress.
a Simplified schematics of the MEP pathway in E. coli, demonstrating the accumulation of MEcPP, with chemical structure superimposed, using two methods: benzyl viologen application to inhibit IspG activity or CRISPRi-mediated reduction of ispG expression. b Measurement of MEcPP concentrations in E. coli exposed to varying concentrations of benzyl viologen or CRISPRi constructs targeting ispG (ispg-1d, ispg-2d), compared to a control (ctrl-d). Scatter dots depict raw data points for 3 to 4 independent biological replicates per sample group. The overlaid horizontal lines indicate the mean value and the error bars show the standard deviation. c Volcano plot analysis displaying fold changes in metabolite abundance within the central carbon and energy metabolism of the MEcPP-enriched strain (ispg-2d) versus the control (ctrl-d). MEcPP (depicted as a black dot) is identified as the sole significantly altered metabolite through unpaired t tests (two-tailed). Source data are provided in a Source Data file.
Fig. 2
Fig. 2. Inverse relationship between MEcPP levels and biofilm formation.
a, b Visualization of biofilms produced by CRISPRi strains (a), and MG1655 cells statically grown at room temperature in media with increasing concentrations of benzyl viologen (b), using crystal violet staining. c, d Analysis of relative biofilm mass calculated by the ratio between the OD570nm of dissolved crystal violet-stained biofilm and the OD600nm of planktonic cells at the time of staining (c) and bacterial growth measured at OD600nm (d). The results are derived from three biological replicates per genotype or treatment, and each biological replicate includes at least two technical replicates. Bars represent the mean value, and error bars show the standard deviations. Statistical tests used include Brown-Forsythe and Welch ANOVA and two-sided Dunnett’s multiple comparisons tests (CRISPRi strains) and RM one-way ANOVA tests with the Geisser-Greenhouse correction and two-sided Dunnett’s multiple comparisons tests (BV treatment). Source data are provided in a Source Data file.
Fig. 3
Fig. 3. Identification of a fimE mutant reverting biofilm formation despite high MEcPP levels.
a Biofilm production assessed in the high-MEcPP accumulating strain ispg-2, fimE transposon-insertion revertant ispg-2 fimE::Tn5 and knockout mutants ispg-2 ∆fimE::kan, fimE overexpression strains ispg-2 fimE::Tn5 pTrc-fimE-sfGFP and ispg-2 fimE::Tn5 pTrc-fimE-FLAG. The upper panel displays crystal violet-visualized biofilm in PVC tubes, while the lower panel shows relative biofilm mass calculated as the ratio between the OD570nm of dissolved crystal violet-stained biofilm and the OD600nm of planktonic cells at the time of staining. The data are obtained from three biological replicates per genotype, with each biological replicate containing one or two technical replicates. Bars represent mean values, and error bars represent standard deviations. be AFM imaging and statistical analyses of fimbriae production examined in CRISPRi strains and the ispg-2 fimE::Tn5 revertant (d), as well as in the MG1655 strain grown in increasing concentrations of benzyl viologen (e). Panels (b and c) display box and whisker plots of the apparent number of fimbriae outside of the aforementioned E. coli cells. The box represents the interquartile range from the 25th to 75th percentiles, with a horizontal line inside indicating the median value; the whiskers extend to the minimum and maximum values in the data, and all individual data points are depicted as dots. The apparent number of fimbriae is counted across all cells within a minimum of six 50 × 50 µm imaging fields, using slides from two biological replicates per genotype. Statistical tests used are Brown-Forsythe and Welch ANOVA and two-sided Dunnett’s multiple comparisons tests (a) and Kruskal-Wallis ANOVA and two-sided Dunn’s multiple comparisons tests (b, c). Panels (d and e) show representative AFM images of the analyzed cells, with white arrowheads pointing at clusters of fimbriae and white asterisks denoting flagella, with scale bars indicating 2 µm. Source data are provided in a Source Data file.
Fig. 4
Fig. 4. MEcPP interacts with H-NS, a transcriptional repressor of fimE.
a, b Two independent LiP-MS analyses show differentially represented peptide features in the high-MEcPP ispg-2d and the control ctrl-d strains (a) and in wild-type E. coli total protein treated with MEcPP or MEP. The volcano plot displays log10-transformed p-values (two-tailed, unpaired t tests) against log2-transformed fold changes in normalized LiP peptide abundance between ispg-2d and ctrl-d strains (a), and between MEcPP- and MEP-treated total proteins (b). Significantly altered features (more than 2-fold change and p < 0.05, or nondetected in one group) are depicted in black, with purple dots highlighting overrepresented peptide features of H-NS in the high-MEcPP strain ispg-2d and MEcPP-treated wild-type total proteins. A green dot in (a) represents the underrepresented peptide feature of IspG in the ispg-2d strain. c Protein thermal shift assay demonstrates a shift in the melting temperature of H-NS in the presence of MEcPP, but not its analog HMBPP or NH4OAc. IspC and IspG serve as negative and positive controls, respectively. Error bars represent the standard deviation, based on data from three technical replicates. Similar results were observed in two additional experiments. d, e Binding affinity determination of H-NS (d) and IspG (e) with MEcPP assessed by microscale thermophoresis. Source data are provided in a Source Data file.
Fig. 5
Fig. 5. MEcPP derepresses fimE transcription.
a, b Relative expression levels of fimE assessed in CRISPRi strains and ispg-2 fimE::Tn5 revertant (a), as well as in MG1655 cells grown in increasing concentrations of benzyl viologen (b). Bars represent the mean value, and error bars show the standard deviations. Statistical analyses used are Brown-Forsythe and Welch ANOVA and two-sided Dunnett’s multiple comparisons tests. The data are obtained from at least three biological replicates per genotype or treatment, with each biological replicate comprising two technical replicates. c, d Polyacrylamide gel visualization of the relative abundance of the ON and OFF phases in the fimA promoter in CRISPRi strains, the ispg-2 fimE::Tn5 revertant, and the fimE overexpressor in the revertant (ispg-2 fimE::Tn5 pTrc-fimE-sfGFP) (d), as well as in MG1655 strains grown in increasing concentrations of benzyl viologen (d). HinfI restriction digestion of the amplified fimA promoter generates differential band patterns, visualizing the ON (520 bp + 124 bp) and OFF (405 bp and 239 bp) phases of the promoter. Consistent results in (c and d) were confirmed in 2 additional experiments. Source data are provided in a Source Data file.

Similar articles

Cited by

References

    1. Stoodley, P., Sauer, K., Davies, D. G. & Costerton, J. W. Biofilms as complex differentiated communities. Annu. Rev. Microbiol.56, 187–209 (2002). - PubMed
    1. Park, S. & Sauer, K. Controlling biofilm development through cyclic di-GMP signaling. Adv. Exp. Med. Biol.1386, 69–94 (2022). - PMC - PubMed
    1. Boyd, C. D. O’Toole GA. Second messenger regulation of biofilm formation: breakthroughs in understanding c-di-GMP effector systems. Annu. Rev. Cell Dev. Biol.28, 439–462 (2012). - PMC - PubMed
    1. Teschler, J. K., Nadell, C. D., Drescher, K. & Yildiz, F. H. Mechanisms underlying vibrio cholerae biofilm formation and dispersion. Annu. Rev. Microbiol.76, 503–532 (2022). - PubMed
    1. Jenal, U., Reinders, A. & Lori, C. Cyclic di-GMP: second messenger extraordinaire. Nat. Rev. Microbiol.15, 271–284 (2017). - PubMed

Publication types

MeSH terms

Associated data

LinkOut - more resources