. 2024 Nov 21;14(1):28896.
doi: 10.1038/s41598-024-77821-9.

Vulnerability of Arctic Ocean microbial eukaryotes to sea ice loss

Affiliations

Vulnerability of Arctic Ocean microbial eukaryotes to sea ice loss

Victoria L N Jackson et al. Sci Rep. .

Abstract

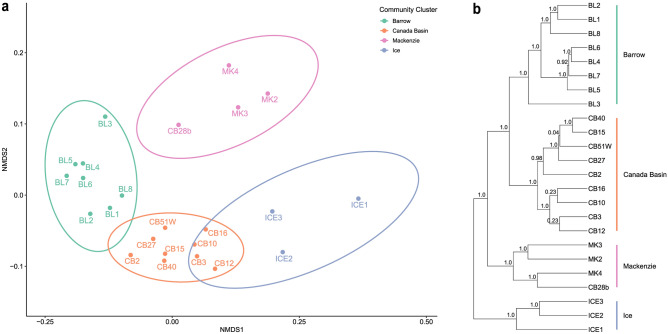
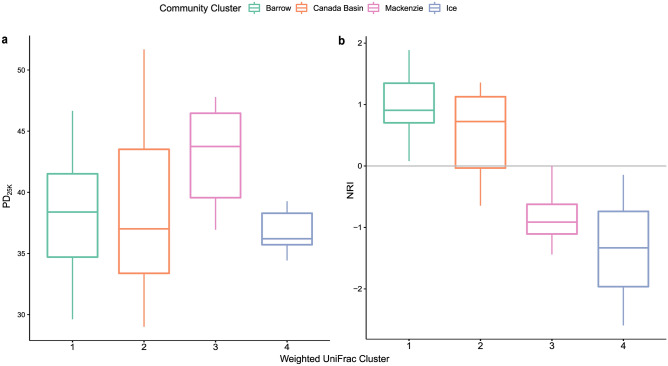
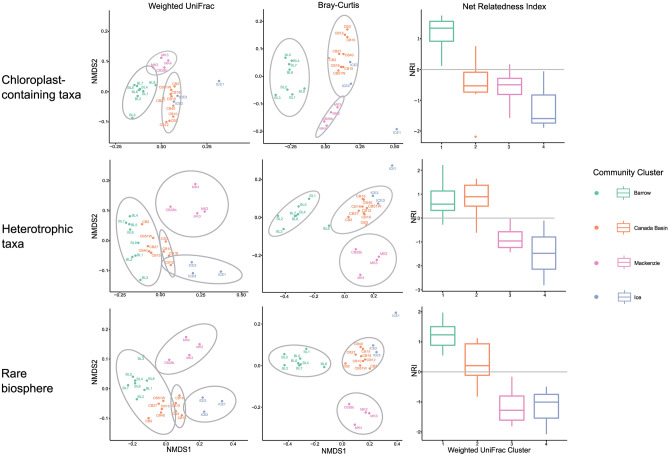
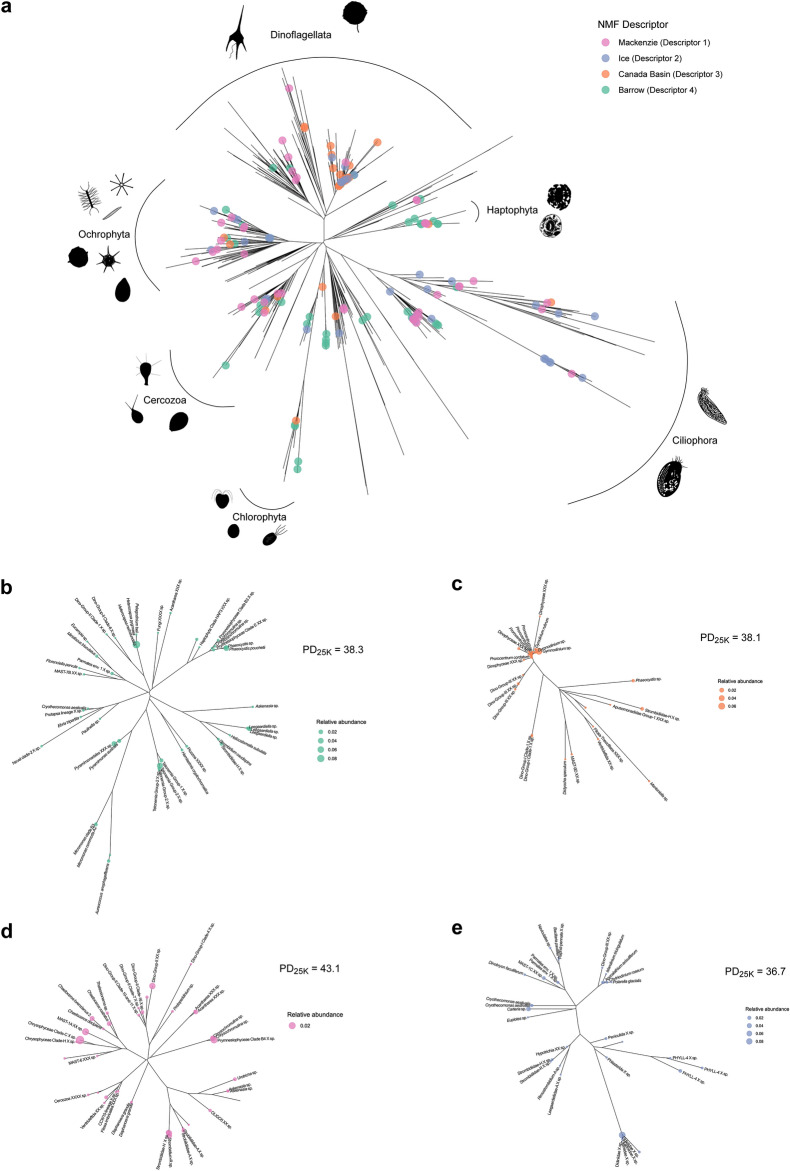
The Arctic Ocean (AO) is changing at an unprecedented rate, with ongoing sea ice loss, warming and freshening impacting the extent and duration of primary productivity over summer months. Surface microbial eukaryotes are vulnerable to such changes, but basic knowledge of the spatial variability of surface communities is limited. Here, we sampled microbial eukaryotes in surface waters of the Beaufort Sea from four contrasting environments: the Canada Basin (open ocean), the Mackenzie Trough (river-influenced), the Nuvuk region (coastal) and the under-ice system of the Canada Basin. Microbial community structure and composition varied significantly among the systems, with the most phylogenetically diverse communities being found in the more coastal systems. Further analysis of environmental factors showed potential vulnerability to change in the most specialised community, which was found in the samples taken in water immediately beneath the sea ice, and where the community was distinguished by rare species. In the context of ongoing sea ice loss, specialised ice-associated microbial assemblages may transition towards more generalist assemblages, with implications for the eventual loss of biodiversity and associated ecosystem function in the Arctic Ocean.


Conflict of interest statement

Declarations. Competing interests: The authors declare no competing interests.

Figures

Fig. 1
Fig. 1
Sampling area and environmental conditions. (a) Map of the Beaufort Sea and sampling stations, with average sea ice concentration and notable oceanographic features overlaid. Approximate locations of the Beaufort Gyre, Barrow Canyon and Mackenzie Trough are indicated, and the Mackenzie River is also labelled. Stations are labelled according to the environmental clustering in Fig. 1b. (b) Heatmap and dendrogram of standardised environmental data for each station. Cells are coloured according to the z scores calculated for the environmental data matrix (see Table S1). Black dividing lines denote clusters identified by hierarchical clustering of the Euclidean distance matrix. Sampling stations are coloured according to their weighted UniFrac cluster in the bar to the right of the heatmap. Data for NH4 were lacking from 11 of the stations, as shown by the greyed-out cells.
Fig. 2
Fig. 2
Phylogenetic beta diversity based on ASV analyses. (a) NMDS ordination of the weighted UniFrac distance matrix (stress = 0.086). Samples are coloured by their weighted UniFrac cluster and ellipses represent 95% confidence intervals around each cluster. (b) Consensus tree of UPGMA sample clustering using weighted UniFrac as the metric and a rarefaction depth of 20K with 1000 iterations. Branch support values are indicated.
Fig. 3
Fig. 3
Boxplots of alpha diversity measures of the community clusters. (a) Phylogenetic diversity of samples grouped by community cluster and rarefied to 25,000 sequences. (b) Net relatedness index (NRI) of samples grouped by community cluster.
Fig. 4
Fig. 4
Beta diversity and net relatedness index (NRI) of trophic subsets of taxa and the rare biosphere. For each of the three subsets (chloroplast-containing taxa, heterotrophs and rare taxa), a weighted UniFrac and Bray–Curtis NMDS ordination, and a boxplot of NRI values is shown.
Fig. 5
Fig. 5
NMF analysis and signature ASVs. (a) Heatmap of the NMF coefficients matrix with cells coloured according to the correlation coefficients of each sampling station to each descriptor. (b) Bar plots showing the relative abundances of signature ASVs in each descriptor as determined by the NMF analysis. Bars are coloured according to the phylogenetic division of the ASV determined using the PR2 database. The ASV numbers of each signature ASV are indicated in parentheses.
Fig. 6
Fig. 6
Maximum-likelihood phylogenetic reconstructions of ASVs. (a) Phylogenetic tree of all ASVs identified across all samples in this study, with signature ASVs for each NMF descriptor denoted by coloured circles on the leaves. Major clades are also indicated on the tree with images of representative species for each clade shown. (be) Sub-trees of Fig. 6a showing signature ASVs in each descriptor. Leaf size is proportional to the ASV’s relative abundance in the descriptor, and PD25K of the whole descriptor is also shown.

Similar articles

References

    1. Ardyna, M., Gosselin, M., Michel, C., Poulin, M. & Tremblay, J. Environmental forcing of phytoplankton community structure and function in the Canadian High Arctic: Contrasting oligotrophic and eutrophic regions. Mar. Ecol. Prog. Ser.442, 37–57 (2011).
    1. Screen, J. A. & Simmonds, I. The central role of diminishing sea ice in recent Arctic temperature amplification. Nature464, 1334–1337 (2010). - PubMed
    1. Dai, A., Luo, D., Song, M. & Liu, J. Arctic amplification is caused by sea-ice loss under increasing CO2. Nat. Commun.10, 121 (2019). - PMC - PubMed
    1. Meredith, M. et al. Polar regions. In IPCC Special Report on the Ocean and Cryosphere in a Changing Climate (ed. Meredith, M.) (IPCC, 2019).
    1. Stroeve, J., Holland, M. M., Meier, W., Scambos, T. & Serreze, M. Arctic sea ice decline: Faster than forecast. Geophys. Res. Lett.10.1029/2007GL029703 (2007).

LinkOut - more resources