. 2024 Nov 21;15(1):10107.
doi: 10.1038/s41467-024-54435-3.

Acid-exposed and hypoxic cancer cells do not overlap but are interdependent for unsaturated fatty acid resources

Affiliations

Acid-exposed and hypoxic cancer cells do not overlap but are interdependent for unsaturated fatty acid resources

Katarzyna Głowacka et al. Nat Commun. .

Abstract

Cancer cells in acidic tumor regions are aggressive and a key therapeutic target, but distinguishing between acid-exposed and hypoxic cells is challenging. Here, we use carbonic anhydrase 9 (CA9) antibodies to mark acidic areas in both hypoxic and respiring tumor areas, along with an HRE-GFP reporter for hypoxia, to isolate distinct cell populations from 3D tumor spheroids. Transcriptomic analysis of CA9-positive, hypoxia-negative cells highlights enriched fatty acid desaturase activity. Inhibiting or silencing stearoyl-CoA desaturase-1 (SCD1) induces ferroptosis in CA9-positive acidic cancer cells and delays mouse tumor growth, an effect enhanced by omega-3 fatty acid supplementation. Using acid-exposed cancer cells and patient-derived tumor organoids, we show that SCD1 inhibition increases acidic cancer cell reliance on external mono-unsaturated fatty acids, depriving hypoxic cells of essential resources. This bystander effect provides unbiased evidence for a lack of full overlap between hypoxic and acidic tumor compartments, highlighting a rationale for targeting desaturase activity in cancer.


Conflict of interest statement

Competing interests: The authors declare no competing interests.

Figures
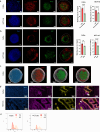
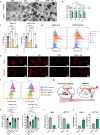
Fig. 1
Fig. 1. CA9 expression does not overlap with hypoxia.
a Representative pictures and quantification of Carbonic Anhydrase 9 (CA9, red) and pimonidazole (green) immunostaining in FaDu and HCT116 spheroid sections (N = 3, n = 2); DAPI (blue) nuclear staining was used to normalize measurements. The white delimitation represents the rim of the spheroid. b Representative pictures and quantification of CA9 (red) and Hypoxia-Responsive Element-dependent GFP reporter (HRE, green) wholemount fluorescence in FaDu and HCT116 spheroids (N = 5 and 7, respectively). c 3-dimensional modeling of CA9 (red), HRE-GFP (green), and DAPI (blue) staining in Fadu spheroids; this experiment was repeated twice with similar results. d Representative CA9 (purple) and pimonidazole (yellow) immunostaining in FaDu and HCT116 tumor sections; this experiment was repeated twice with similar results. e Representative flow cytometry analysis of CA9 staining in FaDu and HCT116 cancer cells maintained under normoxia at physiological pH 7.4 or at acidic pH 6.5; this experiment was repeated twice with similar results. The scale bar represents 100 µm for 3D tumor spheroids (ac) and 200 µm for mouse tumor sections (d). Data are plotted as the means ± SD (**P = 0.0017, ****P < 0.0001); N indicates the number of independent experiments and n indicates the number of biological replicates (when >1). Significance was determined by two-sided Student’s t-test (a, b). Source data are provided as a Source Data file.
Fig. 2
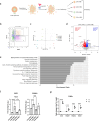
Fig. 2. CA9-positive HRE-GFP-negative cancer cells exhibit enrichment in FA desaturase activity.
a, b Schematic protocol of cell sorting from 3D FaDu spheroids based on CA9 immunostaining and HRE-GFP expression, created in BioRender. Feron, O. (2024) BioRender.com/i40c288 (a) and representative FACS plots showing gating strategy for each of the four quadrants (b). c Principal component analysis (PCA) discriminating the four quadrants based on RNA-seq analysis performed on 3 independent sorting experiments. d Volcano plot of differentially expressed genes between CA9+/HRE− and CA9+/HRE+ FaDu cell populations. e. KEGG pathway enrichment analysis of the differentially expressed genes between CA9+/HRE− and CA9+/HRE+ FaDu cell populations. f, g Changes in the mRNA expression of the indicated desaturases in the four distinct FaDu spheroid compartments (f) (N = 3, n = 2), and in FaDu cancer cells maintained at physiological pH 7.4 or at acidic pH 6.5 (g) (N = 4); results are expressed as fold-change vs. mRNA levels in CA9-/HRE- double negative cell populations and in cancer cells at pH 7.4, respectively. Data are plotted as the means ± SD (P-values as indicated or ***P < 0.001, ****P < 0.0001); N indicates the number of independent experiments and n indicates the number of biological replicates (when >1). Significance was determined by a two-sided Student’s t-test with FDR adjustment (d), one-way ANOVA with Tukey’s multiple comparison test (f), or two-sided Student’s t-test (g). Source data are provided as a Source Data file.
Fig. 3
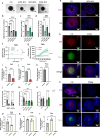
Fig. 3. SCD1 genetic silencing and pharmacological inhibition reduce the survival of CA9-positive cancer cells.
a, b Representative contrast phase pictures (a) and quantification (b) of the effects of CRISPR-Cas9-based SCD1 gene invalidation on FaDu spheroid growth at day 7 post-formation (vs. control sgRNA); N = 3, n = 2. ce Quantification of SCD1 (violet) (c) (N = 5) and CA9 (red) immunostaining (d) (N = 5), and representative pictures (e) of spheroids made of CRISPR-Cas9-based SCD1-silenced FaDu cells at day 10 post-formation. f, g Spheroid growth (f) (N = 3, n = 3–4) and cytotoxicity (Incucyte Cytotox Green reagent) follow up (g) (N = 3, n = 4) after exposure to SCD1 inhibitor (or vehicle) for 72 h in FaDu spheroids. h, i Representative pictures (h) and quantification of CA9 (red) (i) in sections of FaDu spheroids collected after 72 h exposure to SCD1 inhibitor (N = 3, n = 2). j Flow cytometry analysis of CA9 labeling from FaDu cells isolated from spheroids after 72 h exposure to SCD1 inhibitor (or vehicle) (N = 3). k Quantification of pimonidazole (green) in sections of FaDu spheroids collected after 72 h exposure to SCD1 inhibitor (N = 3, n = 2). l, m Mitochondrial oxygen consumption rate (OCR) of l FaDu (N = 3, n = 7) and HCT116 (N = 3, n = 7–8) spheroids after 72 h SCD1 inhibition and (m) FaDu cancer cells transduced with the indicated SCD1 sgRNA (N = 3, n = 3) or control sgRNA (N = 3, n = 3–4). n Non-mitochondrial OCR of FaDu cells transduced with an SCD1-expressing vector or control plasmid and exposed to palmitate (N = 3, n = 3) or vehicle (FA-free BSA) (N = 3, n = 4). or Representative pictures (o) and quantification of SCD1 (violet) (p), CA9 (red) (q), and pimonidazole (green) (r) staining in FaDu spheroids exposed to PPAR-γ inhibitor (or vehicle) for 72 h (N = 3); the effects of a PPAR-α inhibitor are also shown in graphs (pr). All treatments (fl) with SCD1 inhibitor (A939572, 32 µM) were initiated at day 7 after spheroid formation (i.e., timing 0 on graphs). All immunostaining quantifications (c, d, i, k, pr) were normalized to the DAPI nuclear staining area. Data are plotted as the means ± SD (P-values as indicated or ***P < 0.001, ****P < 0.0001); N indicates the number of independent experiments and n indicates the number of biological replicates (when >1). Significance was determined by one-way ANOVA with Tukey’s multiple comparison tests (bd), Dunnet’s multiple comparison tests (pr), Sidaks’s multiple comparison tests (f, g), two-way ANOVA with Tukey’s multiple comparison tests (ln) or two-sided Student’s t-tests (ik). Source data are provided as a Source Data file.
Fig. 4
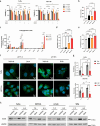
Fig. 4. The obligatory SCD1 expression for the survival of acid cancer cells is void upon PUFA exposure.
a Effects of inhibitors of SCD1 (A939572), FADS2 (SC-26196), and FADS1 (T3364366) on the viability of 7.4/ and 6.5/cancer cells (48 h, 32 µM for single-inhibitor treatment or 16 µM of each inhibitor for combination) in the presence of 50 µM DHA or vehicle (FA-free BSA) (N = 3, n = 2). be Lipidomic analysis of 6.5/ and 7.4/HCT116 cancer cells after 24 h exposure to 25 µM DHA or vehicle (N = 2). b Triacylglycerol (TAG) content expressed as % of the value measured in 7.4/cells, c TAG composition in esterified FA, d, e PUFA/MUFA ratio in neutral lipid (d) and phospholipid (e) fractions. f, g Representative pictures (f) and quantification (g) of SCD1 (green) immunofluorescence signal in the indicated 7.4/ and 6.5/cancer cells exposed or not to 20 µM DHA for 72 h (N = 4). h SCD1 immunoblotting from the indicated 6.5/ and 7.4/cancer cells exposed or not to 20 µM DHA for 72 h (N = 1). Data are plotted as the means ± SD (ns: non-significant, P-values as indicated or ***P < 0.001, ****P < 0.0001); N indicates the number of independent experiments and n indicates the number of biological experiments (when >1). Significance was determined by one-way ANOVA with Tukey’s multiple comparison test (be, g) or two-way ANOVA with Tukey’s multiple comparison test (a). Source data are provided as a Source Data file.
Fig. 5
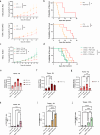
Fig. 5. SCD silencing or inhibition exerts tumor growth inhibitory effects in mice, an effect further exacerbated by lipid metabolism rewiring in response to a PUFA-rich diet.
a, b Tumor growth (a) and survival (b) of mice injected with SCD1 knock out FaDu cancer cells (top), clone #C1 (n = 5 mice per group, *P = 0.0110, ***P < 0.001) and bottom, clone #C2 (n = 6 mice per group, *P = 0.0151, **P = 0.0022). c, d Effects of daily SCD1 inhibitor administration (A939572, 30 mg/kg) on tumor growth (*P = 0.0352) (c) and survival (**P = 0.0033) (d) of mice injected with FaDu cancer cells and fed with control (n = 5 mice per group) or PUFA-rich diet (n = 6 mice per group). eg Total FA (e), PUFA (f), and MUFA (g) in the neutral lipid fraction of tumors from mice treated with SCD1 inhibitor and fed with control (n = 4) or PUFA-rich diet (n = 5). hj n-3 PUFA/MUFA ratios in NL (h) (n = 5), PL (i) (n = 6), and FFA (j) (n = 6) fractions of tumors from mice treated with SCD1 inhibitor and fed with control or PUFA-rich diet. Data plotted as the means ± SEM (P-values as indicated or ***P < 0.001, ****P < 0.0001). Significance was determined by one-way ANOVA with Tukey’s multiple comparison tests (hj), two-way ANOVA (a) with Tukey’s multiple comparison tests (c), or Fisher’s Least Significative difference (eg) and Long-rank Mantel–Cox test (b, d). Source data are provided as a Source Data file.
Fig. 6
Fig. 6. SCD inhibition is partly compensated by exogenous MUFA but exerts bystander cytotoxic effects on hypoxic cancer cells.
a, b Representative pictures (a) and quantification (b) of colorectal cancer patient-derived organoids after treatment with SCD1 inhibitor (A939572, 20 µM) in the presence of OA (100 µM) and/or DHA (50 µM) for 96 h (N = 2, n = 2). c, d Effect of SCD1 inhibitor (12 µM) on the viability (96 h) (c) and lipid peroxidation BODIPY-C11 staining (72 h) (d) of 6.5/Fadu (N = 3, n = 2) and 6.5/HCT116 (N = 3, n = 4) cancer cells in the presence of OA (100 µM) and/or DHA (50 µM) and/or α-Tocopherol (10 µM) or vehicle(s). e Representative pictures of CA9 immunofluorescence signal (red) in equatorial sections of FaDu and HCT116 spheroids exposed for 72 h to SCD1 inhibitor (A939572, 32 µM) in the presence of OA (100 µM) or not; this experiment was repeated twice with similar results. f Representative flow chart depicting the effects of SCD1 inhibitor on the uptake of TopFluor oleate by 6.5/Fadu and 6.5/HCT116 cancer cells maintained under normoxia or hypoxia (1% O2) (N = 4, n = 4). g Schematic representation of the symbiotic relationship between hypoxic cancer cells (unable to synthesize MUFA and thus dependent on exogenous MUFA) and acidic, non-hypoxic cancer cells that may use both MUFA sources. Inhibition of SCD1 however forces the latter cell compartment to capture exogenous MUFA thereby depriving hypoxic cells from a vital source of MUFA. h Viability of FaDu and HCT116 cancer cells maintained under hypoxia (1% O2) and exposed for 48 h to the conditioned medium (CM) from normoxic 6.5/FaDu and 6.5/HCT116 exposed or not to SCDi (24 h, 15 and 25 µM A939572, respectively) (N = 3, n = 7). In some experiments, CM was supplemented by oleate (50 µM) (N = 3, n = 4). Control conditions consist of CM + fresh addition of SCDi (N = 3, n = 7), and non-conditioned medium (NCM) (N = 3, n = 3). i, j MUFA amounts (i) and SFA/MUFA ratio (j) determined in the conditioned medium (CM) of normoxic 6.5/FaDu and 6.5/HCT116 cancer cells exposed or not to SCDi as above (N = 2). Data are plotted as the means ± SD (ns: non-significant, P-values as indicated or ***P < 0.001, ****P < 0.0001); N indicates the number of independent experiments and n indicates the number of biological replicates (when >1). Significance was determined by two-way ANOVA with Tukey’s multiple comparison test (bh). Source data are provided as a Source Data file.

References

    1. Corbet, C. & Feron, O. Tumour acidosis: from the passenger to the driver’s seat. Nat. Rev. Cancer17, 577–593 (2017). - PubMed
    1. Swietach, P., Boedtkjer, E. & Pedersen, S. F. How protons pave the way to aggressive cancers. Nat. Rev. Cancer23, 825–841 (2023). - PubMed
    1. Corbet, C. & Feron, O. Cancer cell metabolism and mitochondria: nutrient plasticity for TCA cycle fueling. Biochim. Biophys. Acta Rev. Cancer1868, 7–15 (2017). - PubMed
    1. Newell, K., Franchi, A., Pouyssegur, J. & Tannock, I. Studies with glycolysis-deficient cells suggest that production of lactic acid is not the only cause of tumor acidity. Proc. Natl Acad. Sci. USA90, 1127–1131 (1993). - PMC - PubMed
    1. Yamagata, M., Hasuda, K., Stamato, T. & Tannock, I. F. The contribution of lactic acid to acidification of tumours: studies of variant cells lacking lactate dehydrogenase. Br. J. Cancer77, 1726–1731 (1998). - PMC - PubMed

Publication types

MeSH terms

Associated data

LinkOut - more resources