

A digital phenotyping dataset for impending panic symptoms: a prospective longitudinal study
- PMID: 39572578
- PMCID: PMC11582692
- DOI: 10.1038/s41597-024-04147-6
A digital phenotyping dataset for impending panic symptoms: a prospective longitudinal study
Abstract
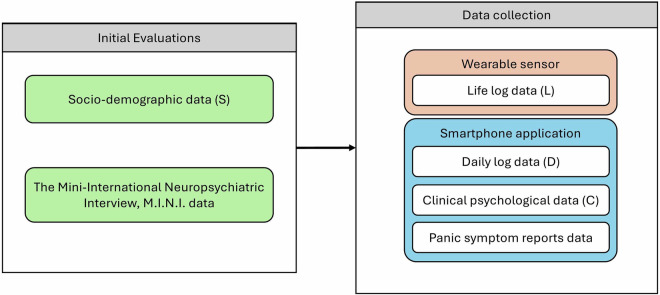
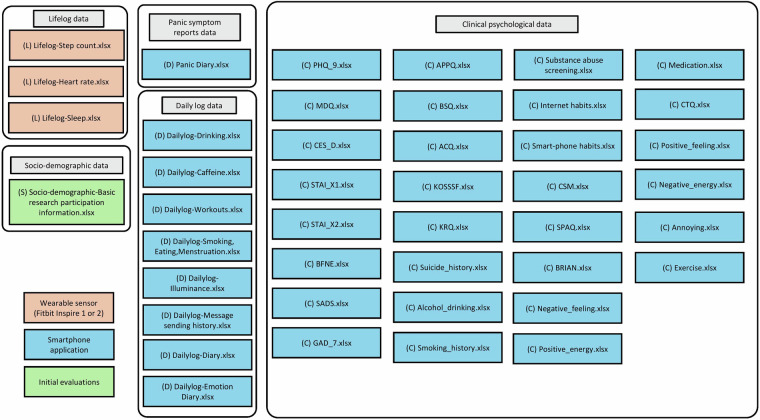
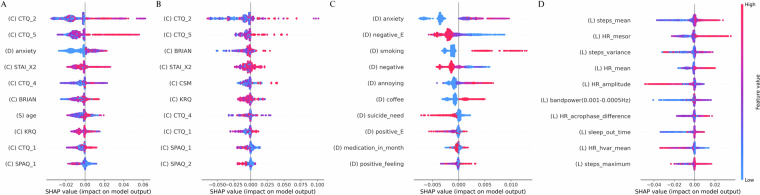
This study investigated the utilization of digital phenotypes and machine learning algorithms to predict impending panic symptoms in patients with mood and anxiety disorders. A cohort of 43 patients was monitored over a two-year period, with data collected from smartphone applications and wearable devices. This research aimed to differentiate between the day before panic (DBP) and stable days without symptoms. With RandomForest, GradientBoost, and XGBoost classifiers, the study analyzed 3,969 data points, including 254 DBP events. The XGBoost model demonstrated performance with a ROC-AUC score of 0.905, while a simplified model using only the top 10 variables maintained an ROC-AUC of 0.903. Key predictors of panic events included evaluated Childhood Trauma Questionnaire scores, increased step counts, and higher anxiety levels. These findings indicate the potential of machine learning algorithms leveraging digital phenotypes to predict panic symptoms, thereby supporting the development of proactive and personalized digital therapies and providing insights into real-life indicators that may exacerbate panic symptoms in this population.
© 2024. The Author(s).
Conflict of interest statement
Competing interests: The authors declare no competing interests.
Figures


Similar articles
-
Deep learning paired with wearable passive sensing data predicts deterioration in anxiety disorder symptoms across 17-18 years.J Affect Disord. 2021 Mar 1;282:104-111. doi: 10.1016/j.jad.2020.12.086. Epub 2020 Dec 27. J Affect Disord. 2021. PMID: 33401123 Free PMC article.
-
Discrimination between healthy participants and people with panic disorder based on polygenic scores for psychiatric disorders and for intermediate phenotypes using machine learning.Aust N Z J Psychiatry. 2024 Jul;58(7):603-614. doi: 10.1177/00048674241242936. Epub 2024 Apr 6. Aust N Z J Psychiatry. 2024. PMID: 38581251
-
Large-scale digital phenotyping: Identifying depression and anxiety indicators in a general UK population with over 10,000 participants.J Affect Disord. 2025 Apr 15;375:412-422. doi: 10.1016/j.jad.2025.01.124. Epub 2025 Jan 30. J Affect Disord. 2025. PMID: 39892753
-
Systematic Review of Digital Phenotyping and Machine Learning in Psychosis Spectrum Illnesses.Harv Rev Psychiatry. 2020 Sep/Oct;28(5):296-304. doi: 10.1097/HRP.0000000000000268. Harv Rev Psychiatry. 2020. PMID: 32796192
-
Anxiety sensitivity and panic disorder.Biol Psychiatry. 2002 Nov 15;52(10):938-46. doi: 10.1016/s0006-3223(02)01475-0. Biol Psychiatry. 2002. PMID: 12437935 Review.
Cited by
-
Digital phenotyping using smartphones could help steer mental health treatment.Proc Natl Acad Sci U S A. 2025 Apr 8;122(14):e2505700122. doi: 10.1073/pnas.2505700122. Epub 2025 Apr 2. Proc Natl Acad Sci U S A. 2025. PMID: 40172965 Free PMC article. No abstract available.
References
-
- Edition, F. Diagnostic and statistical manual of mental disorders. Am Psychiatr. Assoc21, 591–643 (2013).
-
- Harvey, J. M., Richards, J. C., Dziadosz, T. & Swindell, A. Misinterpretation of ambiguous stimuli in panic disorder. Cogn. Ther. Res.17, 235–248 (1993).
-
- Locke, A. B., Kirst, N. & Shultz, C. G. Diagnosis and management of generalized anxiety disorder and panic disorder in adults. Am. Fam. Physician91, 617–624 (2015). - PubMed
-
- Olaya, B., Moneta, M. V., Miret, M., Ayuso-Mateos, J. L. & Haro, J. M. Epidemiology of panic attacks, panic disorder and the moderating role of age: Results from a population-based study. J. Affect. Disord.241, 627–633 (2018). - PubMed
Publication types
MeSH terms
LinkOut - more resources
Full Text Sources
Medical
