. 2024 Nov 21;15(1):10103.
doi: 10.1038/s41467-024-54423-7.

Functional specificity of liquid-liquid phase separation at the synapse

Affiliations

Functional specificity of liquid-liquid phase separation at the synapse

Natalie J Guzikowski et al. Nat Commun. .

Abstract

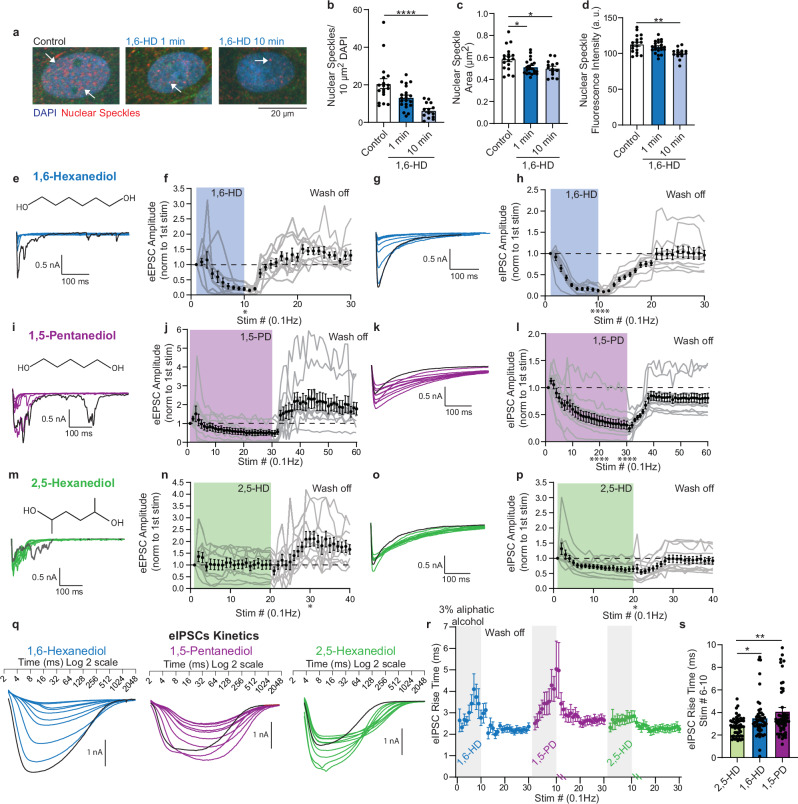
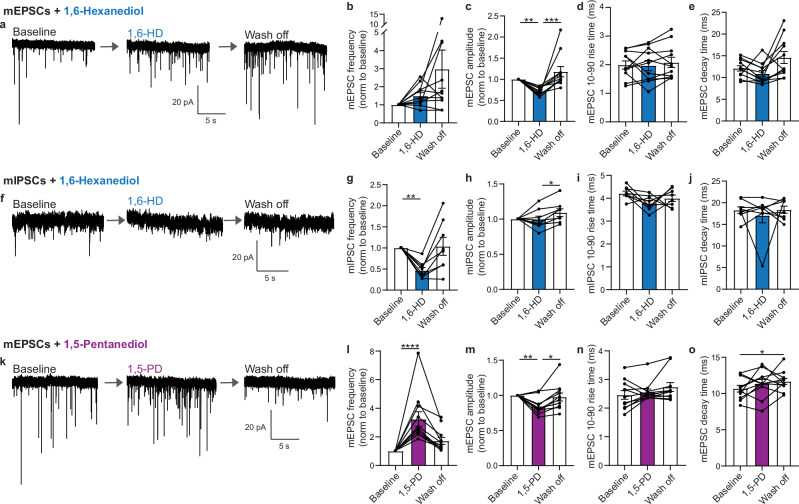
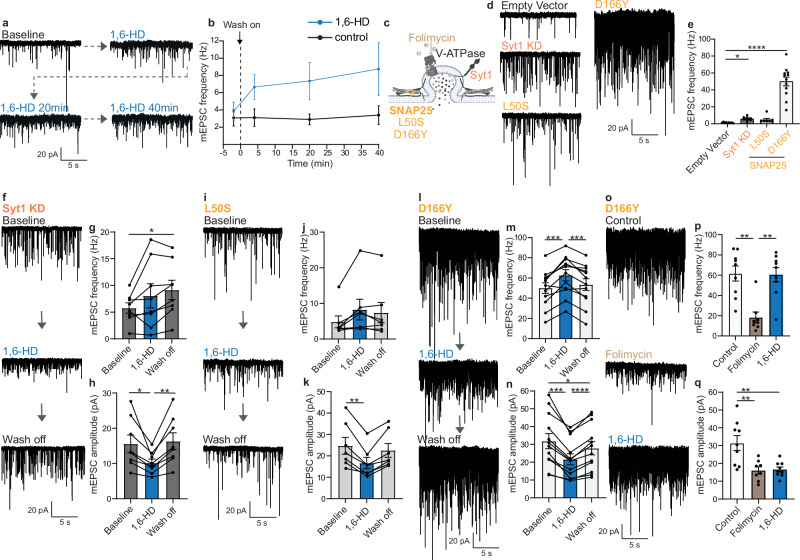
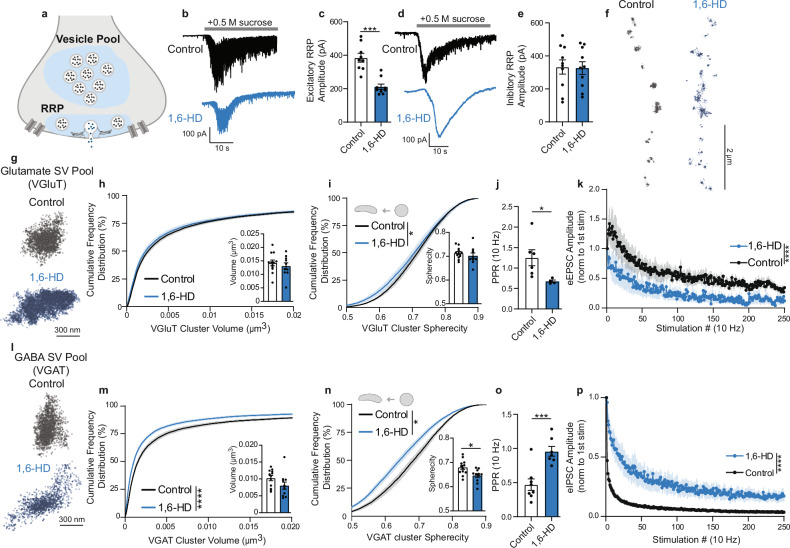
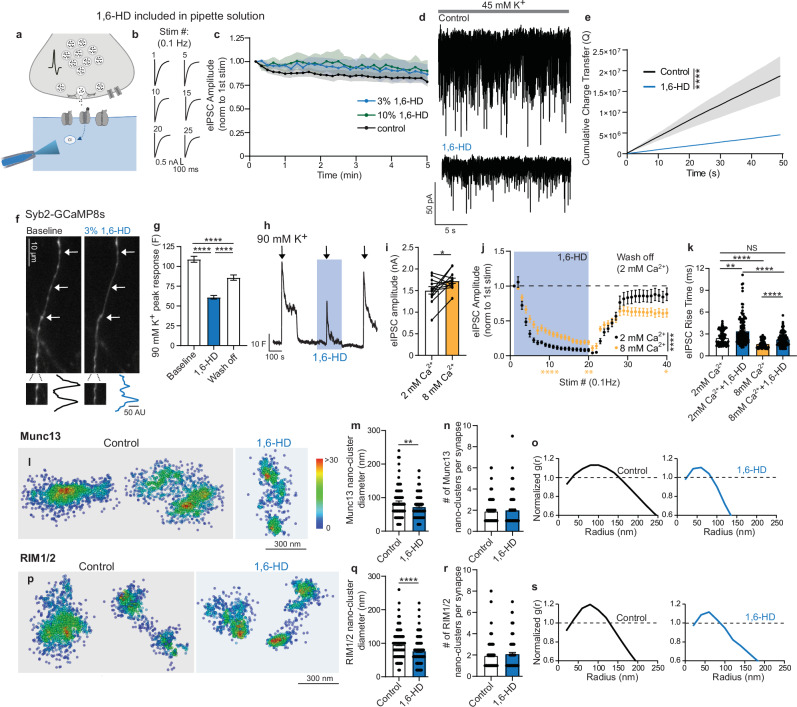
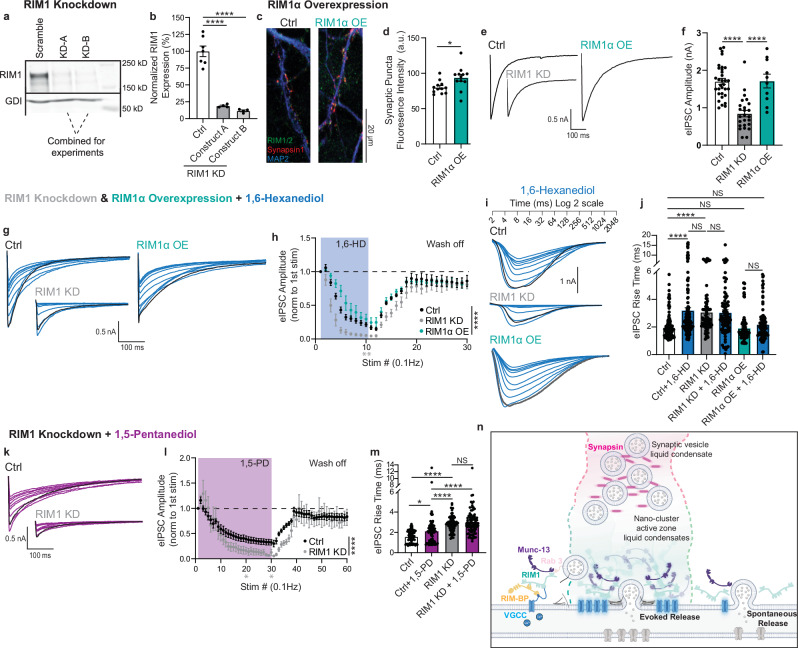
The mechanisms that enable synapses to achieve temporally and spatially precise signaling at nano-scale while being fluid with the cytosol are poorly understood. Liquid-liquid phase separation (LLPS) is emerging as a key principle governing subcellular organization; however, the impact of synaptic LLPS on neurotransmission is unclear. Here, using rat primary hippocampal cultures, we show that robust disruption of neuronal LLPS with aliphatic alcohols severely dysregulates action potential-dependent neurotransmission, while spontaneous neurotransmission persists. Synaptic LLPS maintains synaptic vesicle pool clustering and recycling as well as the precise organization of active zone RIM1/2 and Munc13 nanoclusters, thus supporting fast evoked Ca2+-dependent release. These results indicate although LLPS is necessary within the nanodomain of the synapse, the disruption of this nano-organization largely spares spontaneous neurotransmission. Therefore, properties of in vitro micron sized liquid condensates translate to the nano-structure of the synapse in a functionally specific manner regulating action potential-evoked release.


Conflict of interest statement

Competing interests: The authors declare no competing interests.

Figures

Fig. 1
Fig. 1. Action potential-dependent neurotransmission is disrupted following LLPS manipulation.
a Nuclear speckle staining (images are maximum intensity projections from z-stacks). b, Number of nuclear speckles per 10 µm2 of DAPI, c nuclear speckle area and (d) nuclear speckle fluorescence intensity (control n = 15, 1 min n = 21, 10 min n = 14 ROIs). e Representative traces of eEPSCs during 3% 1,6-HD wash on, first trace in black. f eEPSC amplitude during treatment (n = 10 cells). g Representative traces of eIPSCs during 3% 1,6-HD wash on, first trace in black. h eIPSC amplitude during treatment (n = 10 cells). i Representative traces of eEPSCs during 3% 1,5-PD wash on, first trace in black. j eEPSC amplitude during treatment (n = 10 cells). k Representative traces of eIPSCs during 3% 1,5-PD wash on, first trace in black. l eIPSC amplitude during treatment (n = 12 cells). m Representative traces of eEPSCs during 3% 2,5-HD wash on, first trace in black. n eEPSC amplitude during treatment (n = 10 cells). o Example traces of eIPSCs during 3% 2,5-HD wash on, first trace in black. p eIPSC amplitude during treatment (n = 11 cells). q Sample traces of eIPSC kinetics following 3% aliphatic alcohol treatment, first stimulation in black. r Analysis of eIPSC rise times (20-80%) with 3% aliphatic alcohol treatment during wash-on for ten stimulations, followed by a 20 stimulation wash-off period (stimulation events not included are in Supplementary Fig. 1jl, to compare same treatment length) (1,6-HD n = 10, 1,5-PD n = 12, 2,5-HD n = 11 cells). s Comparison of eIPSC rise times for stimulation #6-10 (period when see robust amplitude effect) during 3% aliphatic alcohol treatment (1,6-HD n = 50, 1,5-PD n = 60, 2,5-HD n = 55 stimulation events). Values are mean ± SEM. Significance reported as: *p < 0.05, **p < 0.01, ***p < 0.001, and ****p < 0.0001. Statistical analyzes conducted were one-way Kruskal-Wallis test with Dunn’s multiple comparisons test (b, s), one-way ANOVA with Dunnett’s multiple comparison test (c, d), one-way Friedman test with Dunn’s multiple comparisons test comparing amplitude to the 1st stimulation every ten stimulations (f, h, j, l, n, p). Source data are provided as a source data file. Exact p-values reported in Supplementary Data 1.
Fig. 2
Fig. 2. Spontaneous neurotransmission persists despite LLPS disruption.
a Example traces of mEPSCs at baseline, 2 min 3% 1,6-HD treatment, and during wash off. b Analysis of mEPSC frequency normalized to baseline, c mEPSC amplitude normalized to baseline, d mESPC event rise times (10–90), and e mEPSC event decay times (n = 11 cells). f Example traces of mIPSCs at baseline, 2 min 3% 1,6-HD treatment, and during wash off. g Analysis of mIPSC frequency normalized to baseline, h mIPSC amplitude normalized to baseline, i mIPSC event rise times (10–90), and j mIPSC event decay times (n = 8 cells). k Example traces of mEPSCs at baseline, 2 min 3% 1,5-PD treatment, and during wash off. l Analysis of mEPSC frequency normalized to baseline, m mEPSC amplitude normalized to baseline, n, mESPC event rise times (10–90), and o, mEPSC event decay times (n = 11 cells). Values are mean ± SEM. Significance reported as: *p < 0.05, **p < 0.01, ***p < 0.001, and ****p < 0.0001. Statistical analyzes conducted were one-way Friedman test with Dunn’s multiple comparisons test (b, c, g, h, j, ln) and one-way ANOVA with Tukey’s multiple comparison test (d, e, i, o). Source data are provided as a source data file. Exact p-values reported in Supplementary Data 1.
Fig. 3
Fig. 3. Genetic augmentation of spontaneous neurotransmission during LLPS disruption.
a Example mEPSC traces at baseline, immediately following 3% 1,6-HD application, after 20 minutes, and 40 minutes of 3% 1,6-HD exposure to the same cell. b Analysis of mEPSC frequency over time with continued exposure to 3% 1,6-HD (1,6-HD n = 5, control n = 5 cells). c Schematic of fusing synaptic vesicle with V-ATPase, Synaptotagmin 1 (Syt1), and Synaptosomal-Associated Protein 25 kDa (SNAP25) variants L50S and D166Y (Created in BioRender. Guzikowski, N. (2024)). d Example mEPSC traces of four groups including empty vector (control), Synaptotagmin 1 knockdown (Syt1 KD), SNAP25 L50S variant, and SNAP25 D166Y variant. e Analysis of baseline mEPSC frequency of Syt1 KD and two SNAP25 genetic variants (Empty Vector n = 9, Syt1 KD n = 8, L50S n = 7, D166Y n = 12 cells, same data used for baseline in 1,6-HD treatment experiments). fn Across the three different genetic backgrounds representative traces and quantification of 2 min 3% 1,6-HD treatment on mEPSC frequency and amplitude (Syt1 KD n = 8, L50S n = 7, D166Y n = 12 cells). o Example mEPSC traces of control (DMSO), 10 minute folimycin pre-treatment (also included in the bath), and 10 minute 1,6-HD treatment in the D166Y SNAP25 genetic background. p Analysis of mEPSC frequency and q mEPSC amplitude (control n = 9, folimycin n = 8, 1,6-HD n = 9 cells). Values are mean ± SEM. Significance reported as: *p < 0.05, **p < 0.01, ***p < 0.001, and ****p < 0.0001. Statistical analyzes conducted were unpaired two tailed t-test or two tailed t-test Mann-Whitney test performed between groups at baseline, 4 min, 20 min, and 40 min intervals (b), one-way Kruskal-Wallis test with Dunn’s multiple comparisons test (e, p), one-way ANOVA with Dunnett’s/Tukey’s multiple comparison test (g, h, m, n, q), one-way Friedman test with Dunn’s multiple comparisons test (j, k). Source data are provided as a source data file. Exact p-values reported in Supplementary Data 1.
Fig. 4
Fig. 4. Synaptic vesicle pool clustering dynamics altered with liquid condensate melting.
a Diagram of vesicle pools within the pre-synapse (Created in BioRender. Guzikowski, N. (2023)). b Representative traces of excitatory RRP upon 0.5 M sucrose perfusion. c Peak amplitude of 0.5 M sucrose response (n = 9 cells). d Representative traces of inhibitory RRP upon 0.5 M sucrose perfusion. e Peak amplitude of 0.5 M sucrose response (n = 10 cells). f Representative image of dSTORM glutamate SV pool clusters along an axon. g Single cluster of dSTORM VGluT single molecule localizations representing the glutamate containing SV pool at an individual bouton. h Cumulative frequency histogram of VGluT cluster volume for all synapses with inlaid bar graph of ROI averages (control n = 12, 1,6-HD n = 10 ROIs). i Cumulative frequency histogram of VGluT cluster sphericity of all synapses with inlaid bar graph of ROI averages (control n = 12, 1,6-HD n = 10 ROIs). j eEPSC Paired Pulse Ratio (PPR) and (k) eEPSC amplitude during repetitive stimulation (only evoked currents large enough to differentiate from stimulation artifact and baseline activity included in analysis, 1st and 2nd stim data from Fig. 4k used for PPR) (control n = 6, 1,6-HD n = 4 cells). l Single cluster of dSTORM VGAT single molecule localizations representing the GABA containing SV pool at an individual bouton. m Cumulative frequency histogram of VGAT cluster volume of all synapses with an inlaid bar graph of ROI averages (control n = 12, 1,6-HD n = 11 ROIs). n Cumulative frequency histogram of VGAT cluster sphericity of all synapses with an inlaid bar graph of ROI averages (control n = 12, 1,6-HD n = 11 ROIs). o eIPSC PPR and (p) eIPSC amplitude during repetitive stimulation (only evoked currents large enough to differentiate from stimulation artifact and baseline activity included in analysis, 1st and 2nd stim data from Fig. 4p used for PPR) (control n = 8, 1,6-HD n = 7 cells). Values are mean ± SEM. Significance reported as: *p < 0.05, **p < 0.01, ***p < 0.001, and ****p < 0.0001. Statistical analyzes conducted were two-tailed Mann-Whitney test (c), two-tailed unpaired t test (e, h, i, j, mo), and Kolmogorov-Smirnov test (h, i, k, m, n, p). Source data are provided as a source data file. Exact p-values reported in Supplementary Data 1.
Fig. 5
Fig. 5. Necessity of liquid condensates in active zone nanostructure for calcium-dependent release.
a Experimental set-up for 1,6-HD included in patch pipette internal solution (Created in BioRender. Guzikowski, N. (2023)). b Example traces of eIPSCs. c Analysis of eIPSC amplitude when aliphatic alcohols are included in the internal solution (control n = 8, 3% n = 5, 10% n = 4 cells, stats performed at minute interval). d Examples traces of whole cell voltage clamp during 45 mM K+ perfusion. e Cumulative charge transfer during 45 mM K+ perfusion following 1 min control or 3% 1,6-HD pre-treatment (with TTX, APV, Bicuculline) (control n = 8, 1,6-HD n = 9 cells). f Example images of axons transfected with Syb2-GCaMP8s. Arrows denote pre-synaptic boutons identified with 90 mM K+. Insets below represent fluorescence intensity peaks at individual boutons. g Peak fluorescence response (n = 687 boutons). h Example fluorescence trace (ROI average of all boutons). i Paired comparison of eIPSC amplitude (n = 12 cells, same recordings used in Fig. 5j, k). j eIPSC amplitude during 3% 1,6-HD wash-on and wash-off (statistical analysis comparing nonlinear fit during drug wash on and average amplitudes compared between groups at every 10th stim) (wash-off is 2 mM Ca2+ for both groups) (2 mM Ca2+ n = 12, 8 mM Ca2+ n = 12 cells). k Analysis of eIPSC rise times (20-80%) (1st 10 stim of treatment or baseline per cell included). l dSTORM Munc13 single molecule localizations at an individual bouton color coded based on density heat map. m Munc13 nanocluster diameters (Control n = 129, 1,6-HD n = 137 synapses) and (n) number of munc13 nanoclusters per synapse (Control n = 121, 1, 6-HD n = 132 synapses). o Normalized pair correlation function (g(r)) of an individual synapse. p dSTORM RIM1/2 single molecule localizations at an individual bouton color coded based on density heat map. q RIM1/2 nanocluster diameters (Control n = 146, 1,6-HD n = 134 synapses) and r, number of RIM1/2 nanoclusters per synapse (Control n = 132, 1,6-HD n = 121 synapses). s, Normalized pair correlation function (g(r)) of an individual synapse. Values are mean ± SEM. Significance reported as: *p < 0.05, **p < 0.01, ***p < 0.001, and ****p < 0.0001. Statistical analyzes conducted were one-way ANOVA with Tukey’s multiple comparison test (c) Simple linear regression (e) one-way Friedman test with Dunn’s multiple comparisons test (g) two-tailed paired t-test (i) two-tailed Mann-Whitney test (j, m, n, q, r) two-tailed unpaired t-test (j), Nonlinear fit (one phase decay) comparison of fit—extra sum-of-squares F test (j) and one-way Kruskal-Wallis test with Dunn’s multiple comparisons test (k). Source data are provided as a source data file. Exact p-values reported in Supplementary Data 1.
Fig. 6
Fig. 6. Phase separation of RIM1 regulates the efficacy and integrity of fast evoked calcium-dependent release.
a Example image of RIM1 western blot. b RIM1 protein expression normalized to GDI loading control and scramble (ctrl) (A and B RIM1-KD constructs combined for all further experiments) (ctrl n = 7, RIM1-KD-A n = 4, RIM1-KD-B n = 4 samples, quantitative comparisons were made between samples on different gels/blots.). c Synapse staining (images are maximum intensity projections from z-stacks). d Fluorescence intensity of synaptic puncta (colocalization of RIM1/2 and synapsin1) (ctrl n = 12, RIM1α OE n = 12 ROIs). e Representative traces of basal eIPSCs. f eIPSC amplitude (ctrl n = 32, RIM1 KD n = 25, RIM1α OE n = 10 cells). g Representative traces of eIPSCs during 3% 1,6-HD wash on, first trace in black. h eIPSC amplitude during treatment (comparing nonlinear fit during drug wash on and average amplitudes compared between groups at every 10th stim, ctrl n = 17, RIM1 KD n = 9, RIM1α OE n = 10 cells). i Sample traces of eIPSC kinetics following 3% 1,6-HD treatment, first stimulation in black. j Analysis of eIPSC rise times (20-80%) (1st 10 stim of treatment or baseline per cell included) (ctrl n = 170, RIM1 KD n = 90, RIM1α OE = 100 stimulation events). k Representative traces of eIPSCs during treatment, first trace in black. l eIPSC amplitude during treatment (comparing nonlinear fit during drug wash on and average amplitudes compared between groups at every 10th stim, ctrl n = 9, RIM1 KD n = 9 cells). m Analysis of eIPSC rise times (20–80%) (1st 10 stim of treatment or baseline per cell included) (ctrl n = 90, RIM1 KD n = 90 stimulation events). n Summary figure of hypothesized pre-synaptic organization; vesicle pool organization relies on LLPS for adequate exocytosis and endocytosis dynamics, evoked release is located within active zone nano-cluster liquid condensates, necessary for VGCC clustering, whereas spontaneous release is located outside liquid RIM1 nano-clusters (Created in BioRender. Guzikowski, N. (2023)). Values are mean ± SEM. Significance reported as: *p < 0.05, **p < 0.01, ***p < 0.001, and ****p < 0.0001. Statistical analyzes conducted were one-way ANOVA with Dunnett’s/Tukey’s multiple comparison test (b, f), two-tailed Unpaired t test (d, l), one-way Kruskal-Wallis test with Dunn’s multiple comparisons test (m, h, j), Nonlinear fit (one phase decay) comparison of fit – extra sum-of-squares F test (h, l), and two-tailed Mann Whitney test (l). Source data are provided as a source data file. Exact p-values reported in Supplementary Data 1.

Similar articles

Cited by

References

    1. Brangwynne, C. P. et al. Germline P granules are liquid droplets that localize by controlled dissolution/condensation. Science324, 1729–1732 (2009). - PubMed
    1. Chen, X., Wu, X., Wu, H. & Zhang, M. Phase separation at the synapse. Nat. Neurosci.23, 301–310 (2020). - PubMed
    1. Wu, X., Qiu, H. & Zhang, M. Interactions between membraneless condensates and membranous organelles at the presynapse: a phase separation view of synaptic vesicle cycle. J. Mol. Biol.435, 167629 (2023). - PubMed
    1. McDonald, N. A. & Shen, K. Finding functions of phase separation in the presynapse. Curr. Opin. Neurobiol.69, 178–184 (2021). - PubMed
    1. Lyon, A. S., Peeples, W. B. & Rosen, M. K. A framework for understanding functions of biomolecular condensates on molecular to cellular scales. Nat. Rev. Mol. Cell Biol.22, 215 (2021). - PMC - PubMed

Publication types

LinkOut - more resources