. 2024 Nov 21;15(1):10096.
doi: 10.1038/s41467-024-54549-8.

GPATCH11 variants cause mis-splicing and early-onset retinal dystrophy with neurological impairment

Affiliations

GPATCH11 variants cause mis-splicing and early-onset retinal dystrophy with neurological impairment

Andrea Zanetti et al. Nat Commun. .

Abstract

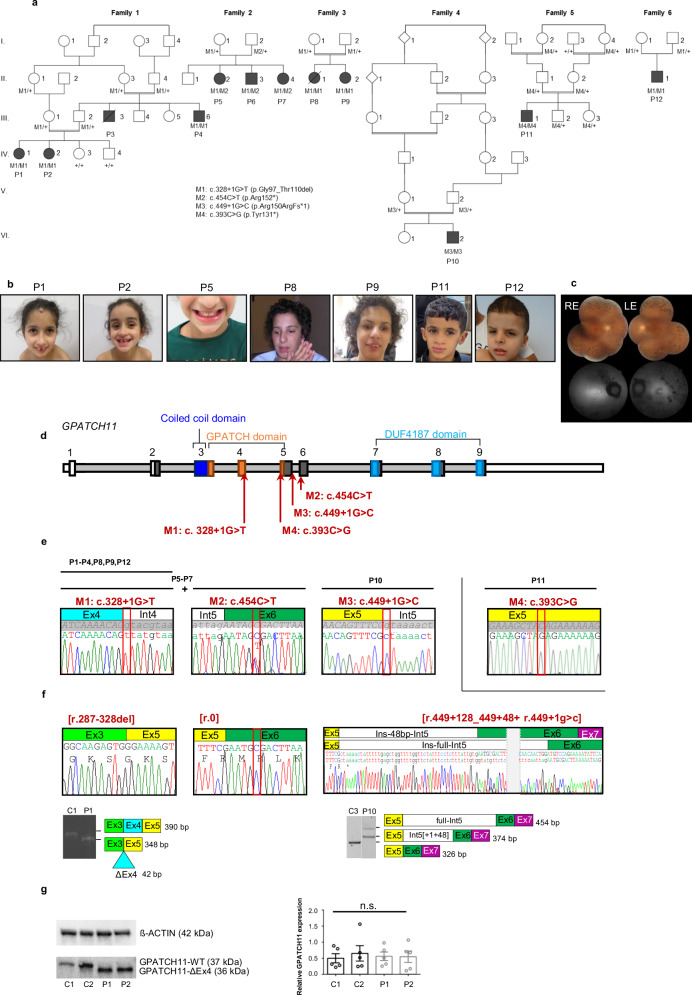
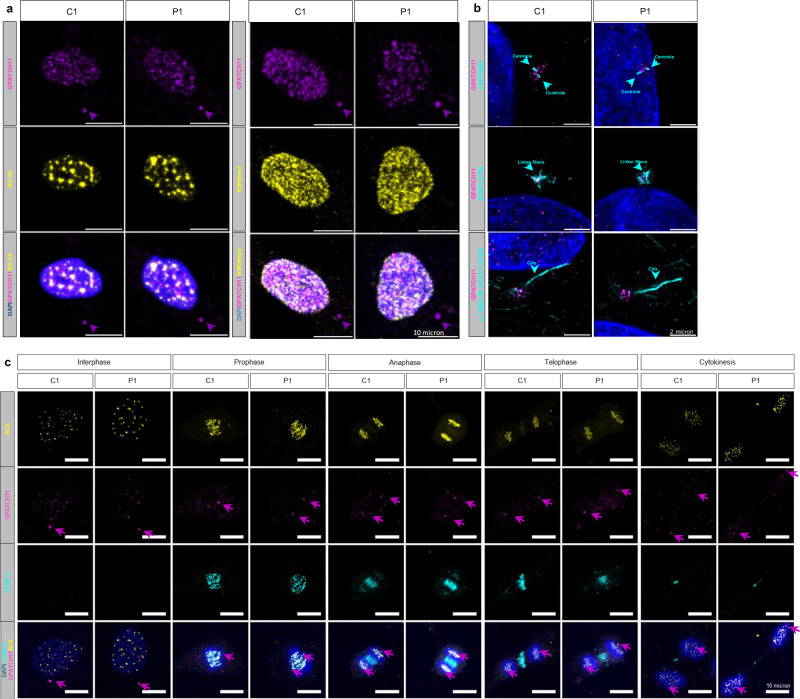
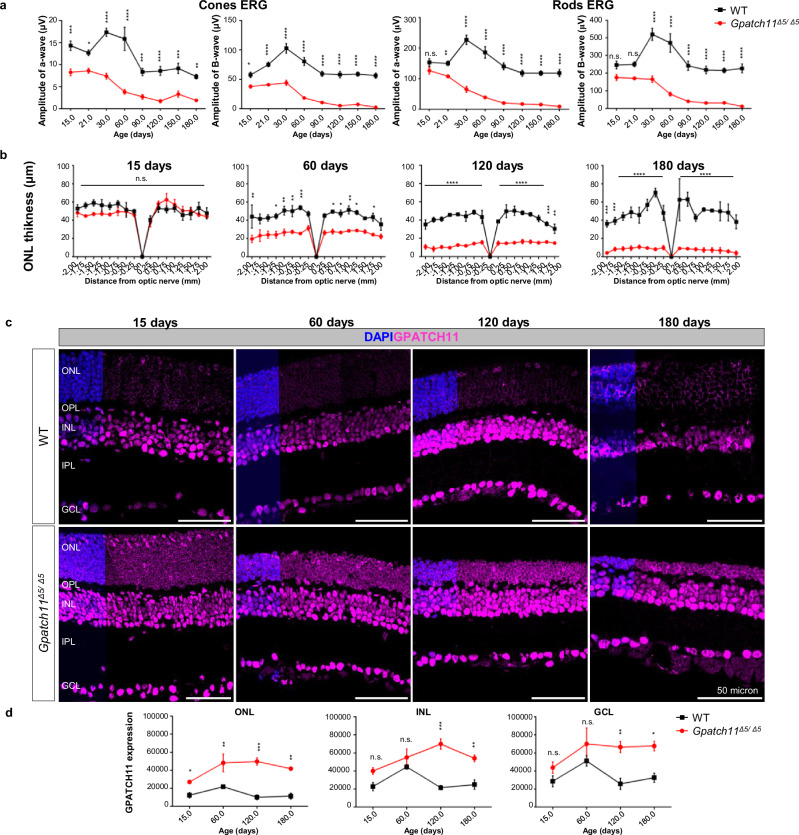
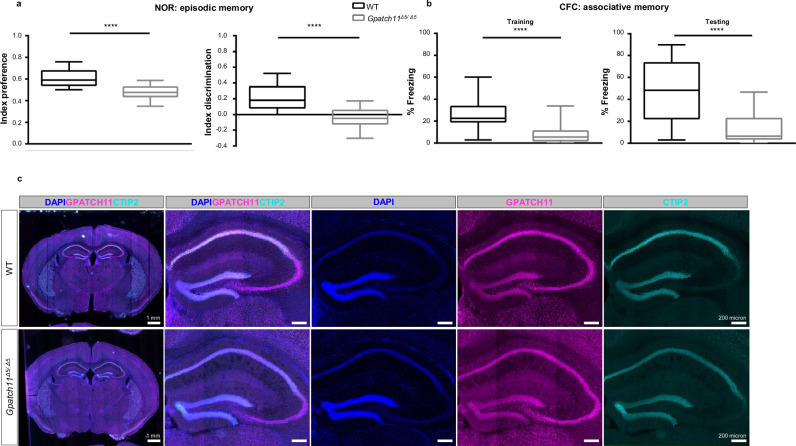
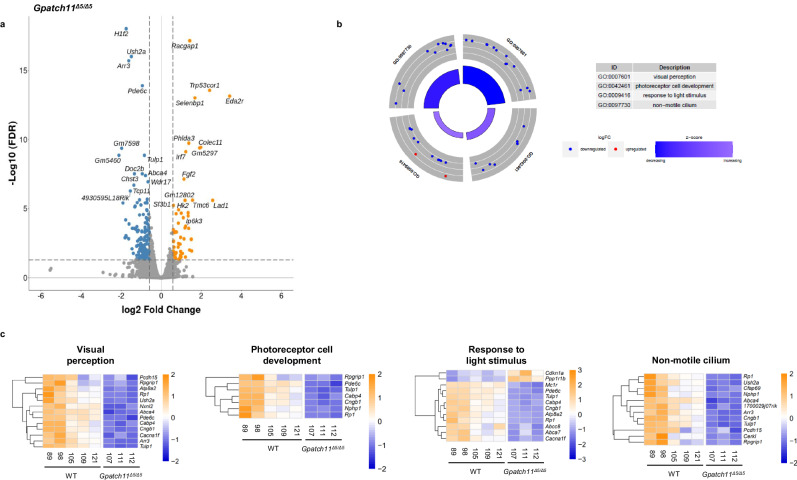
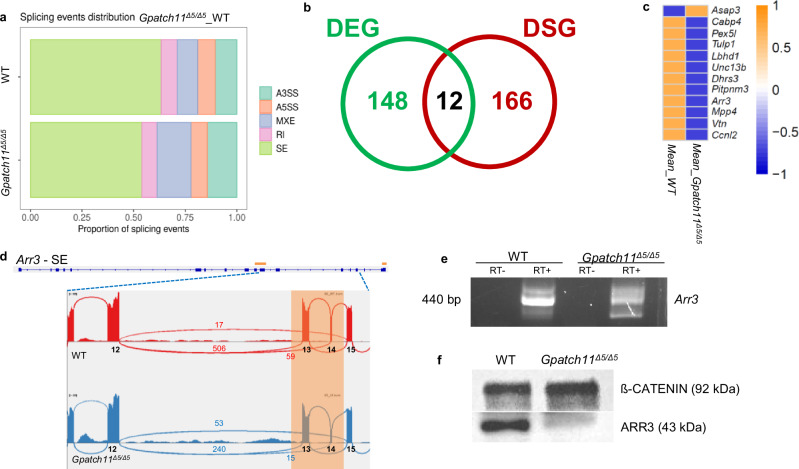
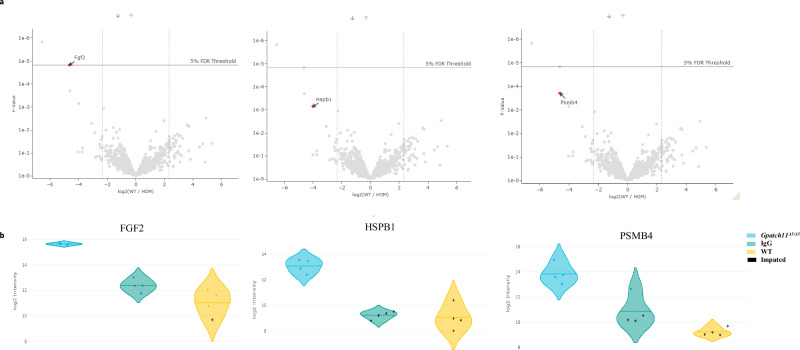
Here we conduct a study involving 12 individuals with retinal dystrophy, neurological impairment, and skeletal abnormalities, with special focus on GPATCH11, a lesser-known G-patch domain-containing protein, regulator of RNA metabolism. To elucidate its role, we study fibroblasts from unaffected individuals and patients carrying the recurring c.328+1 G > T mutation, which specifically removes the main part of the G-patch domain while preserving the other domains. Additionally, we generate a mouse model replicating the patients' phenotypic defects, including retinal dystrophy and behavioral abnormalities. Our results reveal a subcellular localization of GPATCH11 characterized by a diffuse presence in the nucleoplasm, as well as centrosomal localization, suggesting potential functions in RNA and cilia metabolism. Transcriptomic analysis performed on mouse retina detect dysregulation in both gene expression and splicing activity, impacting key processes such as photoreceptor light responses, RNA regulation, and primary cilia-associated metabolism. Proteomic analysis of mouse retina confirms the roles GPATCH11 plays in RNA processing, splicing, and transcription regulation, while also suggesting additional functions in synaptic plasticity and nuclear stress response. Our research provides insights into the diverse roles of GPATCH11 and identifies that the mutations affecting this protein are responsible for a recently characterized described syndrome.


Conflict of interest statement

Competing interests: The authors declare no competing interests.

Figures

Fig. 1
Fig. 1. Functional characterization of GPATCH11 variants identified as causative for syndromic inherited retinal disease and clinical features of affected individuals.
a Pedigrees of six analyzed families, including segregation analysis of GPATCH11 variants: M1: c.328+1G>T (p.Gly97_Thr110del); M2: c.454C>T (p.Arg152*); M3: c.449+1G>C (p.Arg150ArgFs*1); M4: c.393C>G (p.Tyr131*); +: wild-type allele; P: patient. P1 and P2 are affected individuals whose fibroblasts were analyzed. b Clinical images of affected individuals P1, P2, P5, P8, P9, P11, P12. c Color fundus photographs and fundus autofluorescence images of P10, RE: right eye; LE: left eye. d GPATCH11 diagram indicating the positions of c.328+1G>T, c.454C>T, c.449+1G>C, and c.393C>G variants relative to NM_174931.4 transcript. e Representative chromatograms of gDNA sequences from affected individuals show variants: c.328+1G>T (M1) homozygously (as in P1-P4, P8, P9, P12), c.454C>T (M2) in exon 6 heterozygously (as detected in compound heterozygosity with M1 in P5-P7), c.449+1G>C (M3) homozygously (P10), and c.393C>G in exon 5 in homozygosity (P11). f Chromatograms of cDNA sequences reveal a shorter transcript (r.287-328del) in P1 and P2 due to M1, absence of transcripts (r.0) in P5 (M2), and two distinct transcripts (r.449+128 and r.449+48) in P10 caused by M3. Electrophoresis of PCR products from cDNA from P1 and control individual (C1) shows exclusion of exon 4 (42 base pairs, bp), leading to creation of a shorter aberrant transcript. Electrophoresis of RT-PCR products from leukocytes of control (C3) and P10, and schematic representation showing two aberrant transcripts present for P10 and absent in C3, corresponding to the retention of full and partial intron 5. Blots are representative of three independent experiments. g Western blot analysis of protein extracts using anti-GPATCH11 antibody targeting residues 111-192 showing detection of shorter protein isoform (GPATCH11-Δex4 (36 KDa)) in patients’ fibroblasts (P1, P2) as compared to the controls (GPATCH11-WT (37 KDa)) in C1 and C2. The abundance of GPATCH11 products in fibroblasts from affected individuals is comparable to control samples. The statistical significance was estimated using one-way ANOVA with a post-hoc Tukey test. Bars represent means ± SEM from three experimental replicates (five technical replicates). n.s. not significant. Source data are provided as a Source Data file.
Fig. 2
Fig. 2. Immunocytochemistry analysis of GPATCH11 subcellular localization in the fibroblasts from a control (C1) and affected individual (P1) carrying the c.328+1G>T variant in homozygosity.
a Nuclear and centrosomal localization. Immunostaining of GPATCH11 (magenta), SC-35, and H3K9me3 (yellow). Magenta arrows show GPATCH11 at the centrosome. Scale bars, 10 µm. b Centrosomal localization of GPATCH11. Immunostaining of GPATCH11 (magenta), Centrin3 (centrioles), Rootletin (linker fibers), and acetylated α-Tubulin (cilia) in cyan. Serum free culture was used to promote ciliation. Cyan arrows show centrioles, linker fibers, or cilia, respectively. Scale bars, 2 µm. c Immunostaining of GPATCH11 (magenta), ACA (yellow), CENP-E (cyan) at different phases of the mitosis. Magenta arrows show GPATCH11 at the centrosome. Scale bar, 10 µm. DAPI is used to label the nucleus (blue). All the pictures are representative of three independent experiments.
Fig. 3
Fig. 3. Generation of a mouse model expressing a protein analogous to the human mutant variant.
a Diagram depicting the human GPATCH11 gene and the murine Gpatch11 gene. The schematic illustrates a CRISPR/Cas9-mediated exon 5 deletion from the mouse Gpatch11 locus (human exon 4 corresponds to murine exon 5). b Representative chromatogram displaying wild-type (WT) and homozygous mutant (Gpatch11Δ5/Δ5) mice cDNA sequences amplified from retina samples using forward and reverse primers in exons 3, and 8, respectively. c Detection and (d) quantification of GPATCH11 wild-type and homozygous mutant isoforms relative to γ-Tubulin by Western blot analysis of retina protein extracts. The significance of variations among samples was estimated using the Two-tailed Student’s t-test. Bars indicate means ± SEM calculated from ≤6 mice per genotype. n.s. not significant. Source data are provided as a Source Data file.
Fig. 4
Fig. 4. Longitudinal analysis of retinal structure and function in Gpatch11Δ5/Δ5 mice.
a Cone- and rod-specific ERG responses to light in wild-type (WT, black) and Gpatch11Δ5/Δ5 (red) mice at post-natal days 15, 21, 30, 60, 90, 120, 150, and 180. Significance of the difference in a-wave and B-wave amplitudes between age-matched mutant Gpatch11Δ5/Δ5 and wild-type mice was determined through a post hoc Sidak test following a two-way ANOVA. Bars show means ± SEM from nine mice per genotype. n.s. not significant. *p ≤ 0.05, **p ≤ 0.01, ***p ≤ 0.001, ****p ≤ 0.0001. b Spider graph presenting outer nuclear layer (ONL) thickness in wild-type (WT, black) and Gpatch11Δ5/Δ5 (red) mice at 15, 60, 120, and 180 days. The ONL thickness of age-matched mutant Gpatch11Δ5/Δ5 and wild-type mice were compared using a two-way ANOVA with a post hoc Sidak test. Bars represent means ± SEM from three mice per genotype. *p ≤ 0.05, **p ≤ 0.01, ***p ≤ 0.001, ****p ≤ 0.0001. c Immunostaining of retina sections with anti-GPATCH11 (magenta) antibody. Nuclei are stained with DAPI (blue). Scale bars, 50 µm. d Quantification of GPATCH11 protein expression in the ONL, inner nuclear layer (INL), and ganglion cell layer (GCL) in wild-type (WT, black) and mutant Gpatch11Δ5/Δ5 (red) mice. The mean intensity of GPATCH11 of age-matched mutant Gpatch11Δ5/Δ5 and wild-type mice was compared using a two-way ANOVA with a post-hoc Sidak test. Bars represent means ± SEM from three biological replicates. n.s. not significant. *p ≤ 0.05, **p ≤ 0.01, ***p ≤ 0.001. Source data are provided as a Source Data file.
Fig. 5
Fig. 5. Behavioral tests in 1-month-old WT and Gpatch11Δ5/Δ5 mice and immunohistochemistry analysis of GPATCH11 on murine floating brain sections.
a Episodic memory assessment based on the Novel Object Recognition (NOR). Preference and Discrimination Indexes measurements. Behavioral data were estimated to be statistically significant when p ≤ 0.05 by One-tailed Student’s t-test. b Associative memory assessment using the Contextual Fear Conditioning (CFC). Percentage of freezing time index measured during training and testing phases, respectively. Behavioral data were estimated to be statistically significant when p ≤ 0.05 by Two-tailed Student’s t-test. Bars represent means ± SEM from 20 mice per genotype. ****p ≤ 0.0001. Boxplots show 25–75 percentiles and median; whiskers represent min and max values. c Immunostaining of floating brain sections of wildtype (WT) and Gpatch11Δ5/Δ5 with anti-GPATCH11 (magenta) and anti-CTIP2 (cyan) antibodies with a zoom on hippocampus. DAPI is used to label the cell nucleus (blue). Scale bars, 1 mm and 200 µm, respectively. Source data are provided as a Source Data file.
Fig. 6
Fig. 6. Whole-transcriptome analysis of gene expression in the retina of WT and Gpatch11Δ5/Δ5 mice.
a Volcano plot displaying differentially expressed genes between Gpatch11Δ5/Δ5 and wild-type (WT) mice. The x-axis represents the difference in gene expression fold change (FC) on a log2 scale, while the y-axis indicates the false discovery rate (FDR) adjusted significance on a log10 scale. Genes significantly upregulated are shown in orange, while downregulated genes are in blue. b Circular visualization depicting selected Gene Ontology (GO) enriched pathways. Up- (red dots) and downregulated genes (blue dots) within each GO pathway are plotted based on logFC. Z score bars indicate whether an entire biological process is more likely to be increased or decreased based on its constituent genes. c Heatmaps from Metascape displaying the GO pathways of interest. Blue represents low expression, while orange represents high expression. The raw data is accessible via BioStudies identifier S-BSST1157.
Fig. 7
Fig. 7. Whole-transcriptome analysis of splicing in the retina of WT and Gpatch11Δ5/Δ5 mice.
a Chart generated from rMATS analysis, illustrating that the majority of splicing events correspond to skipped exons. A5SS and A3SS represent alternative 5′ and 3′ splice sites, MXE indicates mutually exclusive exons, RI stands for retained introns, and SE denotes skipped exons. b Venn diagrams comparing differentially expressed genes (DEGs) and differentially spliced genes (DSGs) in Gpatch11Δ5/Δ5 as compared to wild-type (WT) retina samples, with a total of 12 dysregulated and mis-spliced transcripts. c Heatmaps depicting the expression levels of the 12 dysregulated and mis-spliced transcripts. Blue indicates low expression, while orange represents high expression. d Sashimi plots illustrating the alternate splicing event for Arr3 in retina samples from Gpatch11Δ5/Δ5 (red) and wild-type (WT, blue) mice. Orange highlights the alternative splicing events with numbers indicating the junction read count for each event. The raw data can be accessed via BioStudies and the identifier S-BSST1157. e Electrophoresis of Arr3 cDNA and (f) Western blot analysis and ARR3 protein relative to β-Catenin in wild-type (WT) and Gpatch11Δ5/Δ5 retina samples. Blots are representative of three independent experiments. Source data are provided as a Source Data file.
Fig. 8
Fig. 8. Proteomic study identified 3 proteins FGF2, HSPB1, and PSMB4 with higher abundance in Gpatch11Δ5/Δ5 compared to WT, after immunoprecipitation of GPATCH11.
a Volcano plot displaying differentially expressed proteins between WT and Gpatch11Δ5/Δ5 mice retina. The x-axis represents the difference in protein expression on a log2 scale, while the y-axis indicates the p-value. The significance of variations among samples was estimated using the Two-sided Student’s t-test. b Violin plots representing the abundance of the FGF2, HSPB1, and PSMB4 proteins. In blue: abundance in Gpatch11Δ5/Δ5 mice retina; in yellow: abundance in WT mice retina; in green: abundance with IgG immunoprecipitation. Each dot represents data for one mice. Black dots represent imputed data. The raw data is accessible via ProteomeXchange with the identifier PXD051363.

References

    1. Griffin, C. & Saint-Jeannet, J.-P. Spliceosomopathies: diseases and mechanisms. Dev. Dyn. Publ. Am. Assoc. Anat.249, 1038–1046 (2020). - PMC - PubMed
    1. Bohnsack, K. E., Ficner, R., Bohnsack, M. T. & Jonas, S. Regulation of DEAH-box RNA helicases by G-patch proteins. Biol. Chem.402, 561–579 (2021). - PubMed
    1. Robert-Paganin, J., Réty, S. & Leulliot, N. Regulation of DEAH/RHA helicases by G-patch proteins. BioMed. Res. Int.2015, 931857 (2015). - PMC - PubMed
    1. Studer, M. K., Ivanović, L., Weber, M. E., Marti, S. & Jonas, S. Structural basis for DEAH-helicase activation by G-patch proteins. Proc. Natl. Acad. Sci. USA117, 7159–7170 (2020). - PMC - PubMed
    1. Abdelhaleem, M. Helicases: an Overview. in Helicases (ed. Abdelhaleem, M. M.) 587 1–12 (Humana Press, 2009).

Publication types

LinkOut - more resources