. 2024 Nov 21;14(1):28856.
doi: 10.1038/s41598-024-77817-5.

Multi-layered proteomics identifies insulin-induced upregulation of the EphA2 receptor via the ERK pathway which is dependent on low IGF1R level

Affiliations

Multi-layered proteomics identifies insulin-induced upregulation of the EphA2 receptor via the ERK pathway which is dependent on low IGF1R level

Sarah Hyllekvist Jørgensen et al. Sci Rep. .

Abstract

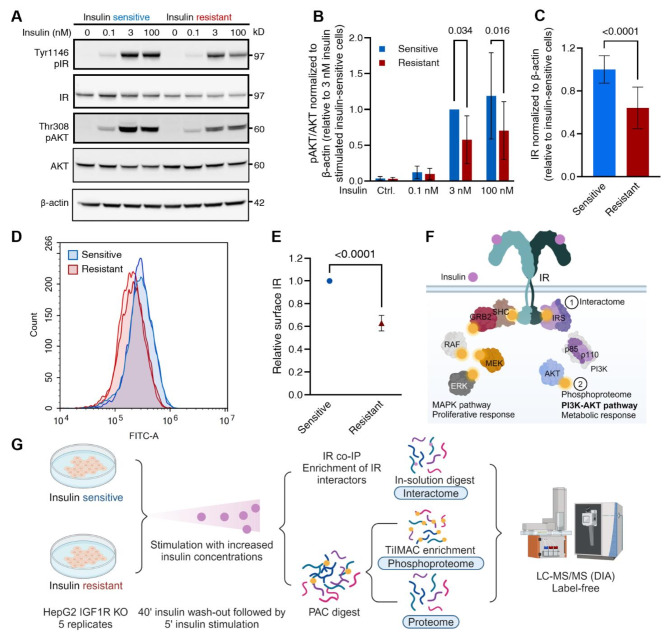
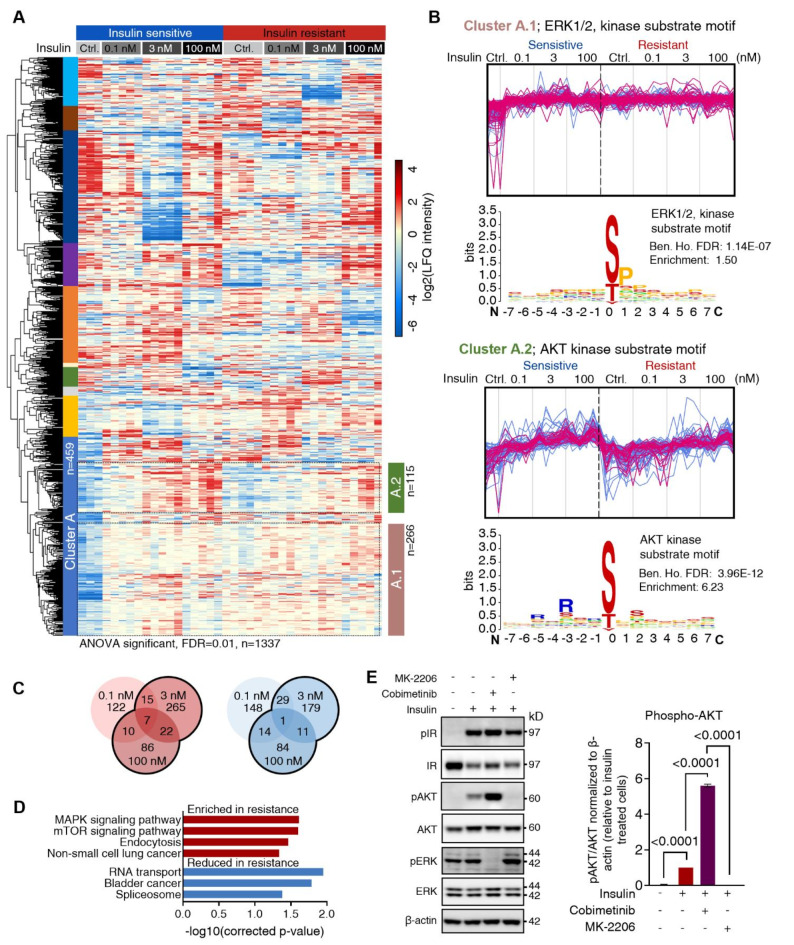
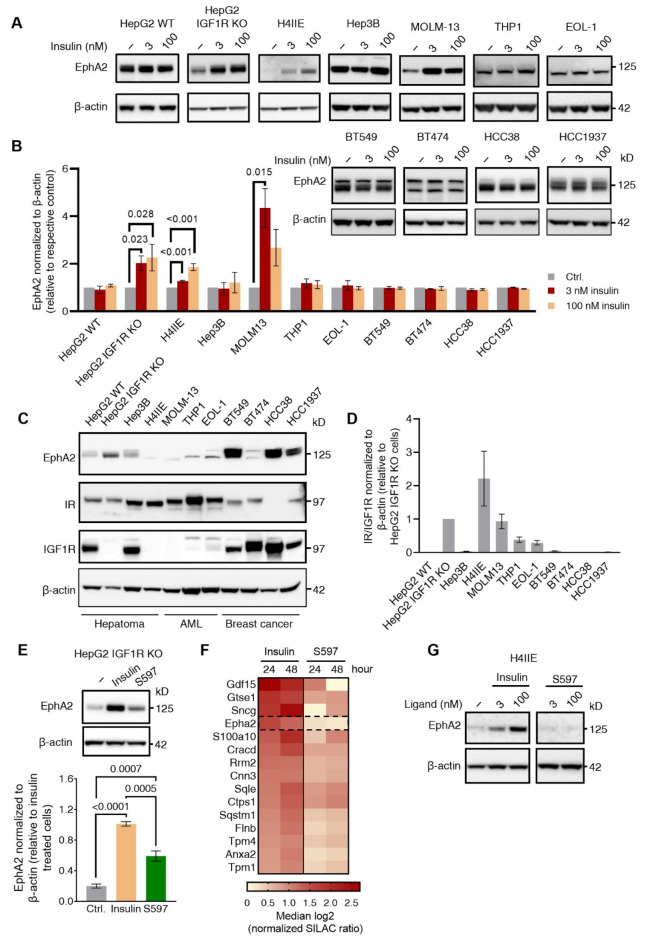
Insulin resistance impairs the cellular insulin response, and often precedes metabolic disorders, like type 2 diabetes, impacting an increasing number of people globally. Understanding the molecular mechanisms in hepatic insulin resistance is essential for early preventive treatments. To elucidate changes in insulin signal transduction associated with hepatocellular resistance, we employed a multi-layered mass spectrometry-based proteomics approach focused on insulin receptor (IR) signaling at the interactome, phosphoproteome, and proteome levels in a long-term hyperinsulinemia-induced insulin-resistant HepG2 cell line with a knockout of the insulin-like growth factor 1 receptor (IGF1R KO). The analysis revealed insulin-stimulated recruitment of the PI3K complex in both insulin-sensitive and -resistant cells. Phosphoproteomics showed attenuated signaling via the metabolic PI3K-AKT pathway but sustained extracellular signal-regulated kinase (ERK) activity in insulin-resistant cells. At the proteome level, the ephrin type-A receptor 2 (EphA2) showed an insulin-induced increase in expression, which occurred through the ERK signaling pathway and was concordantly independent of insulin resistance. Induction of EphA2 by insulin was confirmed in additional cell lines and observed uniquely in cells with high IR-to-IGF1R ratio. The multi-layered proteomics dataset provided insights into insulin signaling, serving as a resource to generate and test hypotheses, leading to an improved understanding of insulin resistance.


Conflict of interest statement

Declarations. Competing interests: S.H.J, A.K.P, H.F.K, D.D, P.K.N, R.S, L.N.A, T.Å.P, and M.G are current or previous employees at Novo Nordisk A/S and are shareholders in the company. CPR is supported by a grant from the Novo Nordisk Foundation. K.B.E and J.V.O declare no competing interests.

Figures

Fig. 1
Fig. 1
Reduced IR protein and AKT phosphorylation levels in insulin-resistant HepG2 IGF1R KO cells applied in a multi-layered proteomics experiment. (A) Immunoblot of insulin-sensitive and -resistant HepG2 IGF1R KO cell lysates. The cells were stimulated with increasing insulin concentrations for 5 min (representative blot of n = 4 independent experiments). (B) Phospho-AKT levels were quantified from the immunoblot shown in A and normalized to total AKT and β-actin. Insulin-sensitive and -resistant cells were stimulated with 0.1, 3, and 100 nM insulin. Unstimulated control included. Data presented as means ± SD of n = 3 independent experiments relative to insulin-sensitive cells stimulated with 3 nM insulin. p-values < 0.05 are indicated (2-way ANOVA). (C) Immunoblot quantification of IR protein levels, relative to β-actin under insulin-sensitive and -resistant conditions, independent of 5-min insulin stimulation. The data are represented as means ± SD relative to the insulin-sensitive cells (two-sample unpaired t-test) (four technical replicates from n = 4 independent experiments). (D) Flow cytometry histograms showing the average FITC signal for cell-surface IR in insulin-sensitive (blue) and -resistant (red) HepG2 IGF1R KO cells. Representative of n = 4 independent experiments in technical duplicates. (E) Quantification of surface IR levels in insulin-resistant relative to -sensitive cells, based on flow cytometry data in (D). (F) Schematic illustration of canonical insulin signaling pathways through the IR. (G) Workflow illustration for data-independent acquisition (DIA) MS-based interactome, phosphoproteome, and single-shot proteome analyses. Cell lysates of insulin-sensitive and -resistant cells stimulated with 0.1, 3, and 100 nM insulin for 5 min were collected. See Fig. S1E.
Fig. 2
Fig. 2
Insulin receptor interactome analysis reveals distinct signaling responses in insulin-sensitive and insulin-resistant cells. (A) IR sequence coverage after co-IP and listing of top 10 proteins in the co-IP dataset sorted by MS-based identified precursors, after filtration. (B) Number of proteins in the IR co-IP dataset after analysis filtering steps, including filtering using the Contaminant Repository for Affinity Purification (CRAPome). (C) Protein network of a subset of the strongest candidate IR interactors, showing kinases, proteins associated with insulin signaling, and proteins containing specific protein-protein interaction domains (SH2, SH3, PH, and Cbl-PTM domains). Node size indicates the number of annotated precursors, node color reflects connectivity within the network, and edge color represents the ratio of annotated precursors in unstimulated insulin-resistant versus sensitive conditions. (D) Significantly enriched KEGG pathways for candidate IR interactors (n = 207). (E) Heatmap of the filtered insulin-dependent IR interactome displaying the fold-change upon stimulation with 3 or 100 nM insulin compared to unstimulated controls in insulin-sensitive and insulin-resistant HepG2 IGF1R KO cells. Interactors significantly recruited in at least one of the conditions are included (two-sided t-test, FDR < 0.05, s0 = 0.1) (Fig. S3). Clustered based on hierarchical clustering, divided into 6 clusters (LIN7A in the bottom clustered alone). Cluster 2 (blue frame) and 4 (red frame) display a tendency for stronger interactions in insulin-sensitive and resistant cells, respectively. Colored circles, right to gene names, denote the primary molecular function of the interactors, with a specification box to the left. (F) Venn diagram showing the overlap of significant insulin-dependent IR interactors after stimulation with 3 or 100 nM insulin in insulin-sensitive and -resistant cells. Gene names are shown for proteins identified in more than one condition.
Fig. 3
Fig. 3
Phosphoproteomics reveals sustained ERK signaling in insulin resistance. (A) Hierarchical clustering of significantly regulated phospho-site levels in response to stimulation with 0.1, 3, or 100 nM insulin in insulin-sensitive and insulin-resistant cells (n = 1337; ANOVA; FDR < 0.01, s0 = 0.1). With 10 clusters defined from hierarchical clustering, shown as left color-bar, and subclusters of A, shown to the right. (B) Cluster profile and enriched sequence motif analysis for subcluster A.1 and A.2 shown in (A), for motifs with strongest enrichment and lowest Benjamin-Hochberg (Ben. Ho.) FDR-corrected p-values. The profiles for phosphorylation sites with ERK (top) and AKT (bottom) sequence motifs are highlighted in purple. (C) Venn diagram showing numbers of differentially regulated (2-fold change, p < 0.05) phosphorylation sites between insulin-sensitive and resistant cells. Showes sites with induced levels in insulin-resistant (red) or in sensitivity (blue) upon stimulation with 0.1, 3, or 100 nM insulin. (D) KEGG pathway enrichment analysis of upregulated phosphoproteins following 3 or 100 nM insulin stimulation in insulin-sensitive and -resistant cells (2-fold change, p < 0.05). (E) Immunoblot (left) and quantification (right) of HepG2 IGF1R KO cells stimulated for 24 h with 3 nM insulin without or with inhibition of AKT (MK-2206) or MEK (cobimetinib). Representative blot of n = 3 independent biological replicates with p-values < 0.05 annotated (two-sample unpaired t-test).
Fig. 4
Fig. 4
Proteome analysis shows upregulated EphA2 expression levels in insulin-resistant cells and uncovers it as an insulin-inducible gene. (A) Overview of proteome data: Proteins identified from the SDS-proteome dataset specifying regulated proteins in insulin-sensitive and -resistant cells. Significance based on volcano-plot in Fig. 4B made in Perseus (two-sided t-test, FDR < 0.05, s0 = 0.1). (B) Volcano plot presenting differentially regulated proteins in insulin-sensitive and resistant SDS-based cell lysates from single-shot proteome MS analysis. Significantly regulated proteins are highlighted in orange (FDR < 0.05, S0 = 0.1). Zoomed view shows upregulated proteins in insulin-resistant cells, with kinases labeled with gene names (n = 4 independent biological experiments). (C) KEGG term analysis of proteins significantly upregulated (red) or downregulated (blue) in insulin resistance. (D) Venn diagram showing overlap of upregulated proteins across the three layers of proteomics analysis. Insulin-sensitive and -resistant cells are shown in blue and red, respectively. (E) Immunoblot and quantification of EphA2 abundance in lysates from insulin-sensitive and -resistant cells (n = 4 independent biological experiments). (F) Immunoblot and quantification of EphA2 in unstimulated cells (48-h serum-starved control; ctrl.) or cells subjected to the insulin resistance-induction protocol (including 48-h 3 nM insulin treatment). (G) qPCR results of the mRNA levels of EPHA2 in HepG2 IGF1R KO cells treated as specified in (E,F). Median of six technical replicates for n = 4 biological independent replicates.
Fig. 5
Fig. 5
Induction of EphA2 by insulin correlates with a high IR-to-IGF1R ratio and the insulin agonist 597 does not show the same EphA2-inducing characteristics. (A) Immunoblot of EphA2 in a panel of screened hepatoma, breast cancer, and acute myeloid leukemia (AML) cell lines serum-starved or treated with 3 or 100 nM insulin for 24 h. Representative of n = 2 (n = 3 for H4IIE and Hep3B) biological independent experiments. (B) Quantification of immunoblot in (A). EphA2 protein levels after insulin stimulation relative to untreated (ctrl.) for individual cell lines (two-sample unpaired t-test). Normalized to β-actin levels. (C) Immunoblot of EphA2, IR, and IGF1R in the cell panel shown in (A) and (B). Representative of n = 2 biological independent replicates. (D) Quantification of the relative IR-to-IGF1R ratios from immunoblot in (C), normalized to β-actin levels. (E) Immunoblot and quantification of EphA2 in HepG2 IGF1R KO cells untreated or treated with 100 nM insulin or the partial IR agonist S597 for 24-hours (two-sample unpaired t-test) (n = 4 independent biological experiments). (F) Heatmap of median log2 protein SILAC ratios for significantly insulin-induced protein levels in H4IIE cells (significance B testing, FDR < 0.05). Cells were cultured with 100 nM insulin or S597 for 24–48 h (n = 3 independent biological experiments). (G) Representative immunoblot of EphA2 in H4IIE cells treated for 24 h with 100 nM insulin or S597 (two-sample unpaired t-test) (n = 3 independent biological replicates).
Fig. 6
Fig. 6
SILAC phosphoproteomics validates primary AKT-directed response by S597 and reveals insulin-mediated EphA2 expression via the MAPK pathway. (A) Heatmap displaying phosphorylation site SILAC ratios regulated ≥ 2-fold after 5-, 15-, or 30-min stimulation with 100 nM insulin or S597 in H4IIE, in at least one condition. The cluster with the overrepresented KEGG insulin signaling pathway is marked. Median SILAC ratios from n = 2 independent experiments. (B) Plot illustrating KEGG insulin signaling pathway phosphorylation sites (labeled cluster in A). Median SILAC ratio, averaged for all time points for insulin (solid yellow) and S597 (hollow green). Regulatory sites are color-coded based on whether phosphorylation induces (blue) or inhibits (red) protein activity. (C) Immunoblot of HepG2 IGF1R KO lysates treated for 24 h with 1 µM MK-2206 (AKT) inhibitor, 1 µM cobimetinib (MEK) inhibitor, and 3 nM insulin. Immunoblots of pIR, IR, pAKT, AKT, pERK, and ERK are shown in Fig. 3E. (D) Quantification of EphA2 protein levels, based on immunoblot in (C). Normalized to β-actin levels. (E) Schematics depicting dysregulation of MAPK signaling in insulin resistance showing the connection to induced EphA2 expression levels and IR/IGF1R ratio dependence.

References

    1. Wilcox, G. Insulin and Insulin Resistance. Clin. Biochem. Rev.26 (2), 19–39 (2005). - PMC - PubMed
    1. Freeman, A. M., Pennings, N. & Acevedo, L. A. Insulin Resistance (StatPearls Publishing, 2023). - PubMed
    1. Parcha, V. et al. Insulin resistance and cardiometabolic risk profile among nondiabetic american young adults: insights from NHANES. J. Clin. Endocrinol. Metab.107 (1), E25–E37. 10.1210/clinem/dgab645 (2022). - PMC - PubMed
    1. Johnson, A. M. F. & Olefsky, J. M. The Origins and Drivers of Insulin Resistance. 10.1016/j.cell.2013.01.041 (Elsevier B.V., 2013). - PubMed
    1. Nolan, C. J. & Prentki, M. Insulin resistance and insulin hypersecretion in the metabolic syndrome and type 2 diabetes: Time for a conceptual framework shift. Diab. Vasc. Dis. Res.16(2), 118–127. 10.1177/1479164119827611 (2019). - PubMed