. 2025 Feb;9(2):376-390.
doi: 10.1038/s41562-024-02051-y. Epub 2024 Nov 21.

The shared genetic architecture and evolution of human language and musical rhythm

Collaborators, Affiliations

The shared genetic architecture and evolution of human language and musical rhythm

Gökberk Alagöz et al. Nat Hum Behav. 2025 Feb.

Abstract

This study aimed to test theoretical predictions over biological underpinnings of previously documented phenotypic correlations between human language-related and musical rhythm traits. Here, after identifying significant genetic correlations between rhythm, dyslexia and various language-related traits, we adapted multivariate methods to capture genetic signals common to genome-wide association studies of rhythm (N = 606,825) and dyslexia (N = 1,138,870). The results revealed 16 pleiotropic loci (P < 5 × 10⁻⁸) jointly associated with rhythm impairment and dyslexia, and intricate shared genetic and neurobiological architectures. The joint genetic signal was enriched for foetal and adult brain cell-specific regulatory regions, highlighting complex cellular composition in their shared underpinnings. Local genetic correlation with a key white matter tract (the left superior longitudinal fasciculus-I) substantiated hypotheses about auditory-motor connectivity as a genetically influenced, evolutionarily relevant neural endophenotype common to rhythm and language processing. Overall, we provide empirical evidence of multiple aspects of shared biology linking language and musical rhythm, contributing novel insight into the evolutionary relationships between human musicality and linguistic communication traits.


Conflict of interest statement

Competing interests: P.F. is employed by and holds stock or stock options in 23andMe, Inc. The other authors declare no competing interests.

Figures
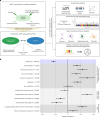
Fig. 1
Fig. 1. Study design and genetic correlations between rhythm and language or reading-related traits.
a, The flow chart shows the analyses performed in our study. SNP-heritability (SNP-h2) and genetic correlations were estimated using LDSC. The effect directions in the rhythm GWAS summary statistics were flipped to obtain a proxy to probe rhythm impairment. Genomic SEM was used to identify common and independent genetic factors of rhythm impairment and dyslexia. For post-mvGWAS analyses, we adopted various methods including LDSC partitioned heritability, GCTB SBayesS, LAVA and manual SNP lookups. b, The genetic correlation analysis results between musical rhythm and a set of language- and reading-related traits. The x axis indicates the magnitude of the genetic correlation (rg), with error bars extending one s.e.m. below or above the correlation estimate. The y axis shows 13 language or reading-related, cognitive, educational and neuroimaging traits. GWAS sample sizes (N) are reported next to the trait names. P values were estimated using a two-sided test and were FDR corrected for 13 tests (PFDR < 0.05). Significant genetic correlations (PFDR < 0.05) are indicated by full circles. Panel a created with BioRender.com.
Fig. 2
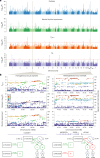
Fig. 2. Manhattan plots for univariate and mvGWASs and heterogeneity, including examples of highly homogeneous and heterogeneous loci in FgRI-D results.
a, Manhattan plots of dyslexia, musical rhythm GWASs, the common factor (FgRI-D) mvGWAS and the heterogeneity between dyslexia and musical rhythm impairment GWASs (Qb). The y axes show −log10(P) values; the x axes show chromosomal positions and datapoints represent SNPs. Dyslexia and musical rhythm GWASs were previously performed and published and are included here for illustration purposes. The mvGWAS results and heterogeneity estimates were obtained using a CPM in genomic SEM. Loci that pass the genome-wide significance threshold (P < 5 × 10−8) in FgRI-D and Qb Manhattan plots are listed in Supplementary Tables 2 and 3. The red lines correspond to the genome-wide significance threshold (P < 5 × 10−8). Nrhythm impairment = 606,825, Ndyslexia = 1,138,870. b, LocusZoom plots of example homogeneous and heterogeneous loci, chosen on the basis of Qb P values. The y axes show −log10(P) values, and the x axes show chromosomal positions of each SNP. Each triangle represents a SNP and the direction of the triangle indicates the sign of the GWAS effect (upwards, positive effects; downwards, negative effects). Colour codes correspond to the linkage disequilibrium with the lead SNP. The SNP loadings on D and RI indicate GWAS effect sizes and directions (left), whereas the SNP loadings in the SEM diagrams show IPM effect sizes and directions (right) of two example SNPs, reflecting the homogeneous versus heterogeneous architecture of the example loci, respectively. Fg, common genetic factor of dyslexia and musical rhythm impairment; D, dyslexia GWAS; RI, musical rhythm impairment GWAS; cM, centimorgan; u variables, residual variance not explained by the common factor.
Fig. 3
Fig. 3. S-PrediXcan and LDSC partitioned heritability results for regulatory brain cell type annotations.
a, Manhattan plot showing TWAS results on 13 brain tissue and whole-blood tissues. Each data point corresponds to a gene–tissue pair. The y axis shows −log10(P) values, and the x axis shows chromosomal positions of each gene–tissue pair. The most significant gene–tissue association pair is shown for each gene. The red line corresponds to the genome-wide significance threshold (P < 5 × 10−8). b, Bar plots showing LDSC SNP-h2 enrichment and depletion estimates for the common genetic factor of musical rhythm impairment and dyslexia (FgRI-D; Nrhythm impairment = 606,825 and Ndyslexia = 1,138,870) on the x axis and eight brain cell type-specific regulatory annotations on the y axis. P values were estimated using a two-sided test and FDR corrected for eight tests. The exact enrichment or depletion P values are reported in Supplementary Table 12. Error bars represent s.e.m., with whiskers extending one standard error below or above the SNP-h2 enrichment or depletion estimate.
Fig. 4
Fig. 4. Evolutionary analyses of dyslexia, rhythm impairment, FgRI-D and independent factors.
a, The timescales covered by the evolutionary annotations that we used. HGEs, human-gained enhancers; Ma, million years ago; ka, thousand years ago. b, LDSC partitioned SNP-h2 enrichment and depletion estimates on the x axis and annotation-trait pairs on the y axis (Nrhythm impairment = 606,825 and Ndyslexia = 1,138,870). Colour coding of the bars corresponds to evolutionary annotations in a. P values were estimated using a two-sided test. Green asterisks indicate statistical significance after FDR correction for 25 tests (PFDR < 0.05). Error bars represent s.e.m., with whiskers extending one standard error below or above the SNP-h2 enrichment or depletion estimate. The exact enrichment or depletion P values are reported in Supplementary Table 15. c, A scatter plot showing the association between FgRI-D mvGWAS −log10(P) values on the y axis and primate phastCons scores on the x axis. Lead SNPs in 17 genome-wide significant (P < 5 × 10−8) loci are highlighted in red (one genome-wide significant lead SNP does not have a phastCons score and is not shown here). The dashed red line indicates the mvGWAS genome-wide significance threshold (P < 5 × 10−8). d, The GCTB SBayesS selection coefficient estimates as posterior means shown on the x axis, for each trait on the y axis (note that the y axis is shared with b). The error bars represent s.d., with whiskers extending one s.d. below or above each coefficient. The vertical line is fixed at zero. (Nrhythm impairment = 606,825 and Ndyslexia = 1,138,870). e, The results of a manual look-up of the SNP rs10891314, showing its co-localization with DLAT. Each data point is a SNP, with the y axis showing FgRI-D mvGWAS −log10(P) values and the x axis showing genomic locations. Colour coding reflects Qb (heterogeneity) scores. The primate phastCons and primate phyloP graphs show patterns of conservation and accelerated evolution within the locus. rs10891314 is shown in red, and its phastCons and phyloP scores are shown with the green bar.

Update of

References

    1. Nayak, S. et al. The musical abilities, pleiotropy, language, and environment (MAPLE) framework for understanding musicality–language links across the lifespan. Neurobiol. Lang.3, 615–664 (2022). - PMC - PubMed
    1. Politimou, N., Dalla Bella, S., Farrugia, N. & Franco, F. Born to speak and sing: musical predictors of language development in pre-schoolers. Front. Psychol.10, 948 (2019). - PMC - PubMed
    1. Dalla Bella, S. et al. BAASTA: battery for the assessment of auditory sensorimotor and timing abilities. Behav. Res. 49, 1128–1145 (2017). - PubMed
    1. Tarar, J. M., Meisinger, E. B. & Dickens, R. H. Test review: test of word reading efficiency–second edition (TOWRE-2) by Torgesen, J. K., Wagner, R. K. & Rashotte, C. A. Can. J. Sch. Psychol.30, 320–326 (2015).
    1. Lundetræ, K. & Thomson, J. M. Rhythm production at school entry as a predictor of poor reading and spelling at the end of first grade. Read. Writ.31, 215–237 (2018). - PMC - PubMed

LinkOut - more resources