. 2024 Dec;3(12):1516-1530.
doi: 10.1038/s44161-024-00567-0. Epub 2024 Nov 21.

Integrative proteomic analyses across common cardiac diseases yield mechanistic insights and enhanced prediction

Affiliations

Integrative proteomic analyses across common cardiac diseases yield mechanistic insights and enhanced prediction

Art Schuermans et al. Nat Cardiovasc Res. 2024 Dec.

Abstract

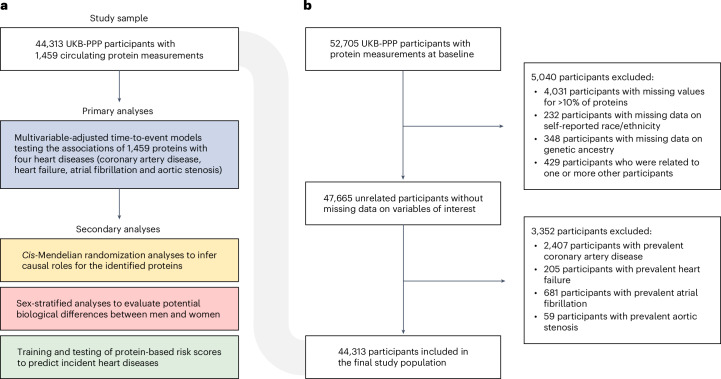
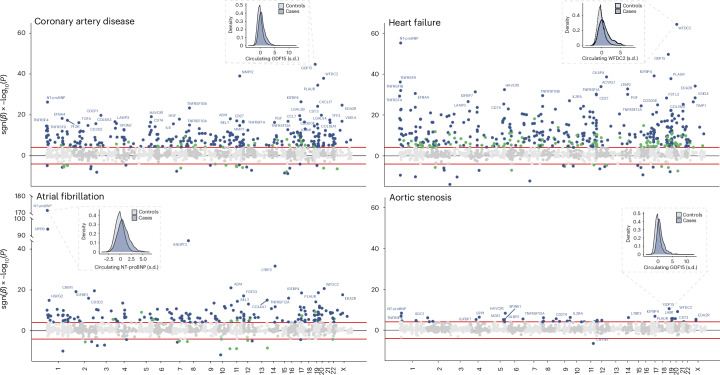
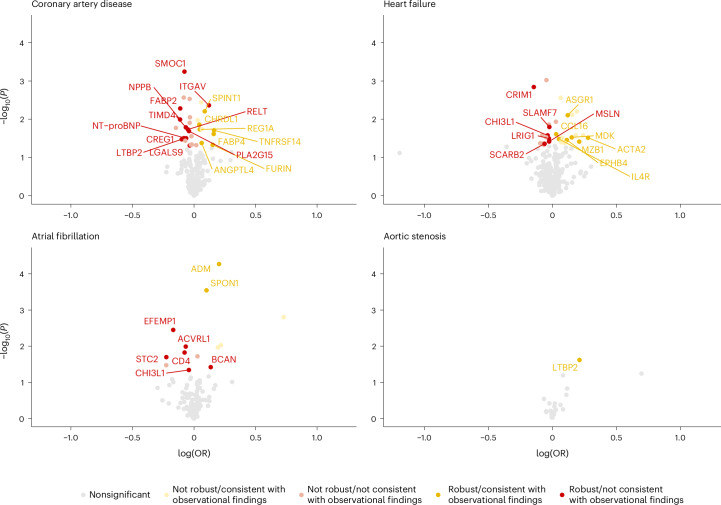
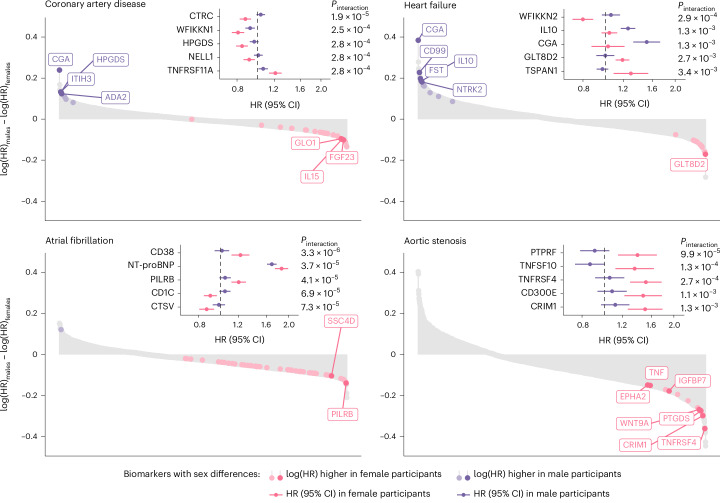
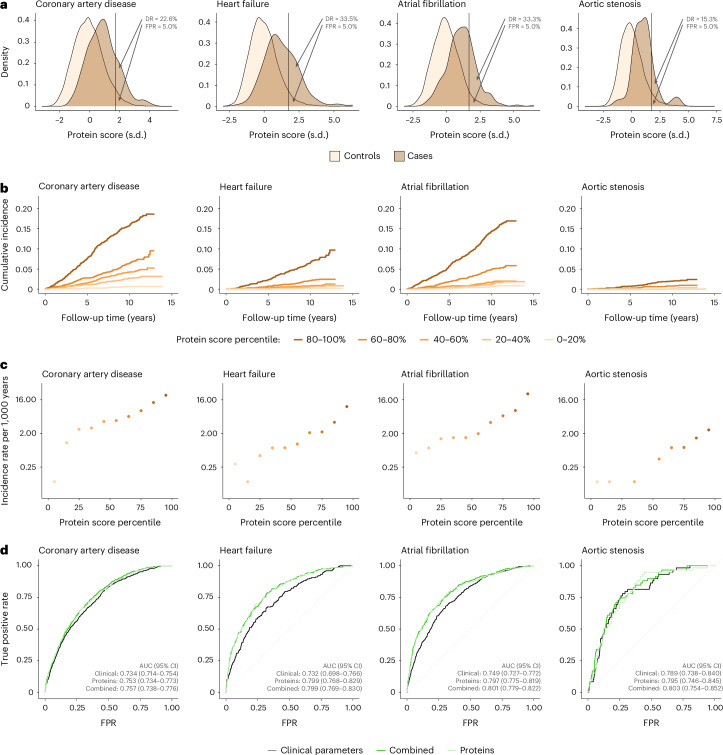
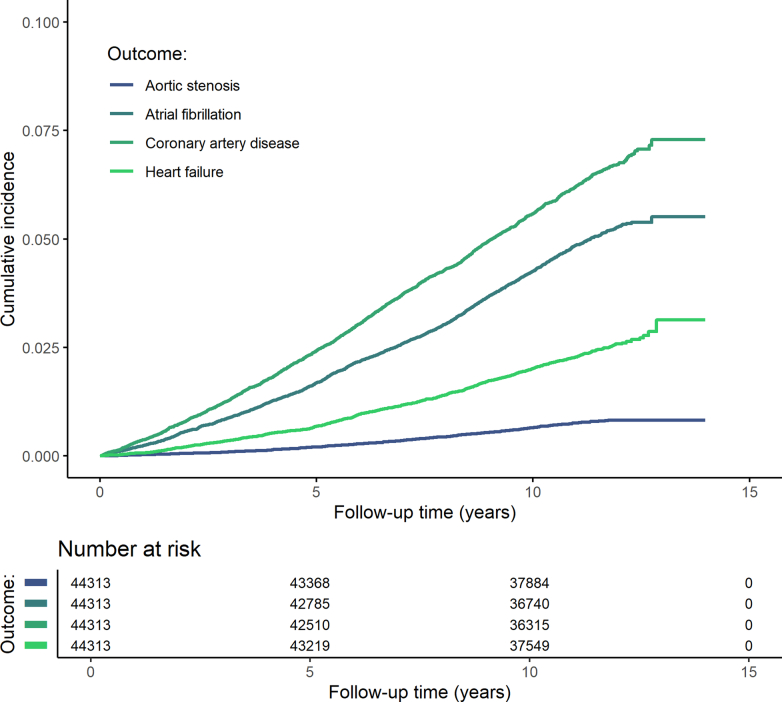
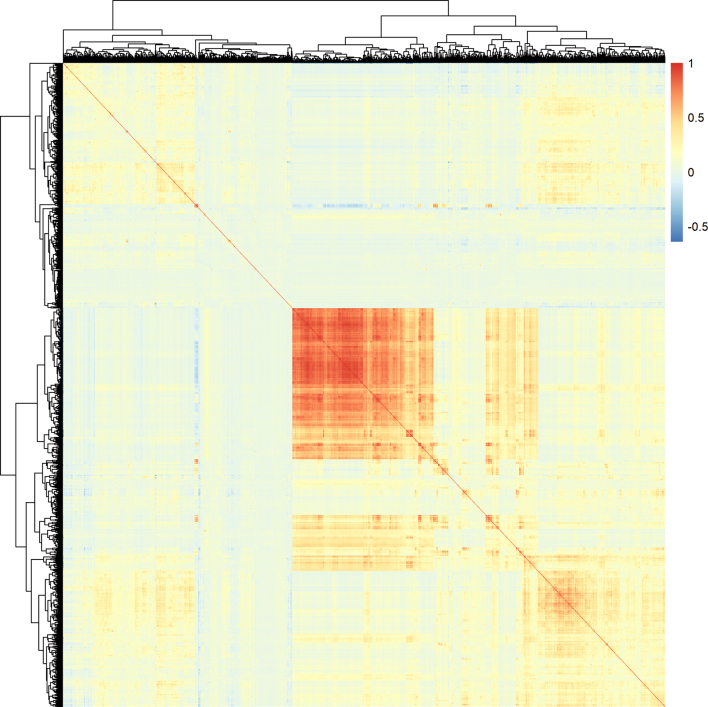
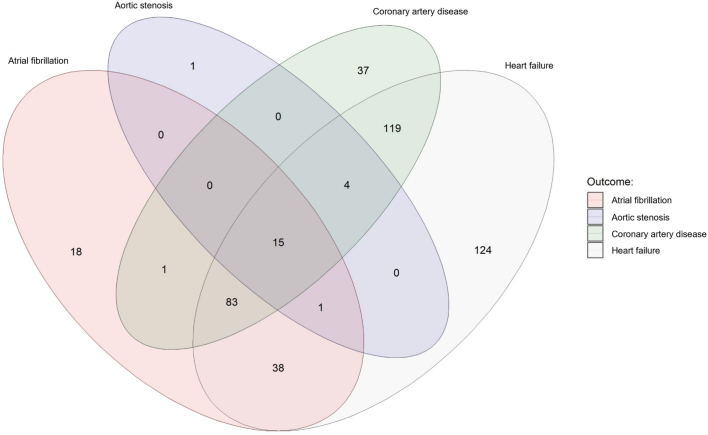
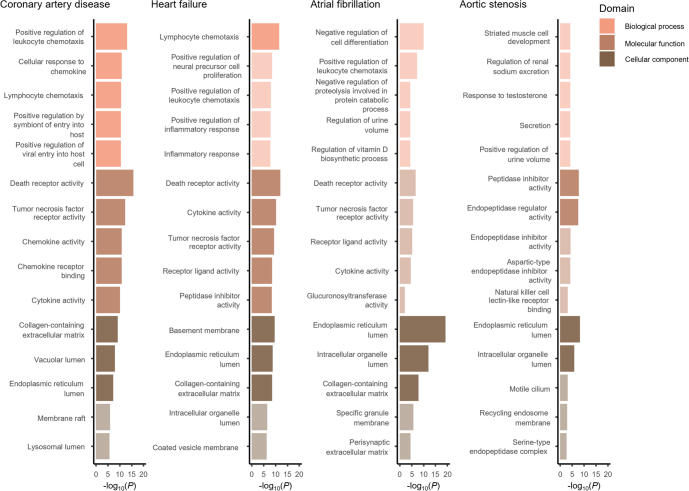
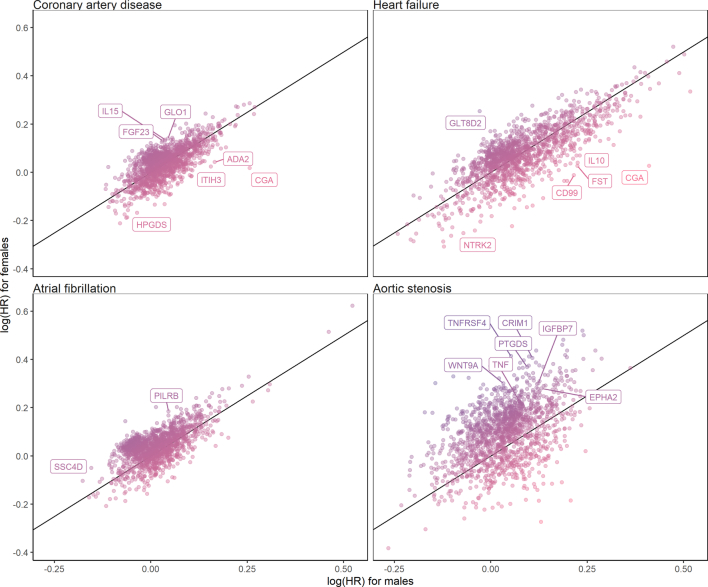
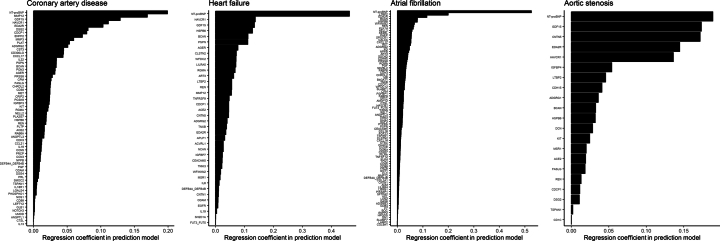
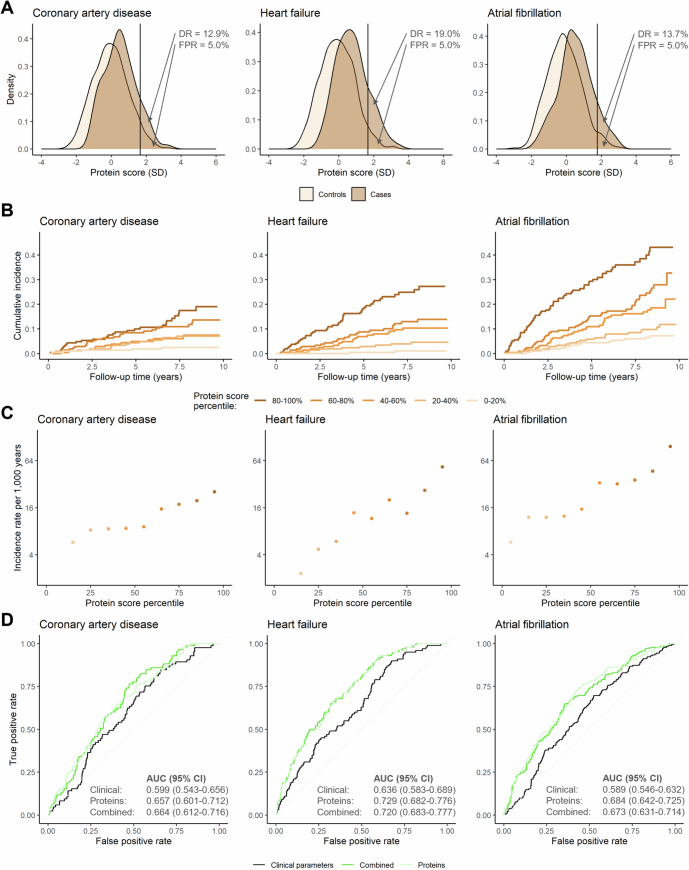
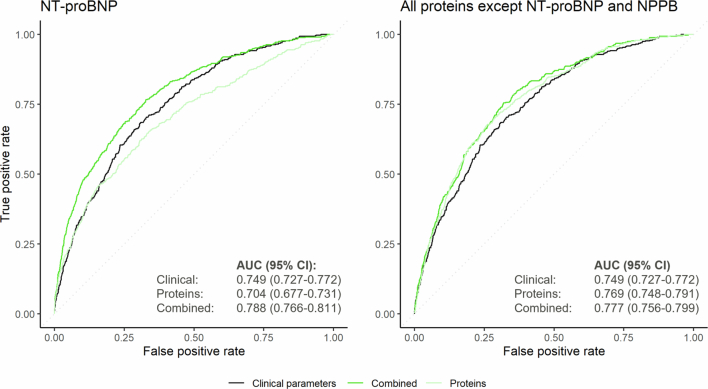
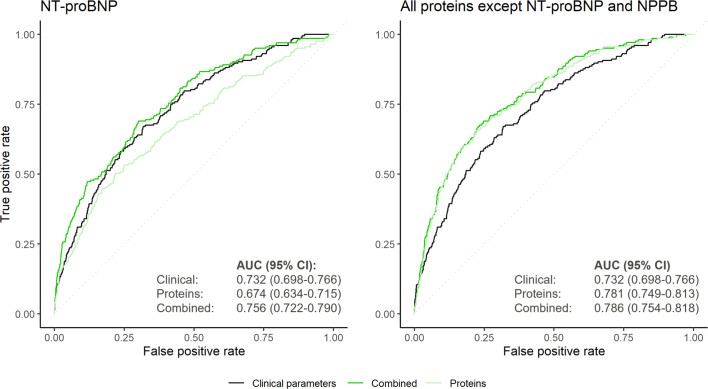
Cardiac diseases represent common highly morbid conditions for which molecular mechanisms remain incompletely understood. Here we report the analysis of 1,459 protein measurements in 44,313 UK Biobank participants to characterize the circulating proteome associated with incident coronary artery disease, heart failure, atrial fibrillation and aortic stenosis. Multivariable-adjusted Cox regression identified 820 protein-disease associations-including 441 proteins-at Bonferroni-adjusted P < 8.6 × 10⁻⁶. Cis-Mendelian randomization suggested causal roles aligning with epidemiological findings for 4% of proteins identified in primary analyses, prioritizing therapeutic targets across cardiac diseases (for example, spondin-1 for atrial fibrillation and the Kunitz-type protease inhibitor 1 for coronary artery disease). Interaction analyses identified seven protein-disease associations that differed Bonferroni-significantly by sex. Models incorporating proteomic data (versus clinical risk factors alone) improved prediction for coronary artery disease, heart failure and atrial fibrillation. These results lay a foundation for future investigations to uncover disease mechanisms and assess the utility of protein-based prevention strategies for cardiac diseases.


Conflict of interest statement

Inclusion and ethics: Inclusion and ethics standards have been reviewed where applicable. Competing interests: J.L.J. reports board membership of Imbria Pharmaceuticals; grant support from Abbott Diagnostics, AstraZeneca, BMS, HeartFlow and Novartis; previous consulting income from Abbott Diagnostics, AstraZeneca, Bayer, Beckman Coulter, Jana Care, Janssen, Novartis, Quidel, Roche Diagnostics and Siemens; and clinical end point committee/data safety monitoring board membership for Abbott, Bayer, AbbVie, CVRx, Pfizer, Roche Diagnostics and Takeda. M.C.H. reports consulting fees from CRISPR Therapeutics and Comanche Biopharma; advisory board service for Miga Health; and grant support from Genentech. P.N. reports research grants from Allelica, Amgen, Apple, Boston Scientific, Genentech/Roche and Novartis; personal fees from Allelica, Apple, AstraZeneca, Blackstone Life Sciences, Creative Education Concepts, CRISPR Therapeutics, Eli Lilly & Co, Esperion Therapeutics, Foresite Capital, Foresite Labs, Genentech / Roche, GV, HeartFlow, Magnet Biomedicine, Merck, Novartis, TenSixteen Bio and Tourmaline Bio; equity in Bolt, Candela, Mercury, MyOme, Parameter Health, Preciseli and TenSixteen Bio; and spousal employment at Vertex Pharmaceuticals, all unrelated to the present work. The other authors declare no competing interests.

Figures

Fig. 1
Fig. 1. Visual representation of the study design and participant inclusion and exclusion criteria.
The present study tested the associations of circulating proteins with common cardiac diseases (coronary artery disease, heart failure, atrial fibrillation and aortic stenosis) in the UKB-PPP. Primary analyses tested the epidemiological associations of 1,459 circulating proteins with cardiac diseases in 44,313 UKB-PPP participants without these diseases at baseline. Secondary analyses performed cis-MR analyses, tested for sex-specific effects and trained and tested protein-based risk scores. a, Study design. b, Participant inclusion and exclusion criteria.
Fig. 2
Fig. 2. Associations of circulating protein levels with incident coronary artery disease, heart failure, atrial fibrillation and aortic stenosis.
Miami plots visualize the associations of all 1,459 Olink proteins with coronary artery disease, heart failure, atrial fibrillation and aortic stenosis, tested using multivariable-adjusted Cox proportional hazards models (Methods). The y axis indicates the −log10(P) value for each association, multiplied by 1 if the association was positive (β > 0) or −1 if the association was negative (β < 0). The x axis indicates the genetic position of each protein’s encoding gene. Protein–disease associations with Bonferroni-corrected two-sided P < 0.05 (P < 0.05/5,836 or ~8.6 × 10−6) are shown in blue (if the protein was associated with more than one outcome) or green (if the protein was not associated with more than one outcome). The probability density functions show the distributions of the strongest protein–disease associations in cases (dark blue) versus controls (light blue) for each outcome. These analyses included 44,313 UKB-PPP participants, among whom 2,729 experienced coronary artery disease, 2,107 heart failure, 1,014 atrial fibrillation and 326 aortic stenosis events during follow-up. Source data
Fig. 3
Fig. 3. Associations of genetically predicted protein levels with coronary artery disease, heart failure, atrial fibrillation and aortic stenosis.
The volcano plots visualize the genetic associations of all proteins identified in primary analyses with their corresponding outcomes, by plotting each association’s −log10(P) against the corresponding log(OR) per s.d. increase in genetically predicted protein levels. All analyses represent cis-MR analyses using the IVW (for instruments with two or more variants) or Wald ratio method (for instruments with one variant). Genetic instruments were constructed using cis-variants associated with circulating protein levels at P < 1 × 10−4 clumped at R2 < 0.1. Associations with two-sided P < 0.05 (not corrected for multiple comparisons) are shown in yellow (if the primary cis-MR analysis was directionally consistent with the observational analysis) or red (if the primary cis-MR analysis was not directionally consistent with the observational analysis). Bright colors and protein labels indicate robustness against sensitivity analyses (Methods), whereas dull colors indicate no robustness against sensitivity analyses. OR, odds ratio. Source data
Fig. 4
Fig. 4. Sex-specific protein–disease associations and protein-by-sex interactions for coronary artery disease, heart failure, atrial fibrillation and aortic stenosis.
Lollipop plots depict the differences in effect sizes between male and female participants (log(HR)males − log(HR)females) for all tested protein–disease associations. Bright colors with labels represent proteins with two-sided P < 0.05/5,836 (Bonferroni-corrected) in one sex without nominal significance (two-sided P > 0.05) in the other sex; dull colors represent proteins with P < 0.05/5,836 in one sex and at least nominal significance (two-sided P < 0.05) in the other sex. In addition, all proteins indicated in color had suggestive evidence for interaction by sex (two-sided Pinteraction < 0.05). Forest plots depict the sex-stratified protein–disease associations (purple for men, pink for women) for the five proteins with the strongest sex–protein interactions. In these forest plots, central points indicate the HR of the indicated protein (per s.d.) with the indicated outcome stratified by sex (with corresponding 95% CIs). Pinteraction indicates the P value for the interaction term between ‘sex’ and the indicated protein on the corresponding outcome. All associations were tested using multivariable-adjusted Cox proportional hazards models (Methods) in 19,612 male and 24,701 female participants. Source data
Fig. 5
Fig. 5. Risk stratification and prediction of incident coronary artery disease, heart failure, atrial fibrillation and aortic stenosis by protein-based risk scores in the UKB-PPP.
a, Distributions of protein-based risk scores in cases and controls. b, Cumulative incidence of each outcome (calculated using the Kaplan–Meier method) by protein-based score quintiles. c, Incidence rate estimates according to protein-based score deciles on a logarithmically scaled y axis. d, Accuracies of the clinical, proteomic and combined risk scores in predicting the indicated outcomes (quantified using the ROC AUC) with corresponding 95% CI. For a, the vertical lines indicate the protein-based risk score values corresponding to an FPR of 5.0%; the DRs indicate ‘exact’ detection rates, calculated as the unadjusted proportions of cases with a positive test result at the corresponding protein-based risk score threshold. For b, incidence rate estimates are not displayed if the incidence in a protein score percentile bin was zero. All analyses were performed in the UKB-PPP testing set (n = 8,863). During a median (IQR) follow-up of 11.1 (10.4–11.8) years, 566 participants in the UKB-PPP testing set experienced coronary artery disease events, 203 experienced heart failure, 432 atrial fibrillation and 59 aortic stenosis. Source data
Extended Data Fig. 1
Extended Data Fig. 1. Cumulative incidence of coronary artery disease, heart failure, atrial fibrillation, and aotic stenosis during follow-up.
Cumulative incidence plots were constructed using the Kaplan–Meier method. Participants were followed for a median (interquartile range) follow-up of 11.1 (10.4–11.8) years. Source data
Extended Data Fig. 2
Extended Data Fig. 2. Correlations among circulating proteins measured at baseline.
All colored boxes represent Pearson correlation coefficients (r) indicating the correlations between the proteins that were measured in the final study cohort (N = 44,313). Red boxes indicate positive correlations between proteins (r > 0), whereas blue boxes indicate negative correlations between proteins (r < 0). Pearson correlation coefficients are provided in Supplementary Table 3. Each row and each column each represent one circulating protein. Proteins were clustered using a hierarchical cluster analysis based on the “complete linkage method”. Hierarchical clustering was performed using the hclust() function in R. The heat plot was constructed using the pheatmap() function (pheatmap package in R). Source data
Extended Data Fig. 3
Extended Data Fig. 3. Venn diagram showing the number of distinct and shared protein associations across outcomes.
All 441 proteins that were associated with one or more outcomes at Bonferroni-corrected P < 0.05 are represented in this graph. Source data
Extended Data Fig. 4
Extended Data Fig. 4. Top biological processes, molecular functions, and cellular components enriched among proteins associated with coronary artery disease, heart failure, atrial fibrillation, and aortic stenosis.
Top biological functions, molecular pathways, and cellular components were queried using the Gene Ontology resource, via Enrichr. Enrichment tests were performed against a background gene set that included the genes corresponding to all 1,459 proteins tested in primary analyses. Gene sets with a false discovery rate-adjusted two-sided P < 0.05 were considered statistically significant. Bright colors indicate statistical significance, whereas dull colors indicate no statistical significance. All P-values shown were unadjusted for multiple comparisons. Source data
Extended Data Fig. 5
Extended Data Fig. 5. Correlation between the effect sizes of protein–disease associations in male vs. female participants.
The scatter plots depict the correlation between the protein–disease associations’ effect sizes (that is, log[HR]) in female vs. male participants. HR indicates hazard ratio. All estimates were calculated using multivariable-adjusted Cox proportional hazards models, adjusted for age, age², self-reported race/ethnicity, the first ten principal components of genetic ancestry, smoking, normalized Townsend deprivation index, body mass index, systolic blood pressure, antihypertensive medication use, total cholesterol, high-density lipoprotein cholesterol, cholesterol-lowering medication use, serum creatinine, and prevalent type 2 diabetes. In addition, we included the cardiac outcomes that were not tested (for example, heart failure, atrial fibrillation, and aortic stenosis for incident coronary artery disease models) as time-varying covariates. The labeled protein–disease represent proteins that were associated with the indicated outcome at two-sided P < 0.05/5,836 (that is, Bonferroni-adjusted) in one sex without nominal significance (two-sided unadjusted P > 0.05) in the other sex. In addition, all proteins indicated in color had suggestive evidence for interaction by sex (two-sided unadjusted Pinteraction < 0.05). HR indicates hazard ratio. Source data
Extended Data Fig. 6
Extended Data Fig. 6. Protein weights for the primary protein-based prediction models of coronary artery disease, heart failure, atrial fibrillation, and aortic stenosis.
Each bar indicates the protein weights (that is, the absolute value of the corresponding regression coefficients). Source data
Extended Data Fig. 7
Extended Data Fig. 7. WHI-LLS participant inclusion and exclusion criteria for external validation analyses.
External validation analyses tested the performance of protein-based risk scores to predict incident coronary artery disease, heart failure, and atrial fibrillation in 1,083 participants from the Women’s Health Initiative who attended the Long Life Study (WHI-LLS).
Extended Data Fig. 8
Extended Data Fig. 8. Risk (A–C) stratification and (D) prediction of incident coronary artery disease, heart failure, atrial fibrillation, and aortic stenosis by protein-based risk scores in the WHI-LLS.
The indicated plots depict (A) the distributions of protein-based risk scores in cases and controls; (B) the cumulative incidence of each outcome (calculated using the Kaplan–Meier method) by protein-based score quintiles; (C) incidence rate estimates according to protein-based score deciles on a logarithmically scaled Y axis; and (D) the accuracies of the clinical, proteomic, and combined risk scores in predicting the indicated outcomes (quantified using the area under the receiver-operating characteristic curve [AUC] with corresponding 95% confidence intervals [CIs]). For (A), the vertical lines indicate the protein-based risk score values corresponding to a false positive rate (FPR) of 5.0%; the detection rates (DRs) indicate the “exact” detection rates, calculated as the unadjusted proportions of cases with a positive test result at the corresponding protein-based risk score threshold. For (C), incidence rate estimates are not displayed if the incidence of the indicated outcome in a protein score percentile bin was zero. All analyses were performed in the Women’s Health Initiative Long Life Study (WHI-LLS; n = 1,083). During a median (interquartile range) follow-up of 8.3 (5.6-8.9) years, 85 participants in the WHI-LLS cohort experienced coronary artery disease events, 100 experienced heart failure, and 182 atrial fibrillation. Source data
Extended Data Fig. 9
Extended Data Fig. 9. Risk prediction of incident atrial fibrillation by risk scores incorporating NT-proBNP and all proteins except NT-proBNP and NPPB.
The receiver-operating characteristics curves depict the accuracy of the clinical, proteomic, and combined risk scores in predicting atrial fibrillation events in the UKB-PPP testing set (n = 8,863). Areas under the curve (AUCs) and corresponding 95% confidence intervals (95% CIs) quantify the performance of each model. Models with multiple candidate features were constructed using logistic least absolute shrinkage and selection operator (LASSO) models; the combined models included all clinical predictors (see Methods) as well as the indicated biomarkers (that is, NT-proBNP or all proteins except NT-proBNP and NPPB) as potential covariates in the final model. Participants were followed for a median (interquartile range) follow-up of 11.1 (10.4–11.8) years. Source data
Extended Data Fig. 10
Extended Data Fig. 10. Risk prediction of incident heart failure by risk scores incorporating NT-proBNP and all proteins except NT-proBNP and NPPB.
The receiver-operating characteristics curves depict the accuracy of the clinical, proteomic, and combined risk scores in predicting heart failure events in the UKB-PPP testing set (n = 8,863). Areas under the curve (AUCs) and corresponding 95% confidence intervals (95% CIs) quantify the performance of each model. Models with multiple candidate features were constructed were constructed using logistic least absolute shrinkage and selection operator (LASSO) models; the combined models included all clinical predictors (see Methods) as well as the indicated biomarkers (that is, NT-proBNP or all proteins except NT-proBNP and NPPB) as potential covariates in the final model. Participants were followed for a median (interquartile range) follow-up of 11.1 (10.4–11.8) years. Source data

Update of

References

    1. GBD 2019 Diseases and Injuries Collaborators. Global burden of 369 diseases and injuries in 204 countries and territories, 1990–2019: a systematic analysis for the Global Burden of Disease Study 2019. Lancet396, 1204–1222 (2020). - PMC - PubMed
    1. Vaduganathan, M., Mensah, G. A., Turco, J. V., Fuster, V. & Roth, G. A. The Global Burden of Cardiovascular Diseases and Risk: a compass for future health. J. Am. Coll. Cardiol.80, 2361–2371 (2022). - PubMed
    1. Mortensen, M. B., Nordestgaard, B. G., Afzal, S. & Falk, E. ACC/AHA guidelines superior to ESC/EAS guidelines for primary prevention with statins in non-diabetic Europeans: the Copenhagen General Population Study. Eur. Heart J.38, 586–594 (2017). - PMC - PubMed
    1. Nurmohamed, N. S. et al. Proteomics and lipidomics in atherosclerotic cardiovascular disease risk prediction. Eur. Heart J.44, 1594–1607 (2023). - PMC - PubMed
    1. Fruchart, J. C. et al. The residual risk reduction initiative: a call to action to reduce residual vascular risk in patients with dyslipidemia. Am. J. Cardiol.102, 1K–34K (2008). - PubMed

MeSH terms

LinkOut - more resources